
 8 min read
 Technical picture
Bitcoin trades at $79,984 after a week that tested both edges of its range and finished back in the middle. The floor at $76,652 held on September 1, directly on top of the first imbalance left behind by the August advance, and the bounce carried price through $81,479.50 to an intraday high near $82,400 on September 3. That was also the day US spot Bitcoin ETFs took in $730.8 million, the largest single session since January 14, with BlackRock’s IBIT accounting for $453.96 million of it. Price closed back below the range high the same day.
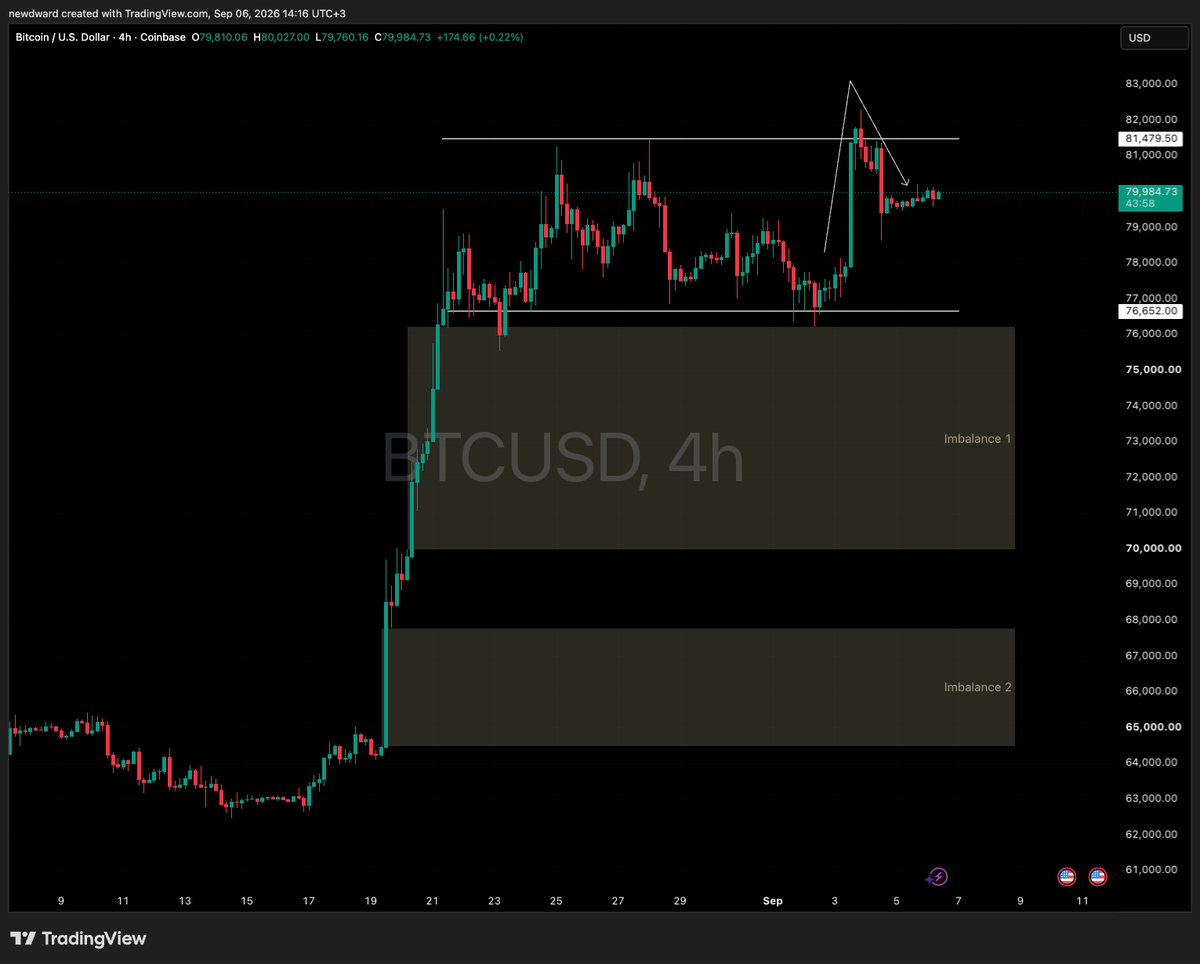
So the breakout failed inside one session and the structure from mid-August is intact: $76,652 at the base, $81,479.50 at the top, and price at $79,984 with neither side in control. CryptoQuant read the push as short covering rather than fresh long demand, which fits a rejection that fast. If $81,479.50 is reclaimed on a close, opens the path toward the 365-day moving average near $83,000. If $76,652 gives way, the imbalance below runs from roughly $70,000 to $76,100, and the liquidation map further down shows what is stacked there.
Crypto heatmap
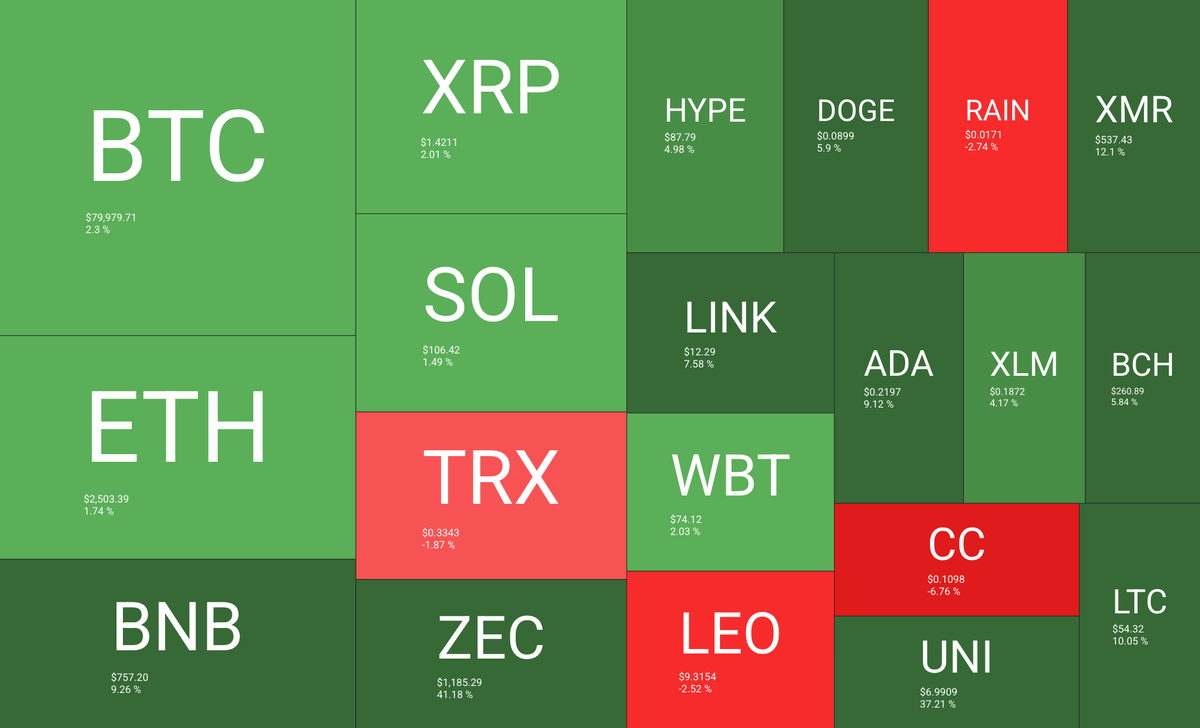
The heatmap is green almost everywhere, and the spread inside it is the story. Bitcoin added 2.3% to $79,979 and Ethereum 1.74% to $2,503, both well behind the mid-caps. The leaders are Zcash at 41.18%, Uniswap at 37.21%, Monero at 12.1% and Litecoin at 10.05%.
Source: https://quantifycrypto.com/heatmaps
Each leader has its own catalyst rather than a shared one. Zcash has the first US spot ETF for a privacy asset, covered in its own section below. Uniswap follows a record week of protocol fees near $25 million, $21 million of it from Robinhood Chain, where the protocol handled 76% of $1.49 billion in daily DEX volume, with fees routed into a burn that has retired close to $160 million of UNI. BNB at 9.26% is trading off the Pasteur hard fork of August 25, which doubled testnet throughput from 1,237 to 2,324 transactions per second. The red squares are small and idiosyncratic: CC at 6.76%, RAIN at 2.74%, LEO at 2.52% and TRX at 1.87%.
Altcoin Season Index
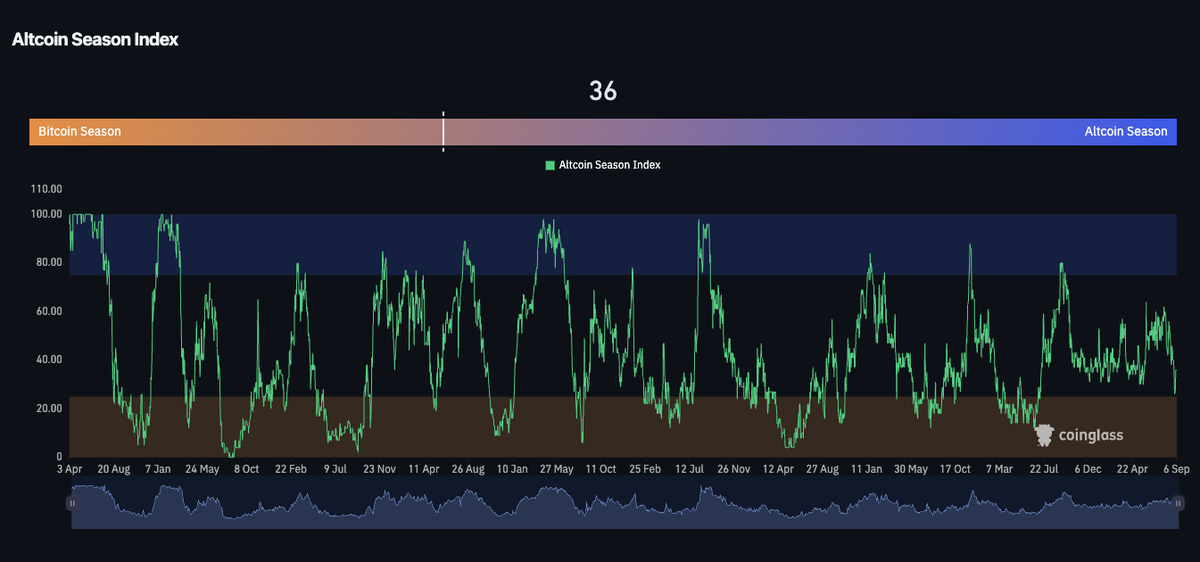
The Altcoin Season Index reads 36, up from 30 a week ago. The scale needs 75, meaning 75 of the top 50 coins outperforming Bitcoin over 90 days, so the weekly uptick does not change the regime.
Source: https://www.coinglass.com/pro/i/alt-coin-season
Bitcoin dominance was 60.15% in late August after clearing the descending trend line from June 2025, and the index has spent the year below 50 apart from brief spikes. The heatmap above is consistent with that reading: the outperformance is concentrated in three or four names with specific catalysts rather than spread across the board, which is what an actual rotation looks like.
Fear and Greed Index
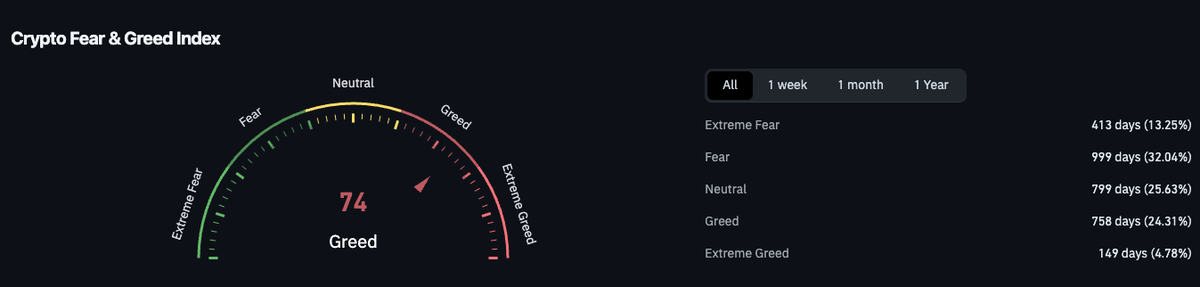
The Crypto Fear and Greed Index reads 74, up from 68 a week ago and one point below the Extreme Greed threshold. On the gauge’s own history, Extreme Greed accounts for 149 days of the sample, or 4.78%, against 999 days of Fear.
Source: https://www.coinglass.com/pro/i/FearGreedIndex
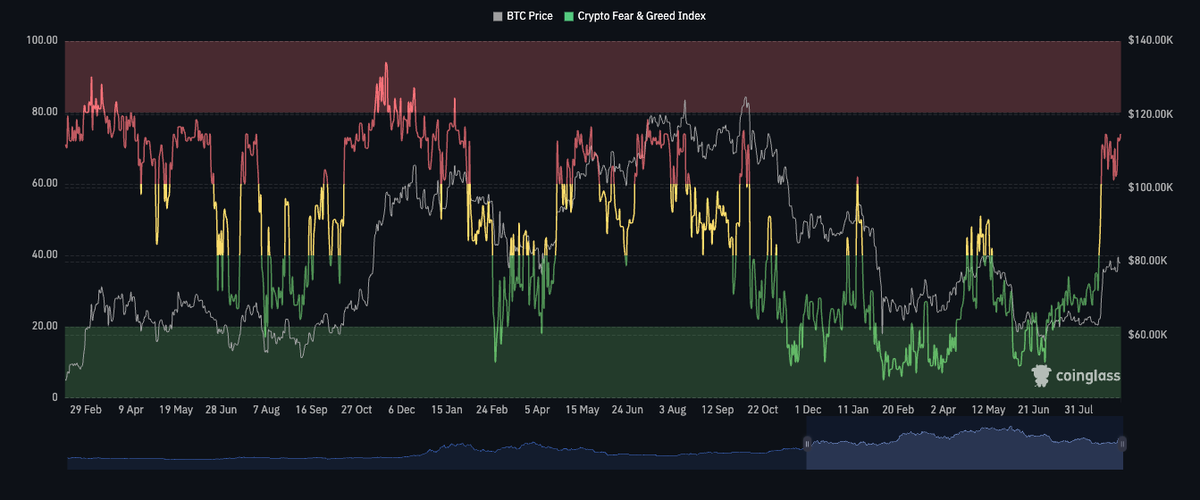
The history chart tracks the Bitcoin price line closely, which is expected given how the index is built, and it shows how fast the reading moved out of the low 20s in late June. The last time it printed 74, on October 5, 2025, the market lost $19 billion in leveraged positions five days later in the largest single-session liquidation on record. That is one analogue rather than a pattern, but at this reading leveraged positions have the least room, and the liquidation map below prices exactly that.
Altcoin market cap outside the top ten
Total crypto market cap excluding the top ten sits at $212.15 billion, up 8.71% on the month with the September candle still open. The monthly chart shows a morning star: a long red candle, a small-bodied candle on the $150.49 billion shelf that has held since 2024, and a green candle that has already recovered the first candle’s range.
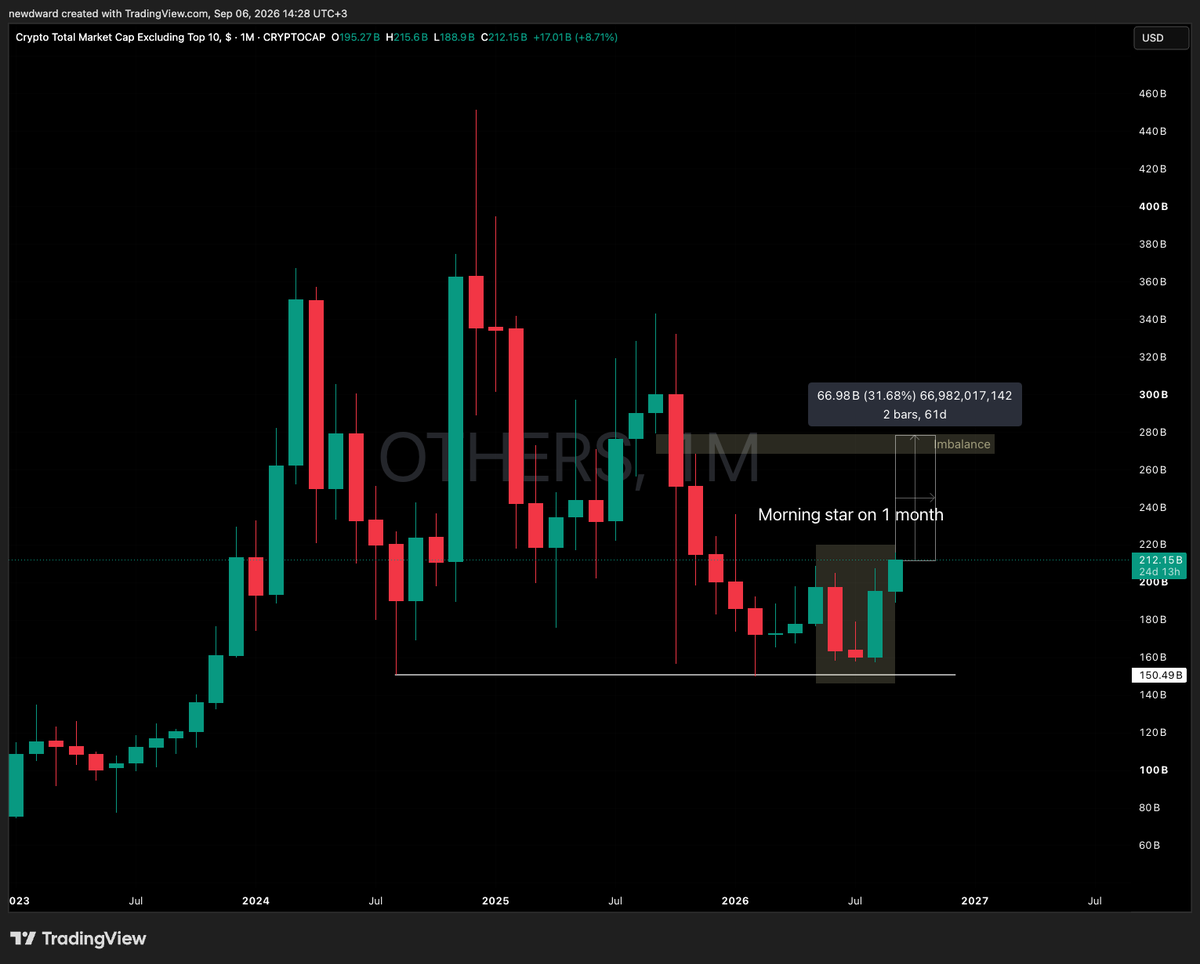
Two things qualify it. The third candle has 24 days left before it closes, so the pattern is not confirmed, and a single monthly signal on an index this broad is a low-resolution instrument. What it does mark is the level: $150.49 billion has now been defended three times. The imbalance above runs from roughly $255 billion to $275 billion, and closing it would be a 31.68% move from here, which is the kind of number the Altcoin Season Index above would have to register.
Zcash accelerates
Zcash closed at $1,174.47 on Saturday, up 14.48% on the day with a high of $1,220. Measured from the symmetrical triangle it left near $491.94 in mid-August, that is 161.82% in 26 sessions. Three things stacked up. Grayscale converted its nine-year-old Zcash Trust into the ZCSH spot ETF on NYSE Arca on August 25, the first US exchange-traded product with direct Zcash exposure, launching with over $313 million and reaching roughly $414 million within ten days.
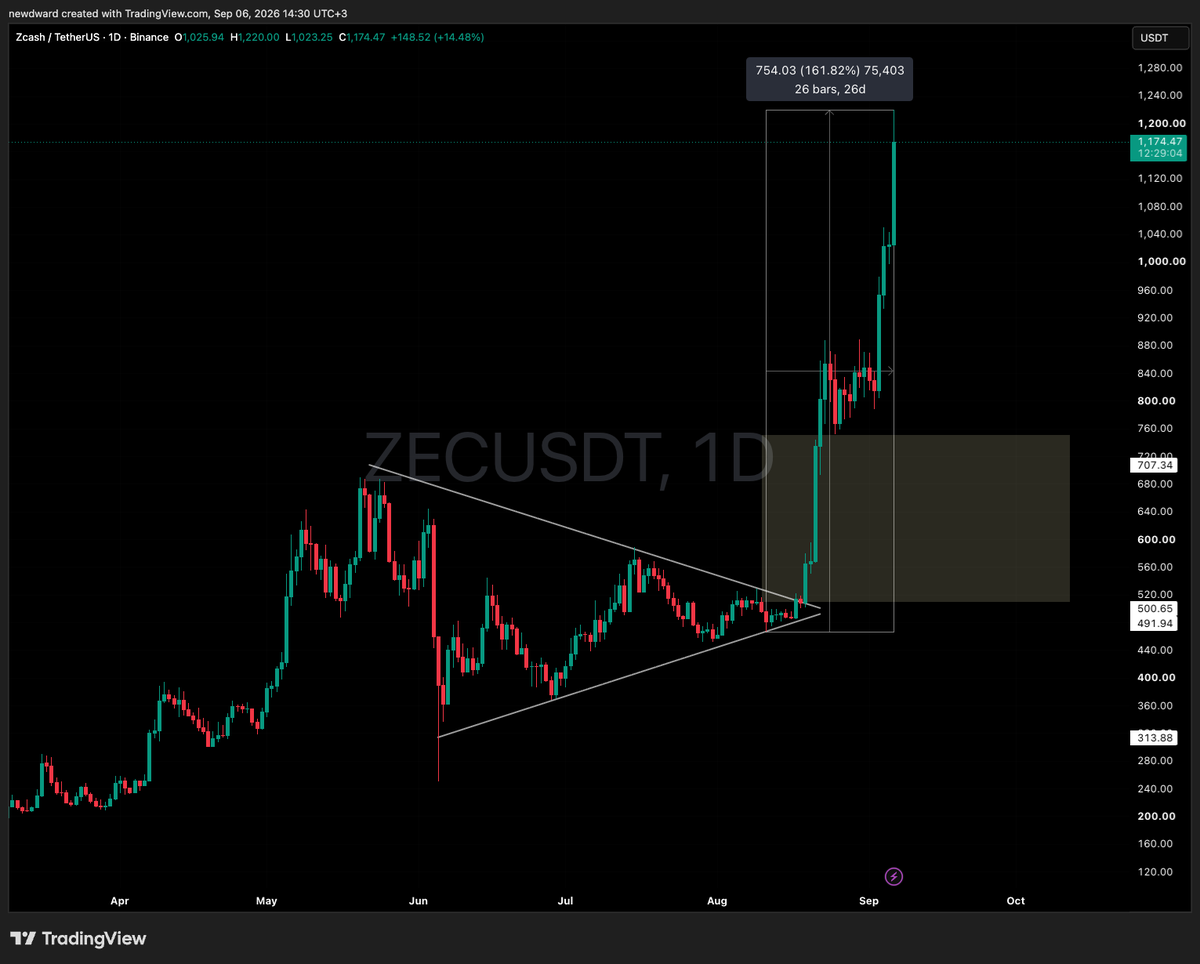
The SEC closed its investigation into the Zcash Foundation in January 2026 without enforcement action, and the July Ironwood upgrade fixed the critical flaw disclosed in June. Over twelve months the move is roughly 2,000% to 2,300% depending on the start date. It has also pulled the rest of the privacy basket along: Monero at 12.1% on the heatmap above, and Dash up 17% as the Zcash ETF crossed $400 million. Candles like this rarely finish without a redistribution phase, and the more of the move that is financed with leverage, the sharper that phase tends to be.
Bitcoin liquidation map
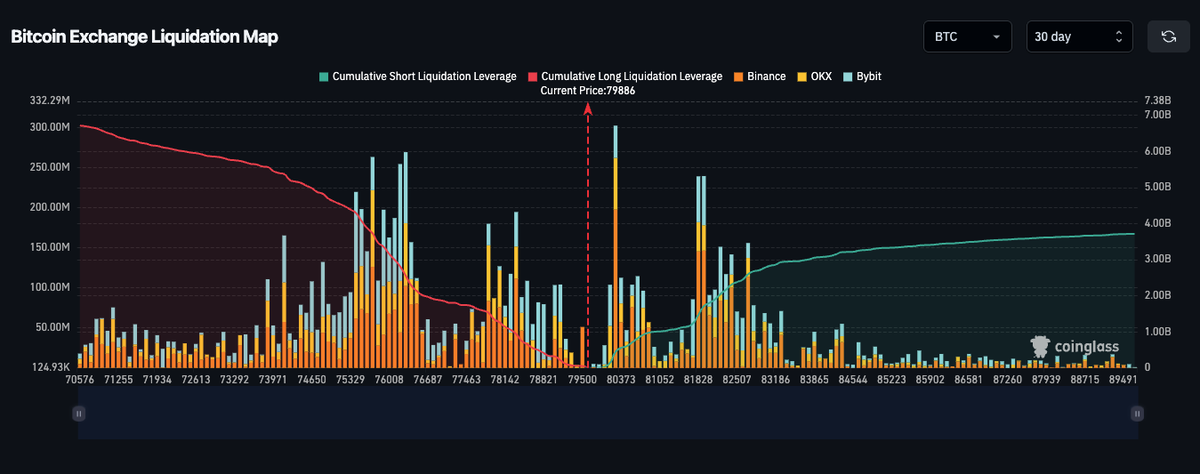
With Bitcoin at $79,886 on the map, the heaviest short liquidation level sits at $80,373, just above spot, carrying over $300 million and concentrated on OKX and Bybit. A second pair of clusters of roughly $240 million each sits at $81,828, right at the range high the September 3 candle failed to hold. On the long side the dense band runs from $75,329 to $76,687, with a thinner shelf near $78,142.
Source: https://www.coinglass.com/pro/futures/LiquidationMap
That is a symmetrical trap. The fuel for another attempt at $81,479.50 sits directly above spot, and the fuel for a sweep of the range low sits directly under the $76,652 floor from the technical section. Cumulative short liquidation leverage above the market reaches roughly $3.8 billion by $89,491, against about $300 million of long leverage down at $70,576.
Conclusion
The week ends with the pieces pointing in different directions. Flows were the strongest since January and the range low held on the imbalance, but the breakout lasted one session and CryptoQuant attributes the push to short covering. Sentiment at 74 is one point from Extreme Greed while the Altcoin Season Index at 36 says capital is not rotating broadly. The genuine strength is narrow: Zcash on an ETF, Uniswap on fees, BNB on a throughput upgrade. Until $81,479.50 closes above or $76,652 gives way, the liquidation map is the map that matters.
Trading involves risk.
Author



 Risk Disclaimer
The content provided here is for informational purposes only. It is not intended as personal investment advice and does not constitute a solicitation or invitation to engage in any financial transactions, investments, or related activities. Past performance is not a reliable indicator of future results.
The financial products offered by the Company are complex and come with a high risk of losing money rapidly due to leverage. These products may not be suitable for all investors. Before engaging, you should consider whether you understand how these leveraged products work and whether you can afford the high risk of losing your money.
The Company does not accept clients from the Restricted Jurisdictions as indicated in our website/ T&C. Some services or products may not be available in your jurisdiction.
The applicable legal entity and its respective products and services depend on the client’s country of residence and the entity with which the client has established a contractual relationship during registration.








