
 8 min read
 Technical picture
Bitcoin closed the week near $63,200 and has now spent six weeks inside the same band, with a floor around $62,500 and a ceiling near $67,000. Nothing in the past month has changed that.
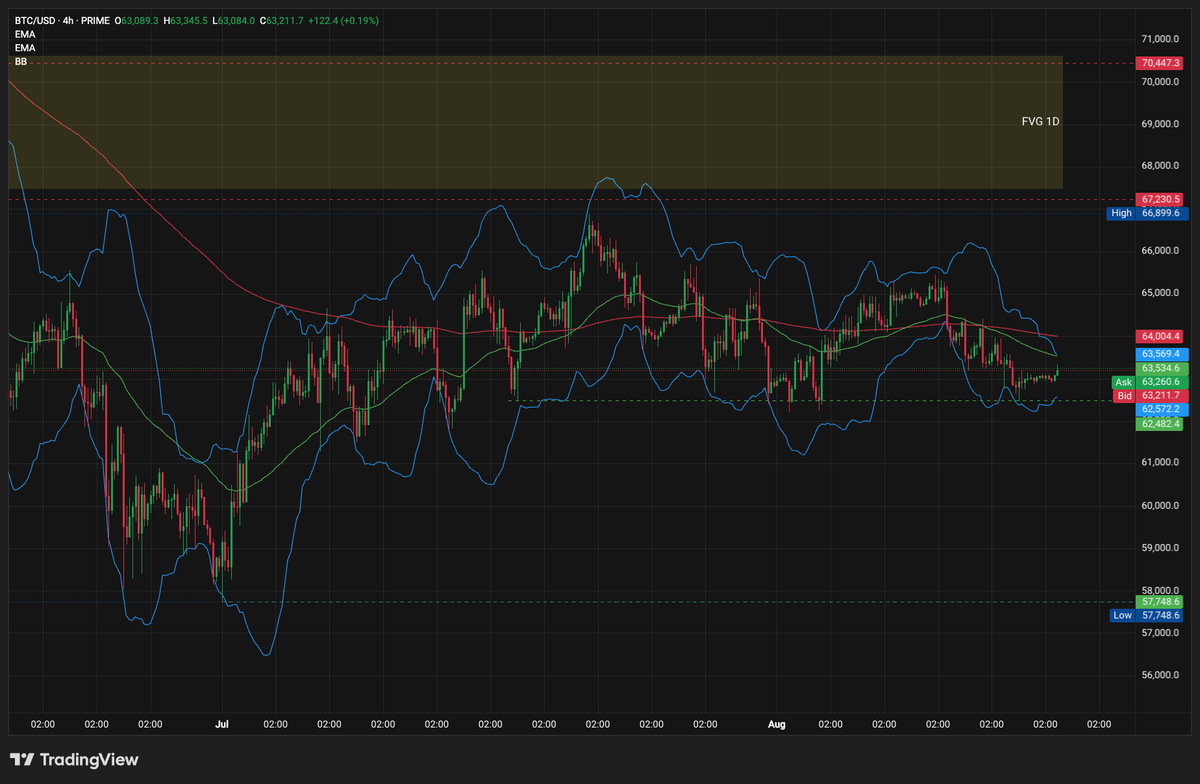
Two details stand out. Price is pinned to the middle of the Bollinger bands, and the two moving averages have flattened and converged. That combination describes a market waiting for a reason, not one building a trend.
The practical problem is execution rather than direction. In a band this tight, moves usually arrive in stages: one push clears the stops above, the next clears the stops below. The unfilled daily gap that begins near $67,000 is the first real objective if buyers take the range apart, and it has sat untouched since price fell through it. The futures data later in this report explains where the patience is coming from.
Crypto heatmap
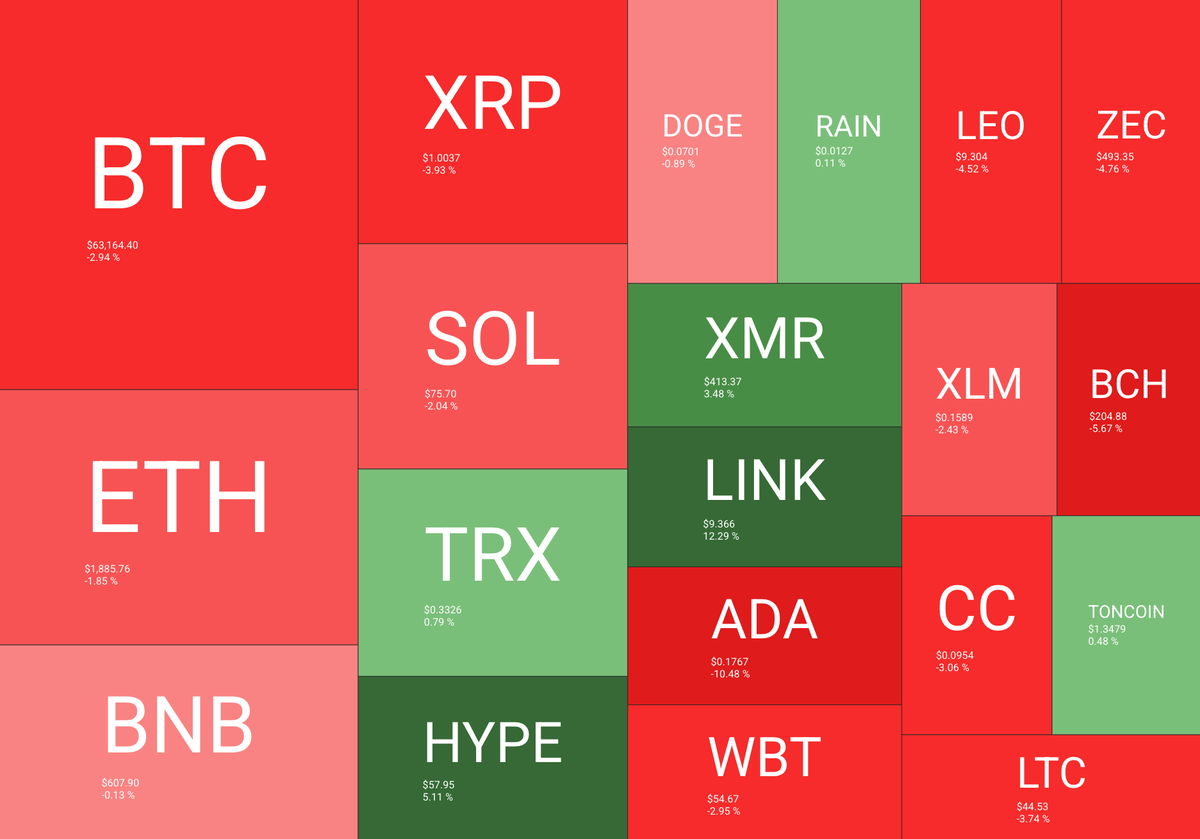
The board was mostly red again. Bitcoin lost close to 3% on the week and the large caps followed, which is the normal pattern when no fresh capital is arriving.
Source: https://quantifycrypto.com/heatmaps
Two names broke away. Chainlink gained the most, above 12%, after Standard Chartered published a long-term forecast on August 10 and the token then cleared its 50, 100 and 200-day averages in two separate sessions. The sequence matters: the forecast landed first, the buying came on the technical breaks.
Cardano was the mirror image, down about 10% and back near multi-year lows. Large holders have been distributing since June, when the biggest wallets sold roughly 180 million tokens in a matter of days. Nothing in the price action since suggests that has reversed.
Altcoin Season Index
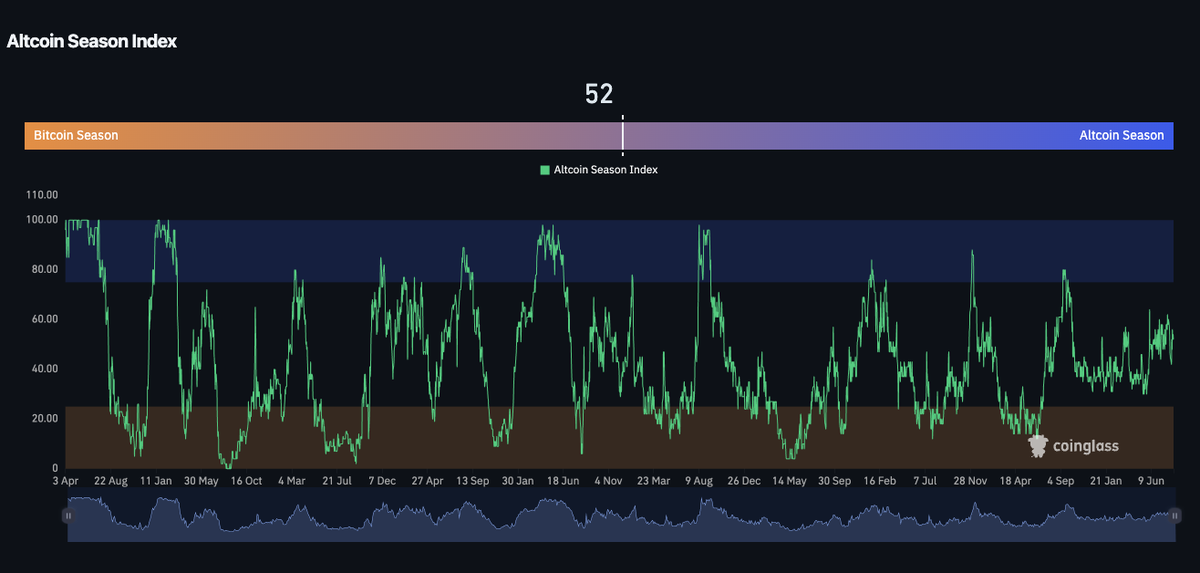
The index rose to 52 from 44 a week ago, which places it in the middle of its range. Readings above 75 mark a real altcoin season and readings below 25 mark bitcoin dominance, so the market currently sits in neither.
Source: https://www.coinglass.com/pro/i/alt-coin-season
A drift like this, without a matching move in price, usually reflects rotation between individual names rather than broad appetite for risk. The split between Chainlink and Cardano above is the same story from a different angle. It also looks like the familiar process of shaking out weaker holders before the market commits to anything.
Fear and Greed Index
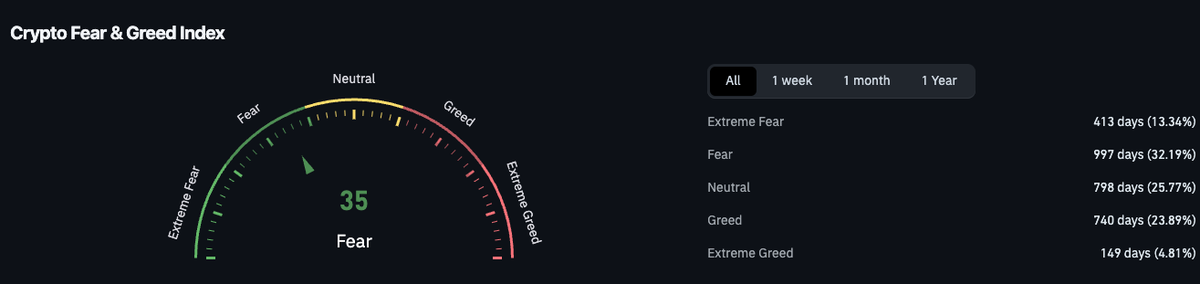
The index moved from 32 to 35, which is barely a move at all. It stays in the Fear zone, where it has spent most of this year.
Source: https://www.coinglass.com/pro/i/FearGreedIndex
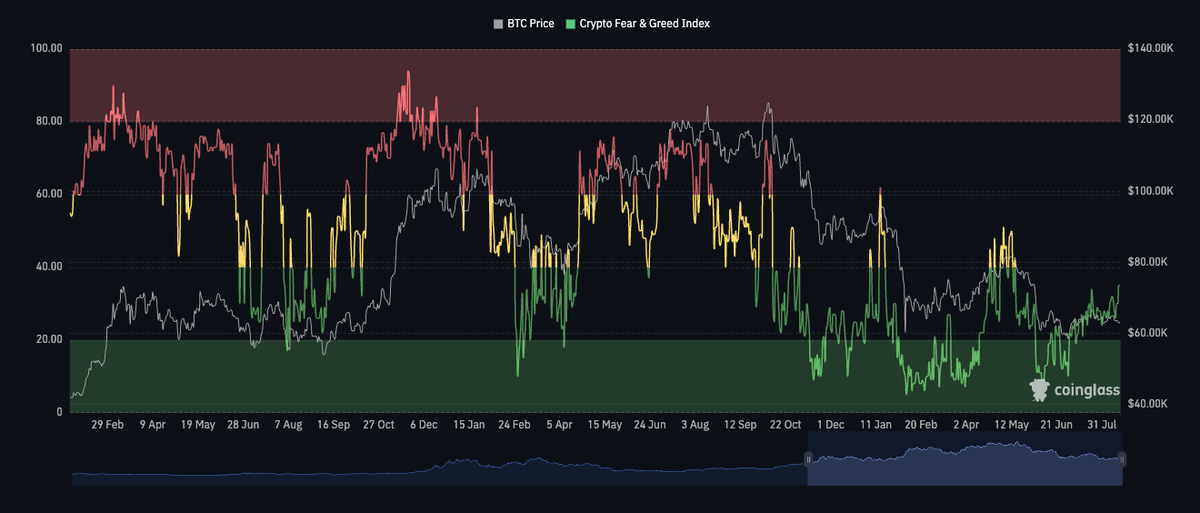
The historical record is the useful part here. Across the whole life of the index, Fear has been the single most common state, covering roughly a third of all days, while Extreme Greed has appeared on fewer than one day in twenty. A reading in the mid-thirties is not a contrarian signal on its own. It is closer to the market’s default setting.
There is a subtler risk in the drift higher. When sentiment improves while price stays flat, it usually means the crowd is stepping back in before the market has given it a reason, and that combination has more often preceded another leg down than a durable low.
Inflation is still elevated
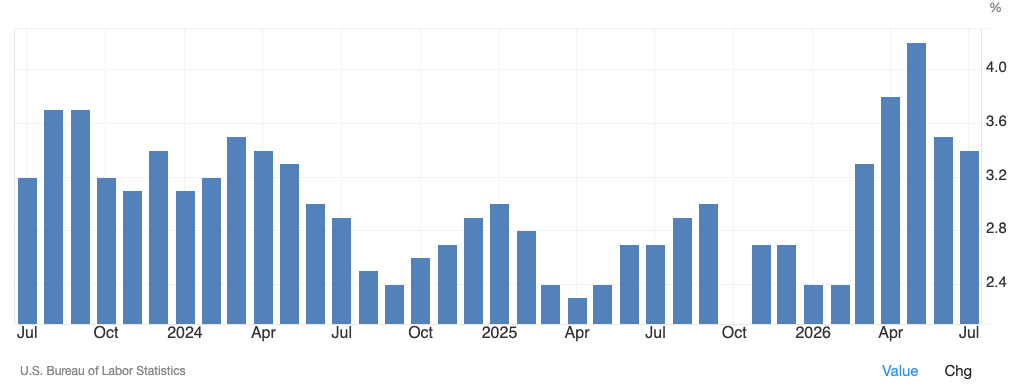
Headline inflation came in at 3.4% for July, a shade below June and still far from where the Fed wants it. The chart shows the shape of the year: the rate climbed sharply through the spring, peaked in May, and has eased only slightly since.
Source: https://tradingeconomics.com/united-states/inflation-cpi
The composition matters more than the headline. Core inflation, which excludes food and energy, is running at 2.5% and drifting lower. Energy is doing the damage, up almost 15% over the year. That traces directly to the Iran conflict and the closure of the Strait of Hormuz, which cut regional exports sharply in July and left Brent trading in an unusually wide range before settling near $92.
This leaves the Fed with an awkward call. It held rates in July with three members dissenting in favor of a hike, and markets leaned toward a September increase until the July payrolls report showed the economy shedding jobs. A supply shock that rates cannot fix, alongside a cooling labor market, does not resolve quickly. For bitcoin the channel is the dollar: as long as energy keeps the hike debate alive, dollar strength stays a headwind.
The weekly chart still leans bearish
On the weekly timeframe the picture is simpler and less friendly. Price sits below both the 50-week and the 200-week moving averages, and the faster line has turned down through the slower one.
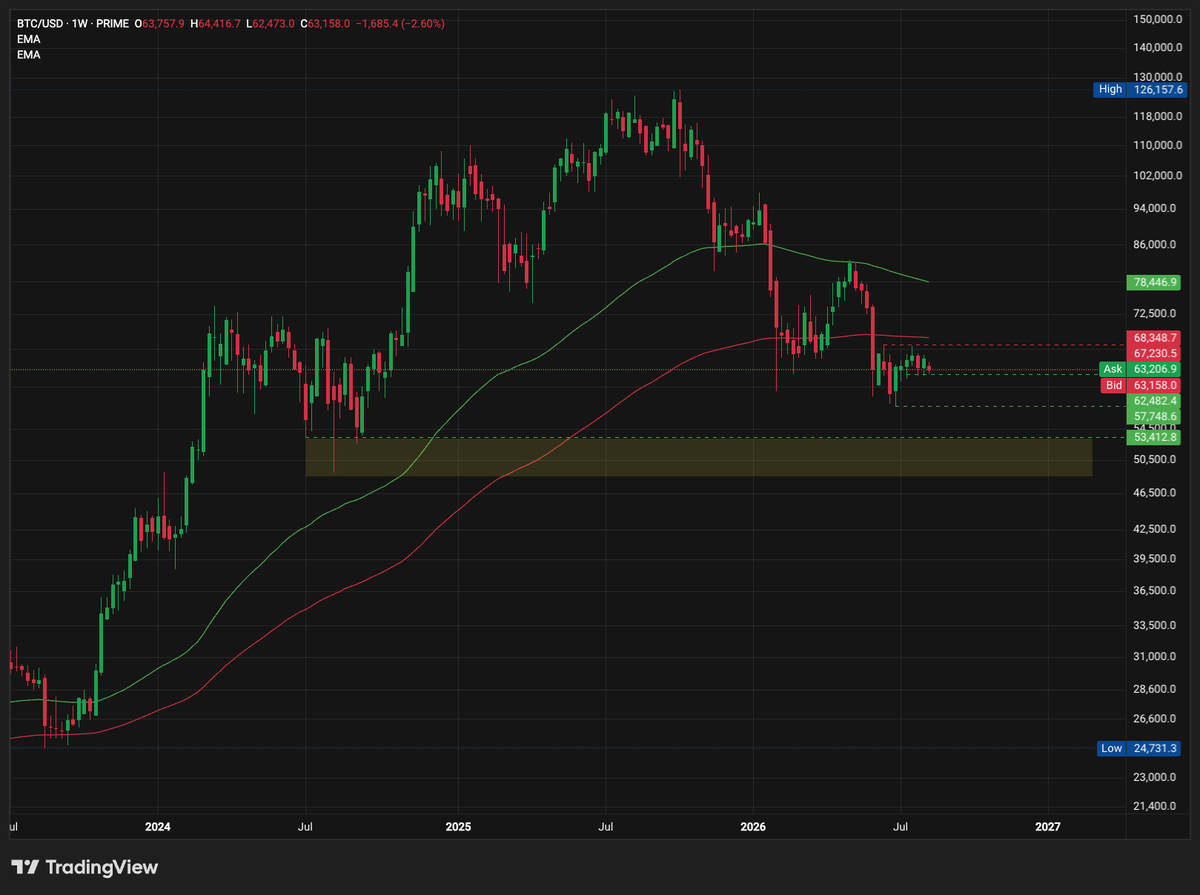
Bitcoin is trading at roughly half its October 2025 peak. Measured against past cycles that is mild, since the 2018 decline reached 84% and the 2022 decline came close to 78%. The distance between this drawdown and those two is the strongest argument that the correction has not fully played out.
The shaded band near $50,000 marks the previous cycle’s range and lines up with the last untested support below. If the July low around $57,700 gives way, that band becomes the next reference. Seasonality offers no comfort either: August has closed red in nine of the last thirteen years, including each of the last four.
Bitcoin futures volume keeps shrinking
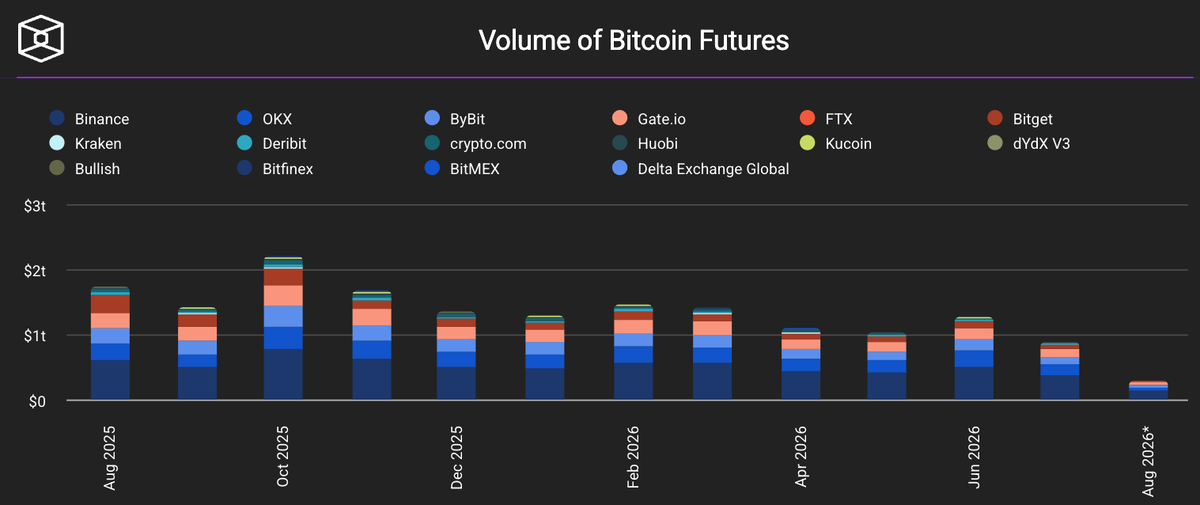
Monthly futures volume has been falling since the October 2025 peak, when activity across the major venues topped $2 trillion. July printed near the bottom of the range and August, with half the month gone, is tracking well below it.
Source: https://www.theblock.co/data/crypto-markets/futures/volume-of-bitcoin-futures-monthly
The month is not finished, so the final bar will grow. The direction is clear enough regardless. Perpetual futures volume on Binance recorded its sixth-lowest day in five years on August 8. Kaiko and CryptoQuant both attribute the contraction to seasonal quiet and low volatility rather than to any single event.
This is the mechanical explanation for the range described at the top of this report. Ranges rarely break on their own. They break when new money arrives.
Bitcoin liquidation map
The map shows where leveraged positions would be forced out. Below spot, the heaviest clusters sit between roughly $61,300 and $62,200, concentrated in the highest leverage tiers. Above spot, the largest single cluster sits just under $66,000.
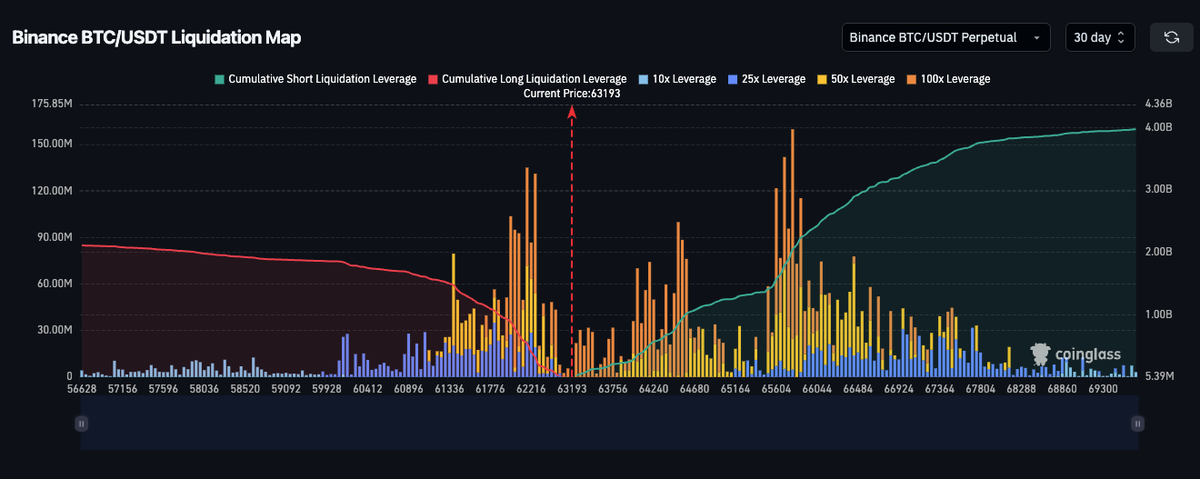
Source: https://www.coinglass.com/pro/futures/LiquidationMap
The asymmetry is the useful part. Cumulative leverage stacked above the current price is close to twice what sits below it, so an upward move would force out more positions than an equivalent move down. Those positions are shorts, and short liquidations are what accelerate a rally once one starts.
That is a statement about fuel, not about direction. It does not say that either break is due.
Conclusion
The week gave traders very little. Volatility is low, futures volume is thin, and sentiment has crept up without price following, which is the mix that produces stop-outs rather than trends. The weekly chart is still under its long-term averages and the drawdown from the 2025 peak remains shallow next to previous bear markets, so waiting costs less here than positioning.
Liquidity is the thing to track. The range described at the start of this report holds until fresh volume shows up, and the leverage map suggests that whenever it does, the first move will be a fast one.
Trading involves risk.
Author



 Risk Disclaimer
The content provided here is for informational purposes only. It is not intended as personal investment advice and does not constitute a solicitation or invitation to engage in any financial transactions, investments, or related activities. Past performance is not a reliable indicator of future results.
The financial products offered by the Company are complex and come with a high risk of losing money rapidly due to leverage. These products may not be suitable for all investors. Before engaging, you should consider whether you understand how these leveraged products work and whether you can afford the high risk of losing your money.
The Company does not accept clients from the Restricted Jurisdictions as indicated in our website/ T&C. Some services or products may not be available in your jurisdiction.
The applicable legal entity and its respective products and services depend on the client’s country of residence and the entity with which the client has established a contractual relationship during registration.








