8 min read
 The Support Held
Last week we flagged the blue support block as the level price was likely to test, and that is where the week was decided. Bitcoin wicked to roughly 75,000 on September 16 and 17, held the top of the zone between 75,568 and 76,229, and then rebuilt fast. On Friday it reclaimed $80,000 with a move of more than 5%, and the 4h chart now closes at 81,391.
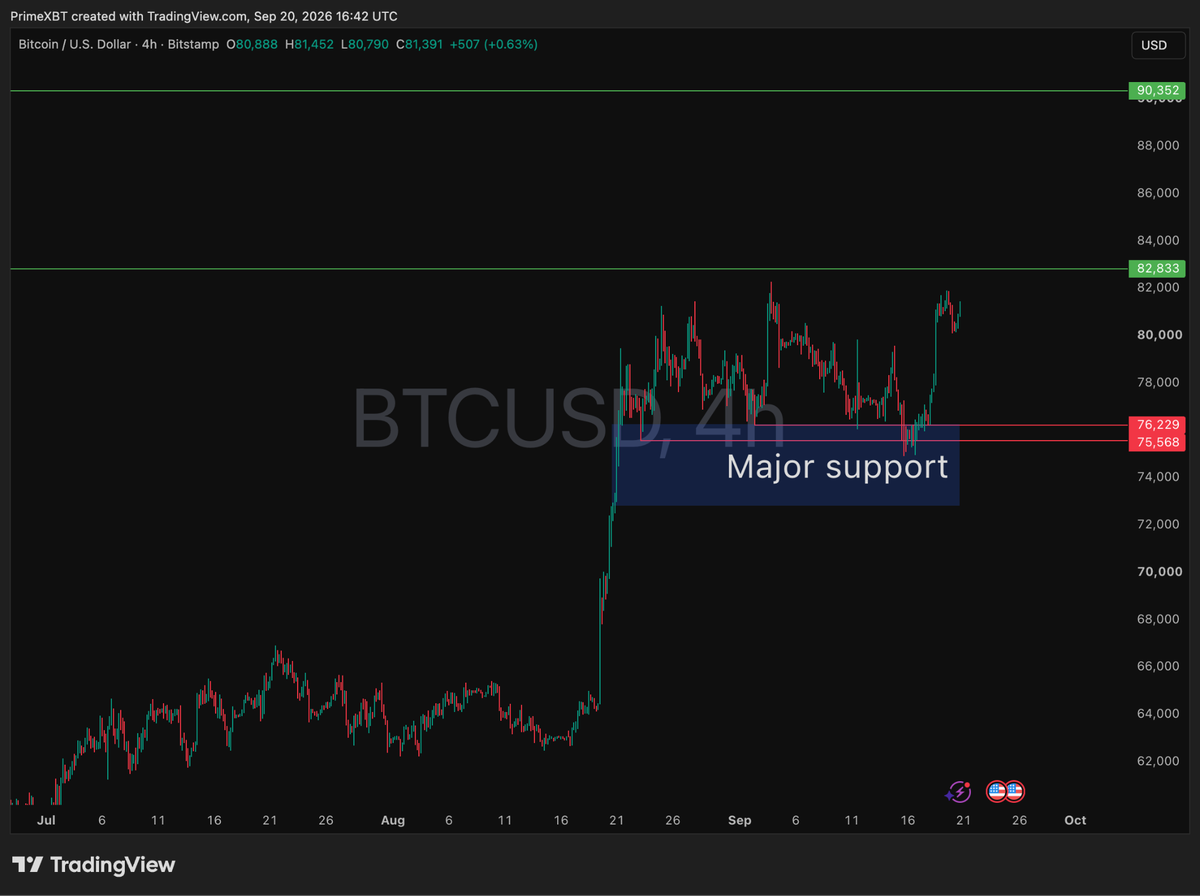
The bounce came off the same zone that has caught every pullback since the August breakout, which keeps the structure intact. The first reference above is 82,833, the upper edge of the range that has capped price since late August. A clean break there opens the path toward the next green level at 90,352. If the range top rejects price again, the 75,568 to 76,229 block remains the line that separates a pullback from a change in structure.
Crypto Heatmap: Mid-Caps Take the Lead
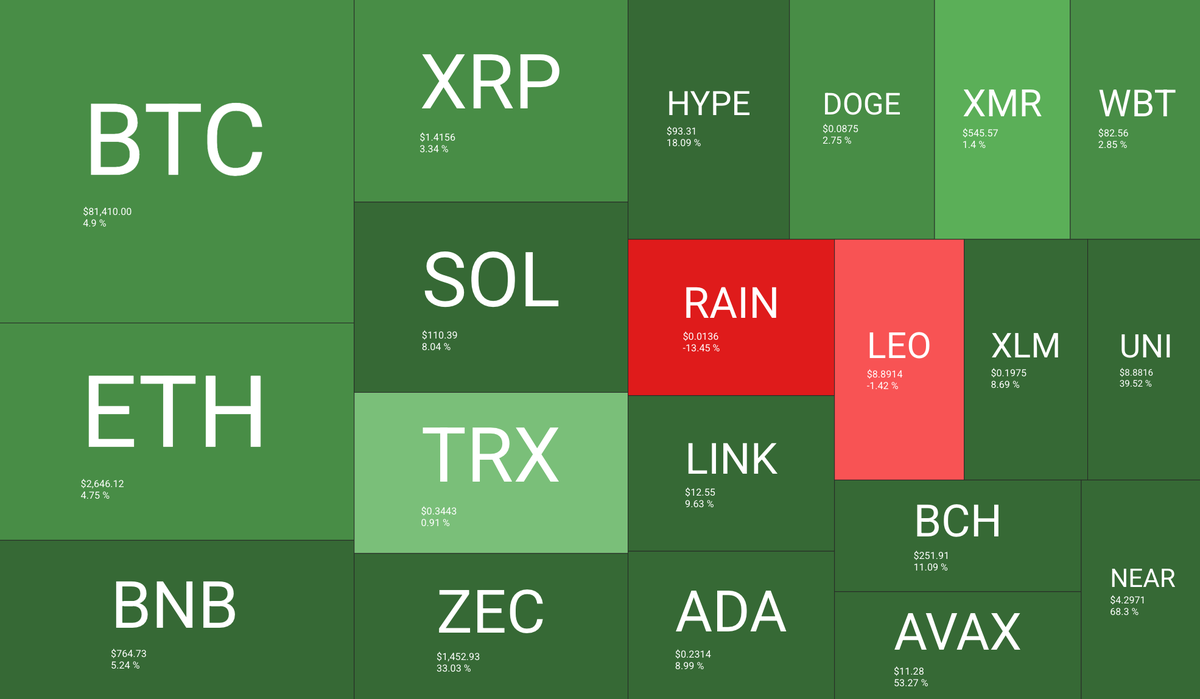
The weekly map is almost entirely green. Bitcoin gained 4.9% to $81,410, Ether 4.75% to $2,646, and BNB 5.24% to $764.73. XRP added 3.34% and TRX only 0.91%, the laggard among the large caps. The two red tiles were RAIN, down 13.45%, and LEO, down 1.42%.
Source: https://quantifycrypto.com/heatmaps
The real action was further down the cap table. NEAR led with 68.3%, AVAX added 53.27% and UNI 39.52%. ZEC gained 33.03% to $1,452.93, HYPE 18.09% to $93.31, and SOL 8.04% to $110.39. Friday did most of the work: Solana and Hyperliquid each rose about 10% on the day, with HYPE printing record highs above $90, as the SEC released an innovation exemption for tokenized stocks and the CFTC filed crypto rulemaking with the White House. That regulatory push offset the Clarity Act stalling in the Senate.
Altcoin Season Index Climbs to 58
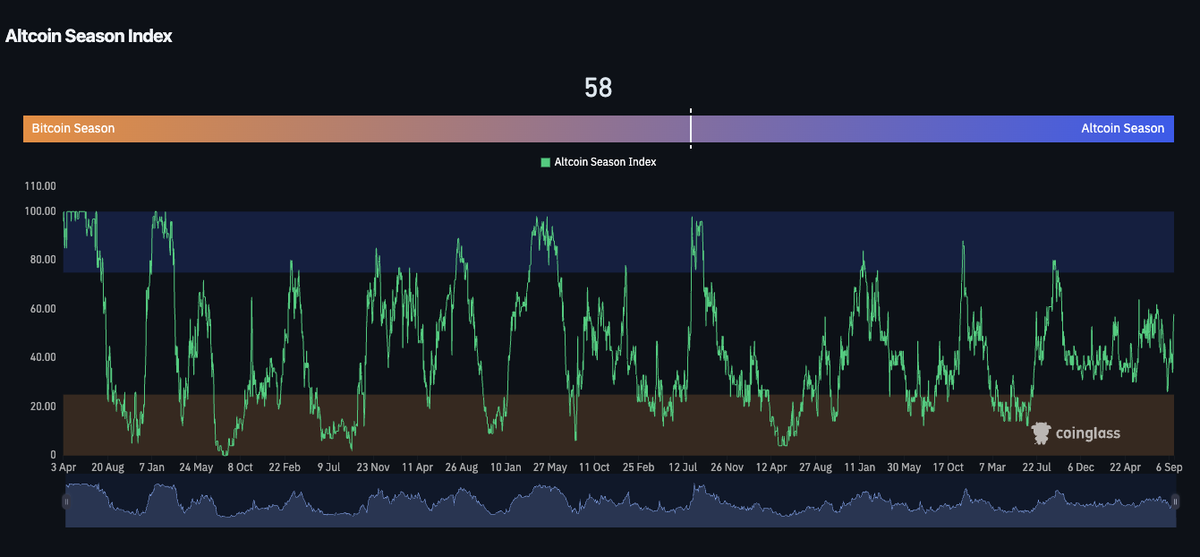
The index rose to 58 from 44 a week earlier, its highest reading in several weeks.
Source: https://www.coinglass.com/pro/i/alt-coin-season
Fifty-eight still sits in the middle of the scale, well short of the 75 threshold that defines an altcoin season. The move says breadth is improving, not that capital has rotated out of Bitcoin. With macro still tight after the Fed hike, a push through 75 would need altcoins to keep outperforming on down days as well as up days.
Fear and Greed Index Back in Greed
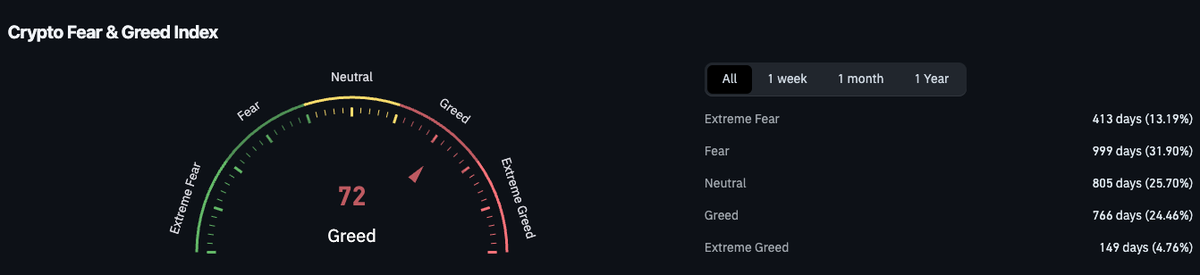
Sentiment climbed to 72, up from 60 a week ago, after a midweek dip into the low 50s while Bitcoin tested support.
Source: https://www.coinglass.com/pro/i/FearGreedIndex
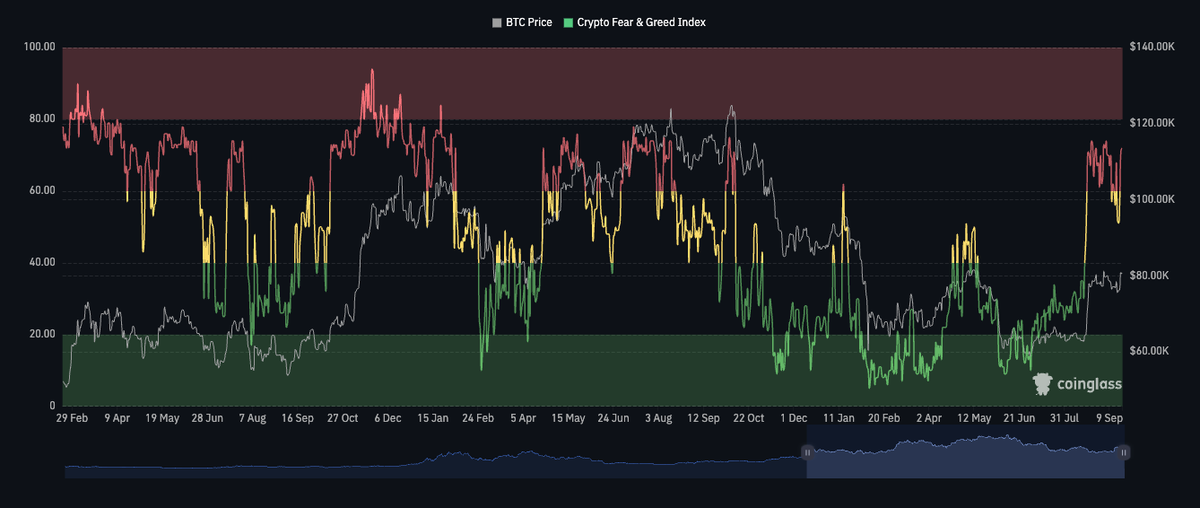
The history chart shows the index cooling for about a week and then turning higher again, which is how sustained trends tend to breathe. The next reference is 80, where the reading moves into extreme greed. Historically the market has spent only 149 days, or 4.76% of the time, in that zone, and a push into it has often marked a point where a trend needs to pause. Until then, sentiment is not an obstacle on its own.
The Fed Hikes for the First Time Since 2023
On September 16 the Federal Reserve raised rates by 25 basis points to a range of 3.75% to 4.00%. It was the first rate change of 2026 and the first increase since 2023. The vote was 12-0, and Chair Kevin Warsh was blunt: inflation is too high and has been for too long. August CPI ran at 3.4% year over year, up from 2.4% in February.
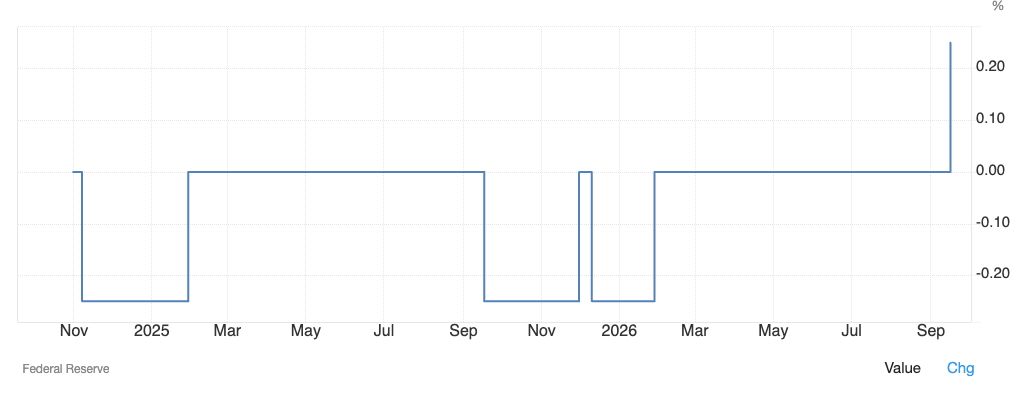
The decision matters beyond the quarter point. The White House has pressed publicly for rates of 1% or lower, and the hike lands less than two months before the midterm elections. By hiking anyway, the Fed signalled that its own inflation read outranks political pressure, and markets now price one more increase in December. For crypto, the more telling detail is that Bitcoin rallied through the decision rather than selling off on it. A hawkish Fed that the market has already priced tends to matter less than one that surprises, and last week’s reaction suggests the first category.
Investor Cost Basis: Mean Reclaimed, ETF Level Ahead
Bitcoin is back above the True Market Mean, the average cost basis of active investors, at $76,660. It slipped under that line in mid-September and reclaimed it last week, which puts the on-chain regime back in bullish territory. Price has also cleared the corporate treasury cost basis at $80,421.
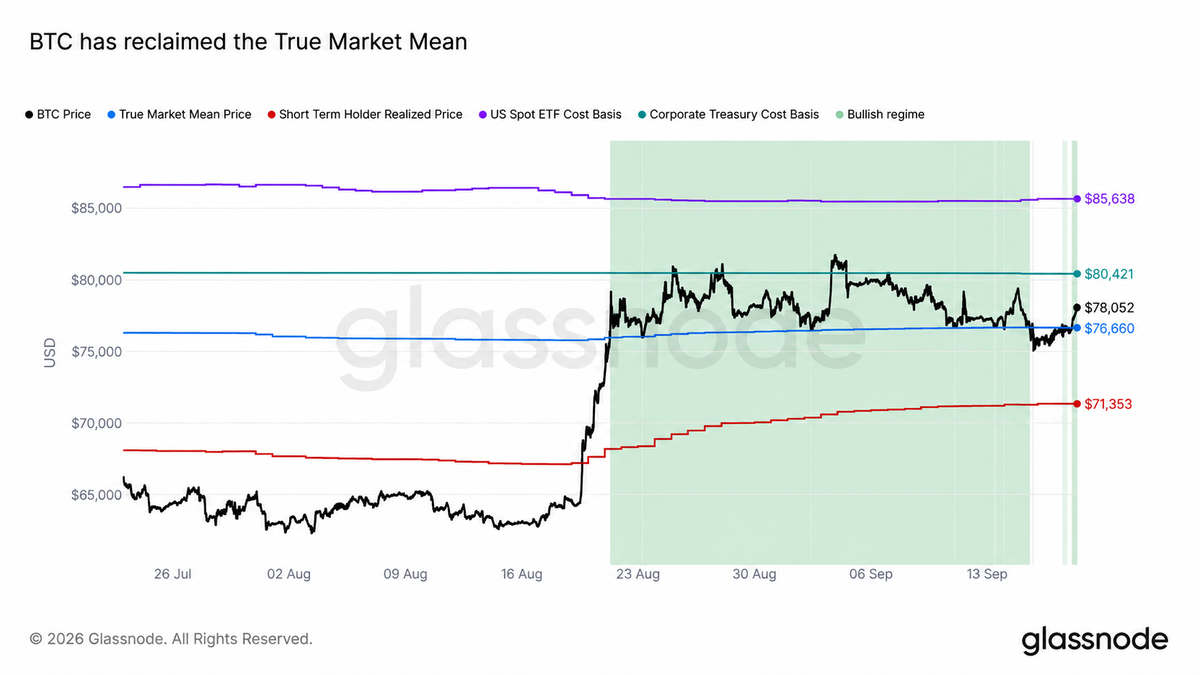
The next heavy reference is the US spot ETF cost basis at $85,638. That is where the average ETF holder breaks even, and levels like this often bring supply from buyers happy to exit flat. Below, the short-term holder realized price sits at $71,353, well under spot and a long way from any stress.
ZEC Tests Its Neckline Again
The ZEC perpetual chart shows a fractal worth watching. In early September price built what looked like a double top near 1,290, dropped through the 1,107.55 neckline, collected the liquidity underneath and then reversed higher. The pattern is repeating one level up: a double top formed near 1,600 last week, and price now sits at 1,449, just above the 1,424.20 neckline.
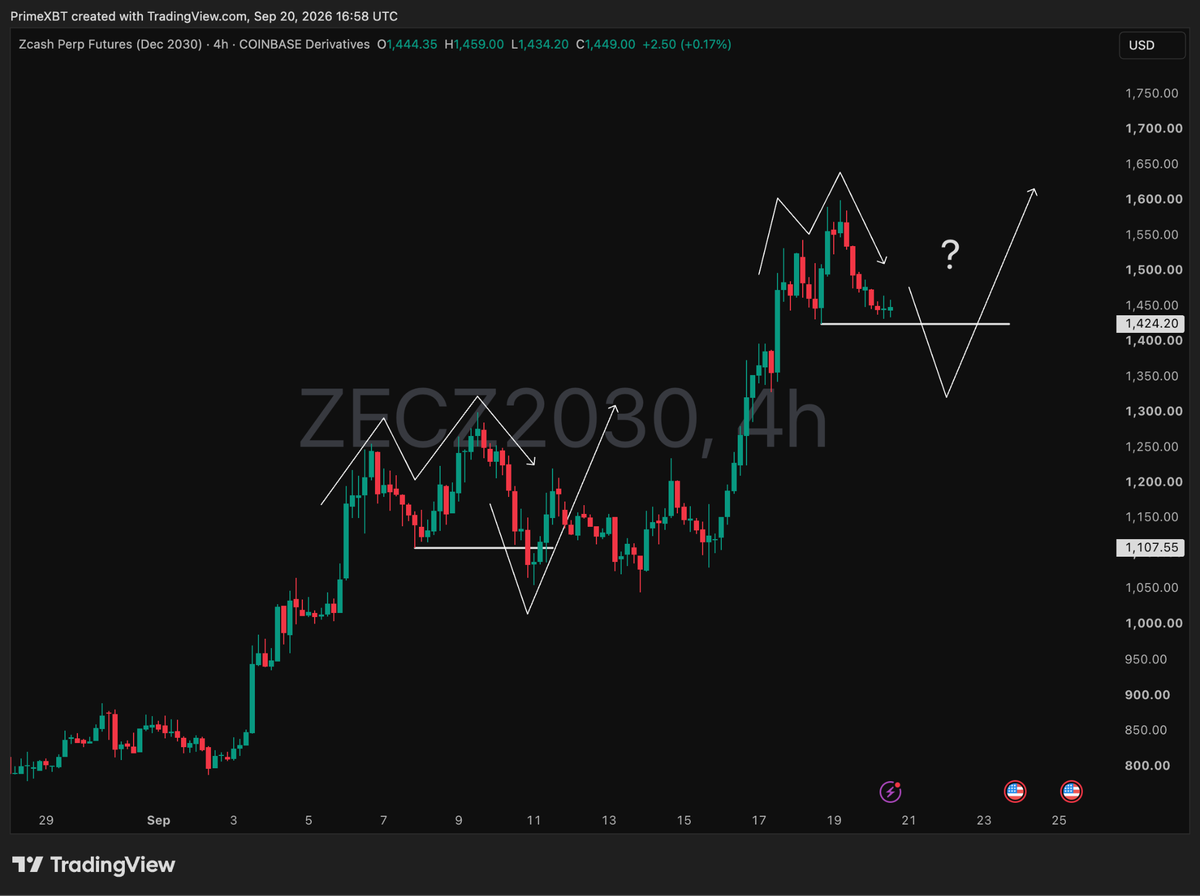
If the September script plays out again, a sweep below 1,424.20 toward the 1,330 area would be the stop run, and a fast recovery above the neckline would confirm it. A close below that zone without a quick reclaim would turn the double top into a real one. The backdrop is supportive: Grayscale’s spot Zcash ETF, launched on August 25, held about $362 million in assets by early September.
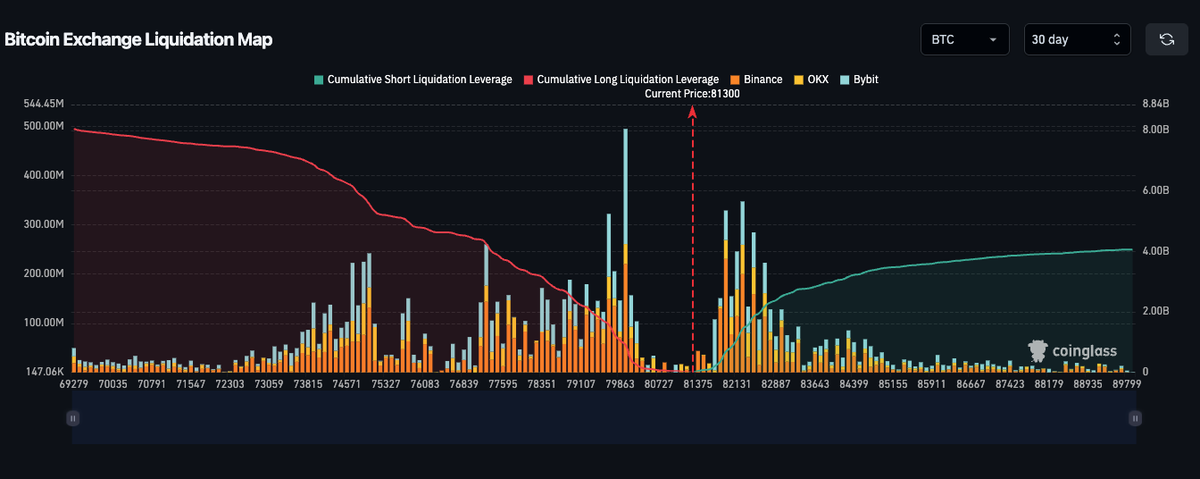
Bitcoin Liquidation Map
The heaviest long liquidation cluster sits near 79,860, just under current price at 81,300. The largest short cluster is stacked between 82,100 and 82,300, right at the 82,833 range top from the price chart.
Source: https://www.coinglass.com/pro/futures/LiquidationMap
Both pools are within about 1.5% of spot, so a move in either direction can accelerate quickly. If price sweeps 79,860 and reverses, that would read as a stop run rather than a breakdown, and the short cluster above becomes the next magnet. Across the mapped range, cumulative long leverage is roughly twice the short side, so a downside flush carries more fuel than a squeeze higher.
Conclusion
The picture is constructive across Bitcoin and the alts: support held, the True Market Mean is reclaimed, and breadth is widening. The hurdles are clear too. The 82,833 range top and the ETF cost basis at $85,638 sit overhead, and Friday’s Deribit quarterly expiry puts about $14.7 billion of Bitcoin options open interest on the table, with max pain near $72,000. Positioning leans bullish, with a put to call ratio of 0.52 and the largest call concentrations at $85,000, $90,000 and $100,000, so the strikes above spot matter as much as max pain below it. Risk control stays the first priority. A shallow pullback into the liquidity below would leave the structure healthier than a straight run into resistance.
Trading involves risk.
Author



 Risk Disclaimer
The content provided here is for informational purposes only. It is not intended as personal investment advice and does not constitute a solicitation or invitation to engage in any financial transactions, investments, or related activities. Past performance is not a reliable indicator of future results.
The financial products offered by the Company are complex and come with a high risk of losing money rapidly due to leverage. These products may not be suitable for all investors. Before engaging, you should consider whether you understand how these leveraged products work and whether you can afford the high risk of losing your money.
The Company does not accept clients from the Restricted Jurisdictions as indicated in our website/ T&C. Some services or products may not be available in your jurisdiction.
The applicable legal entity and its respective products and services depend on the client’s country of residence and the entity with which the client has established a contractual relationship during registration.