5 min read
 US equities pushed to fresh record highs this week as hopes for a US-Iran de-escalation lifted risk sentiment, yet Bitcoin has not joined the move. Here’s the setup:
- Stocks at records, Bitcoin lagging. The S&P 500 and Nasdaq both closed at fresh record highs on Tuesday, led by technology, as traders weighed the prospects of a US-Iran deal. Bitcoin has not followed, trading back around $76,000 after recovering from a sub-$75,000 one-month low earlier in the week.
- Yields eased on peace hopes. Treasuries rallied as markets returned from the Memorial Day holiday, with the 10-year yield easing to around 4.5% and the 30-year near 5.0%. Falling yields would normally support risk assets, but the move has yet to translate into fresh crypto strength.
- Spot demand looks soft. Recent on-chain readings point to weakening spot demand and slowing ETF inflows, suggesting buyers have been slow to absorb available supply even as broader risk appetite has improved.
- The macro backdrop stays late-cycle. Headline inflation has drifted back up to around 3.8%, driven largely by energy and producer-side costs rather than broad consumer demand, while initial jobless claims remain low near 211k. Elevated yields and restrictive liquidity continue to favour a more defensive tone across markets, which could be part of why Bitcoin has struggled to track the equity rally.
Weekly chart
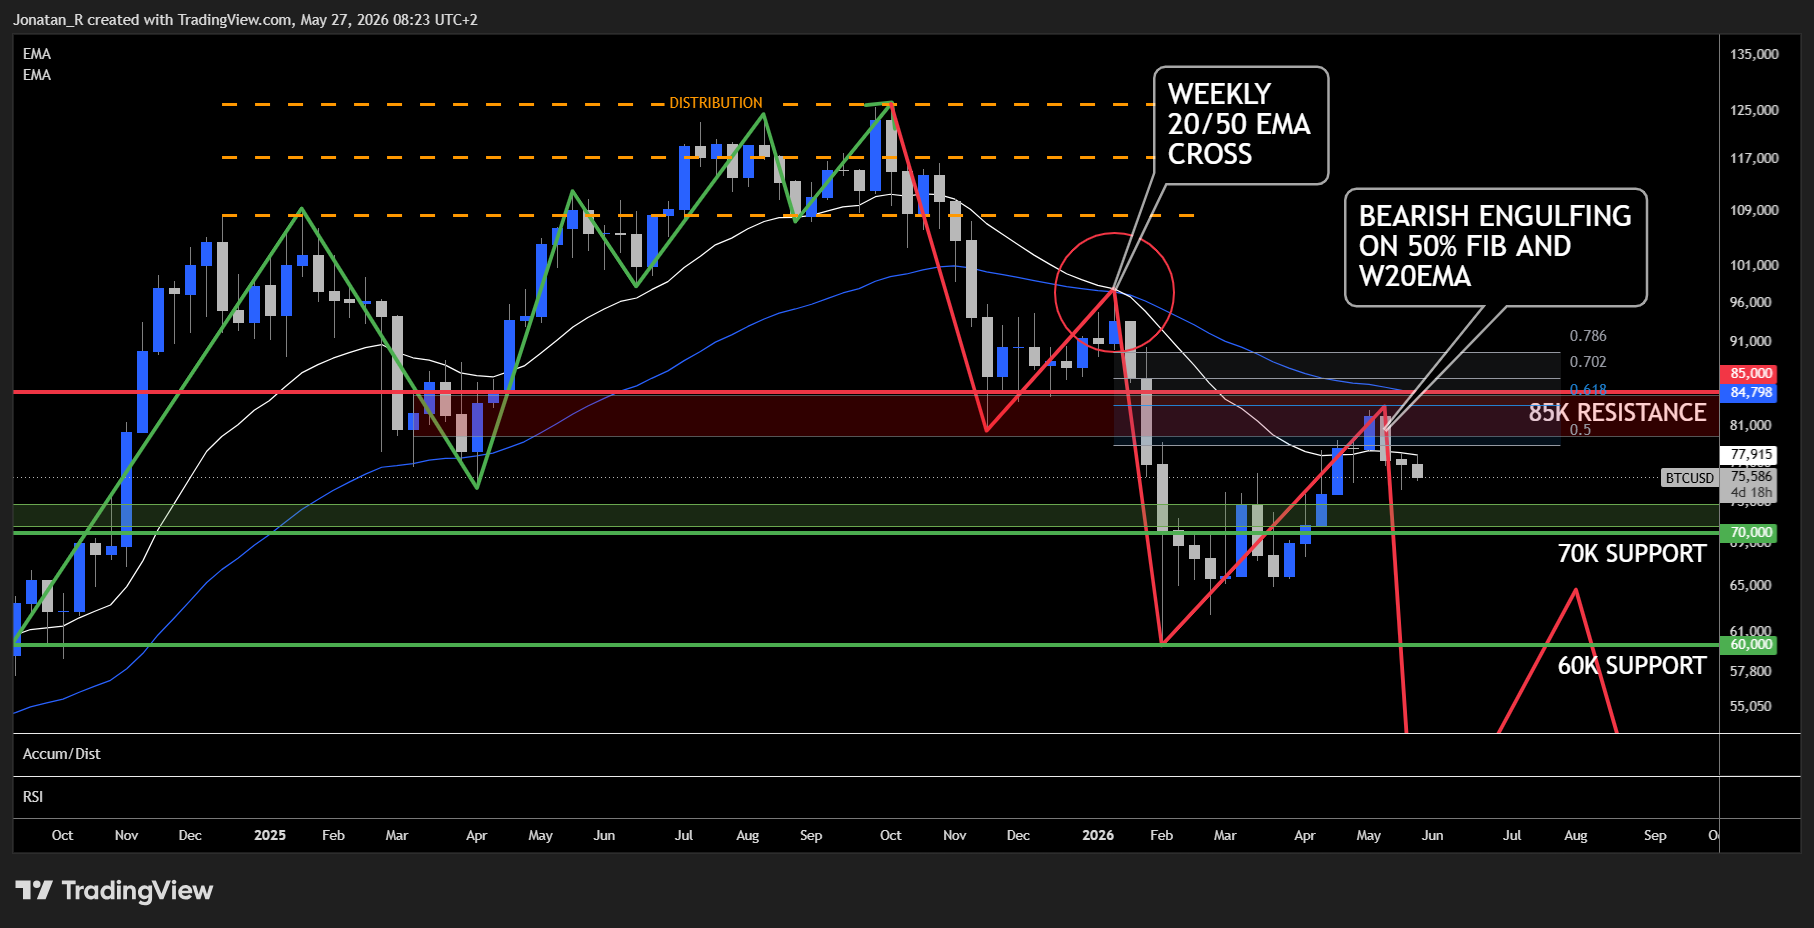
On the weekly timeframe, Bitcoin recently printed a bearish engulfing candle on a retest of the 80,000 to 85,000 resistance area, a zone that lines up with the 50% retracement and the weekly 20 EMA. That confluence makes it a notable area to watch.
Earlier this year, the weekly 20 EMA also crossed below the weekly 50 EMA. That type of cross has typically appeared only near the start of previous bear market phases for Bitcoin, so it has kept the broader structure in focus.
We’ve looked at the 80,000 to 85,000 region in previous analysis as the high timeframe resistance that would need to be reclaimed for the broader trend to shift back to the upside. For now, price appears to be rejecting that zone rather than reclaiming it. Below current levels, the next immediate area of interest sits between roughly 73,000 and 70,000.
Daily chart
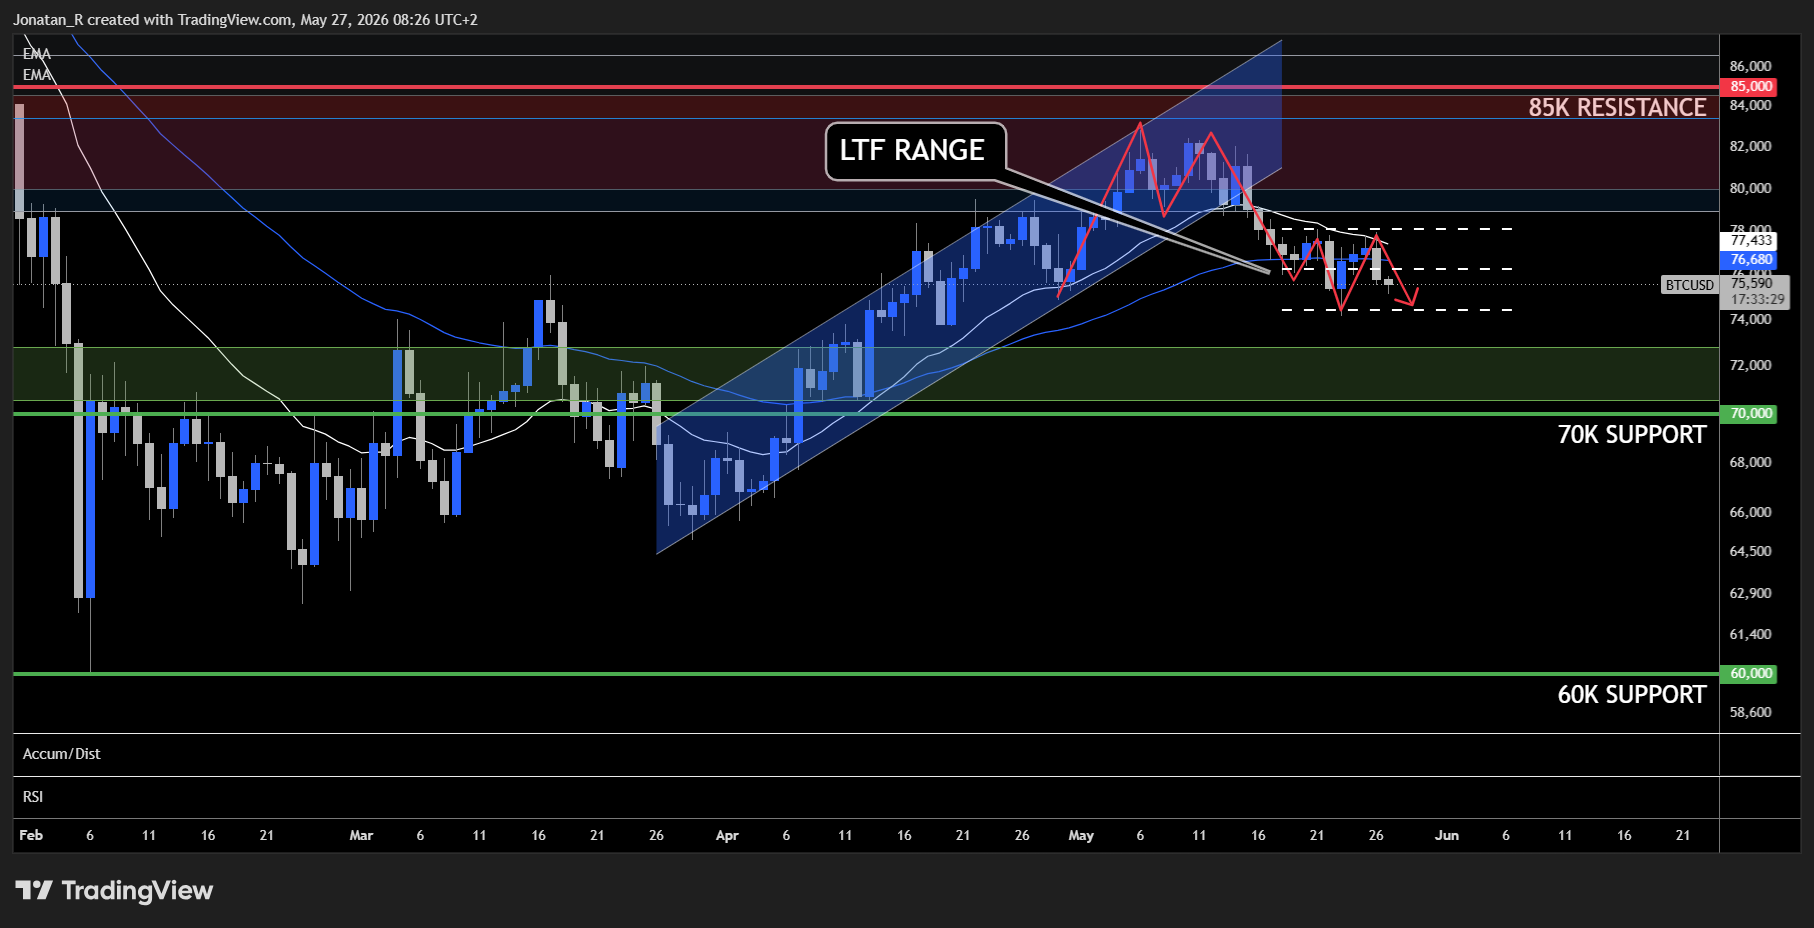
On the daily timeframe, the local uptrend structure that carried price into the 80,000 to 85,000 resistance has now broken. Bitcoin is back below the daily 20 and 50 EMAs and consolidating inside a low timeframe range in the mid-70,000s.
This sets up a clear inflection point. A break below the range lows could potentially open the move towards the high timeframe support area around 70,000 to 72,000. A break above the range could potentially resume the prior local uptrend and put the 80,000 to 85,000 region back in play. How price resolves this range could be an important tell for the higher timeframe trend.
Key levels to watch
Resistance:
- 80,000 to 85,000 — the high timeframe resistance zone, reinforced by the 50% retracement and the weekly 20 EMA
Support:
- 73,000 to 70,000 — the next immediate support area below current price
- 60,000 — the major horizontal support and structural floor further down
What to watch
- US-Iran developments, given the de-escalation narrative continues to drive broad risk sentiment
- Spot demand and ETF flows for any sign buyers are returning, or stepping further back
- Yields and the next inflation data for whether the late-cycle backdrop eases or tightens
- The low timeframe range boundaries, with a break either way pointing to the next high timeframe move
For our previous coverage of how this resistance zone was positioned, see our analysis on 14 May.
Trading involves risk.
Author



 Risk Disclaimer
The content provided here is for informational purposes only. It is not intended as personal investment advice and does not constitute a solicitation or invitation to engage in any financial transactions, investments, or related activities. Past performance is not a reliable indicator of future results.
The financial products offered by the Company are complex and come with a high risk of losing money rapidly due to leverage. These products may not be suitable for all investors. Before engaging, you should consider whether you understand how these leveraged products work and whether you can afford the high risk of losing your money.
The Company does not accept clients from the Restricted Jurisdictions as indicated in our website/ T&C. Some services or products may not be available in your jurisdiction.
The applicable legal entity and its respective products and services depend on the client’s country of residence and the entity with which the client has established a contractual relationship during registration.