4 min read
 July producer prices came in flat and jobless claims stayed contained, pushing expectations of a September rate hike further out and carrying the index to a record close above 7,800. July retail sales and the preliminary University of Michigan sentiment reading both land after publication, so the setup below is positioning ahead of them rather than a reaction to them.
The 4-hour chart
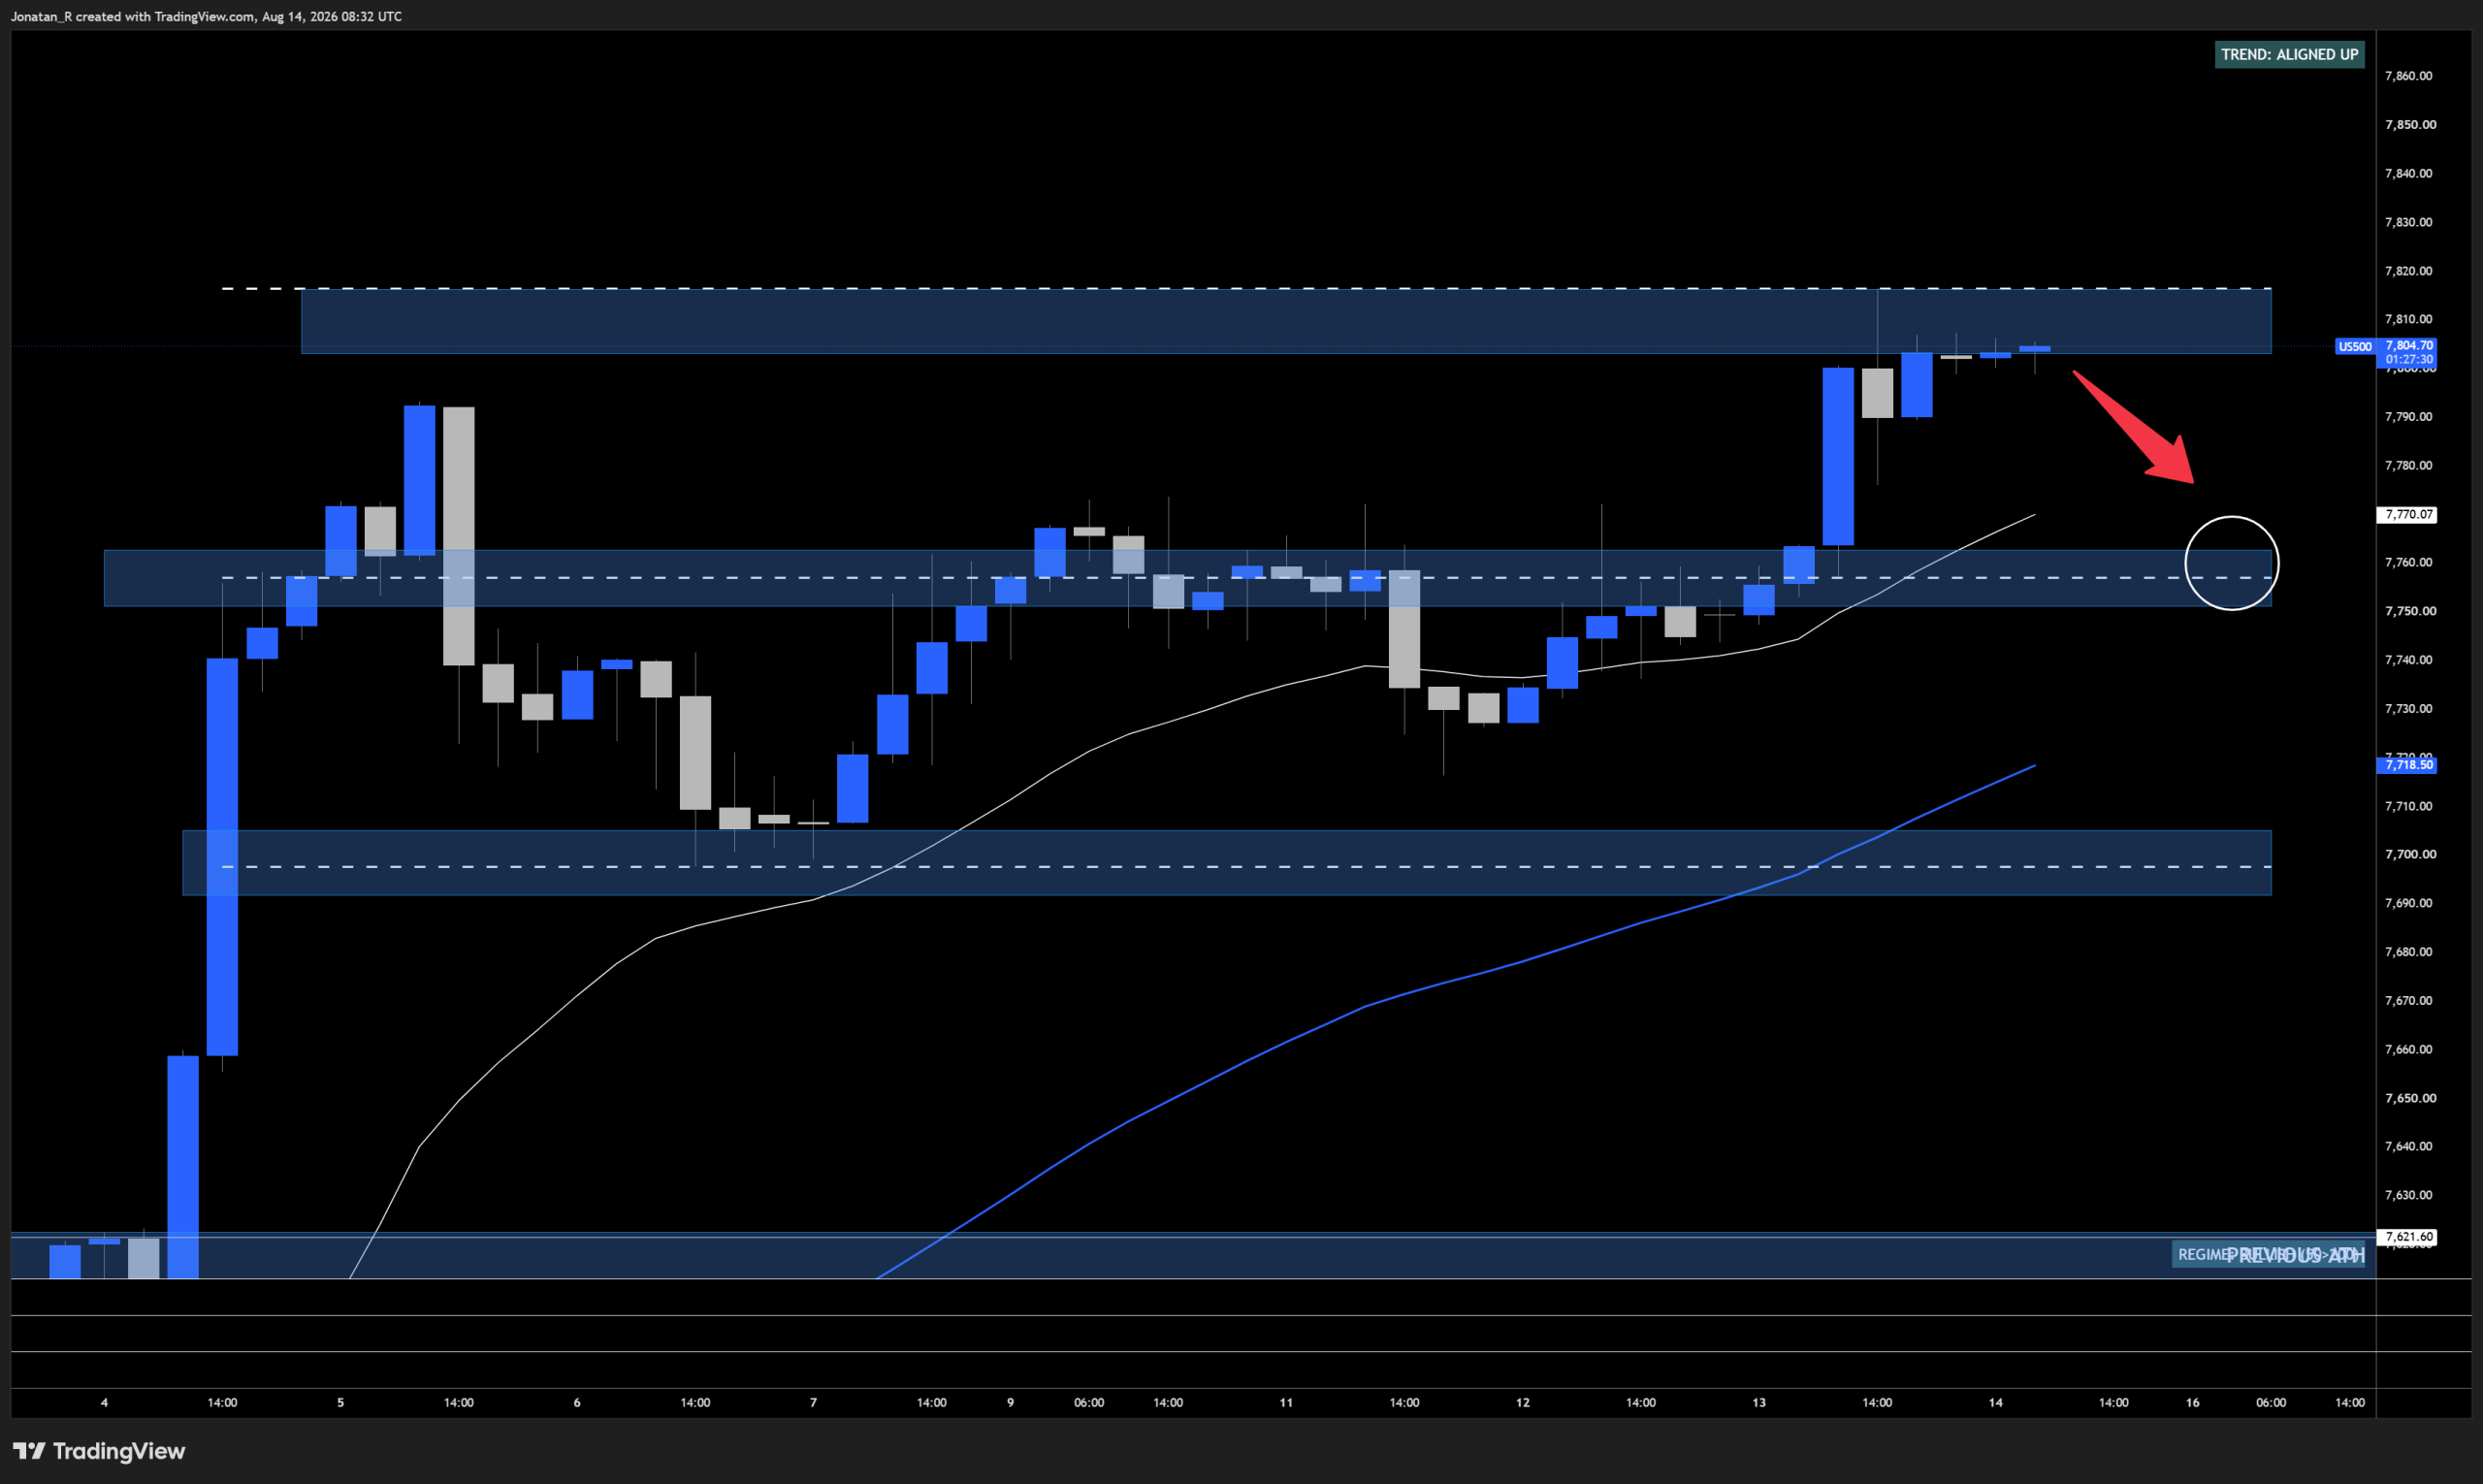
The 4-hour chart showing the S&P 500’s range, with the range lows, equilibrium and the all-time high resistance area at the range highs marked.
Since our previous coverage of the S&P 500, the index has worked its way back to the top of its range and is now pressing the highs. The range lows sit at around 7,700, the range equilibrium at around 7,760, and the range highs at around 7,810, which is also the all-time high resistance area.
Price is currently trading above the 4-hour 20 EMA, with the 20 sitting above the 50 EMA, so the shorter-term averages are stacked in the bulls’ favour. Adding to that, with the US appearing to shift from direct military operations in Iran towards a strategy of economic isolation, the market is holding this all-time high level quite nicely.
If we do get a pullback from current levels, the range equilibrium area at 7,760 looks like a solid zone for a potential retest.
The 15-minute chart
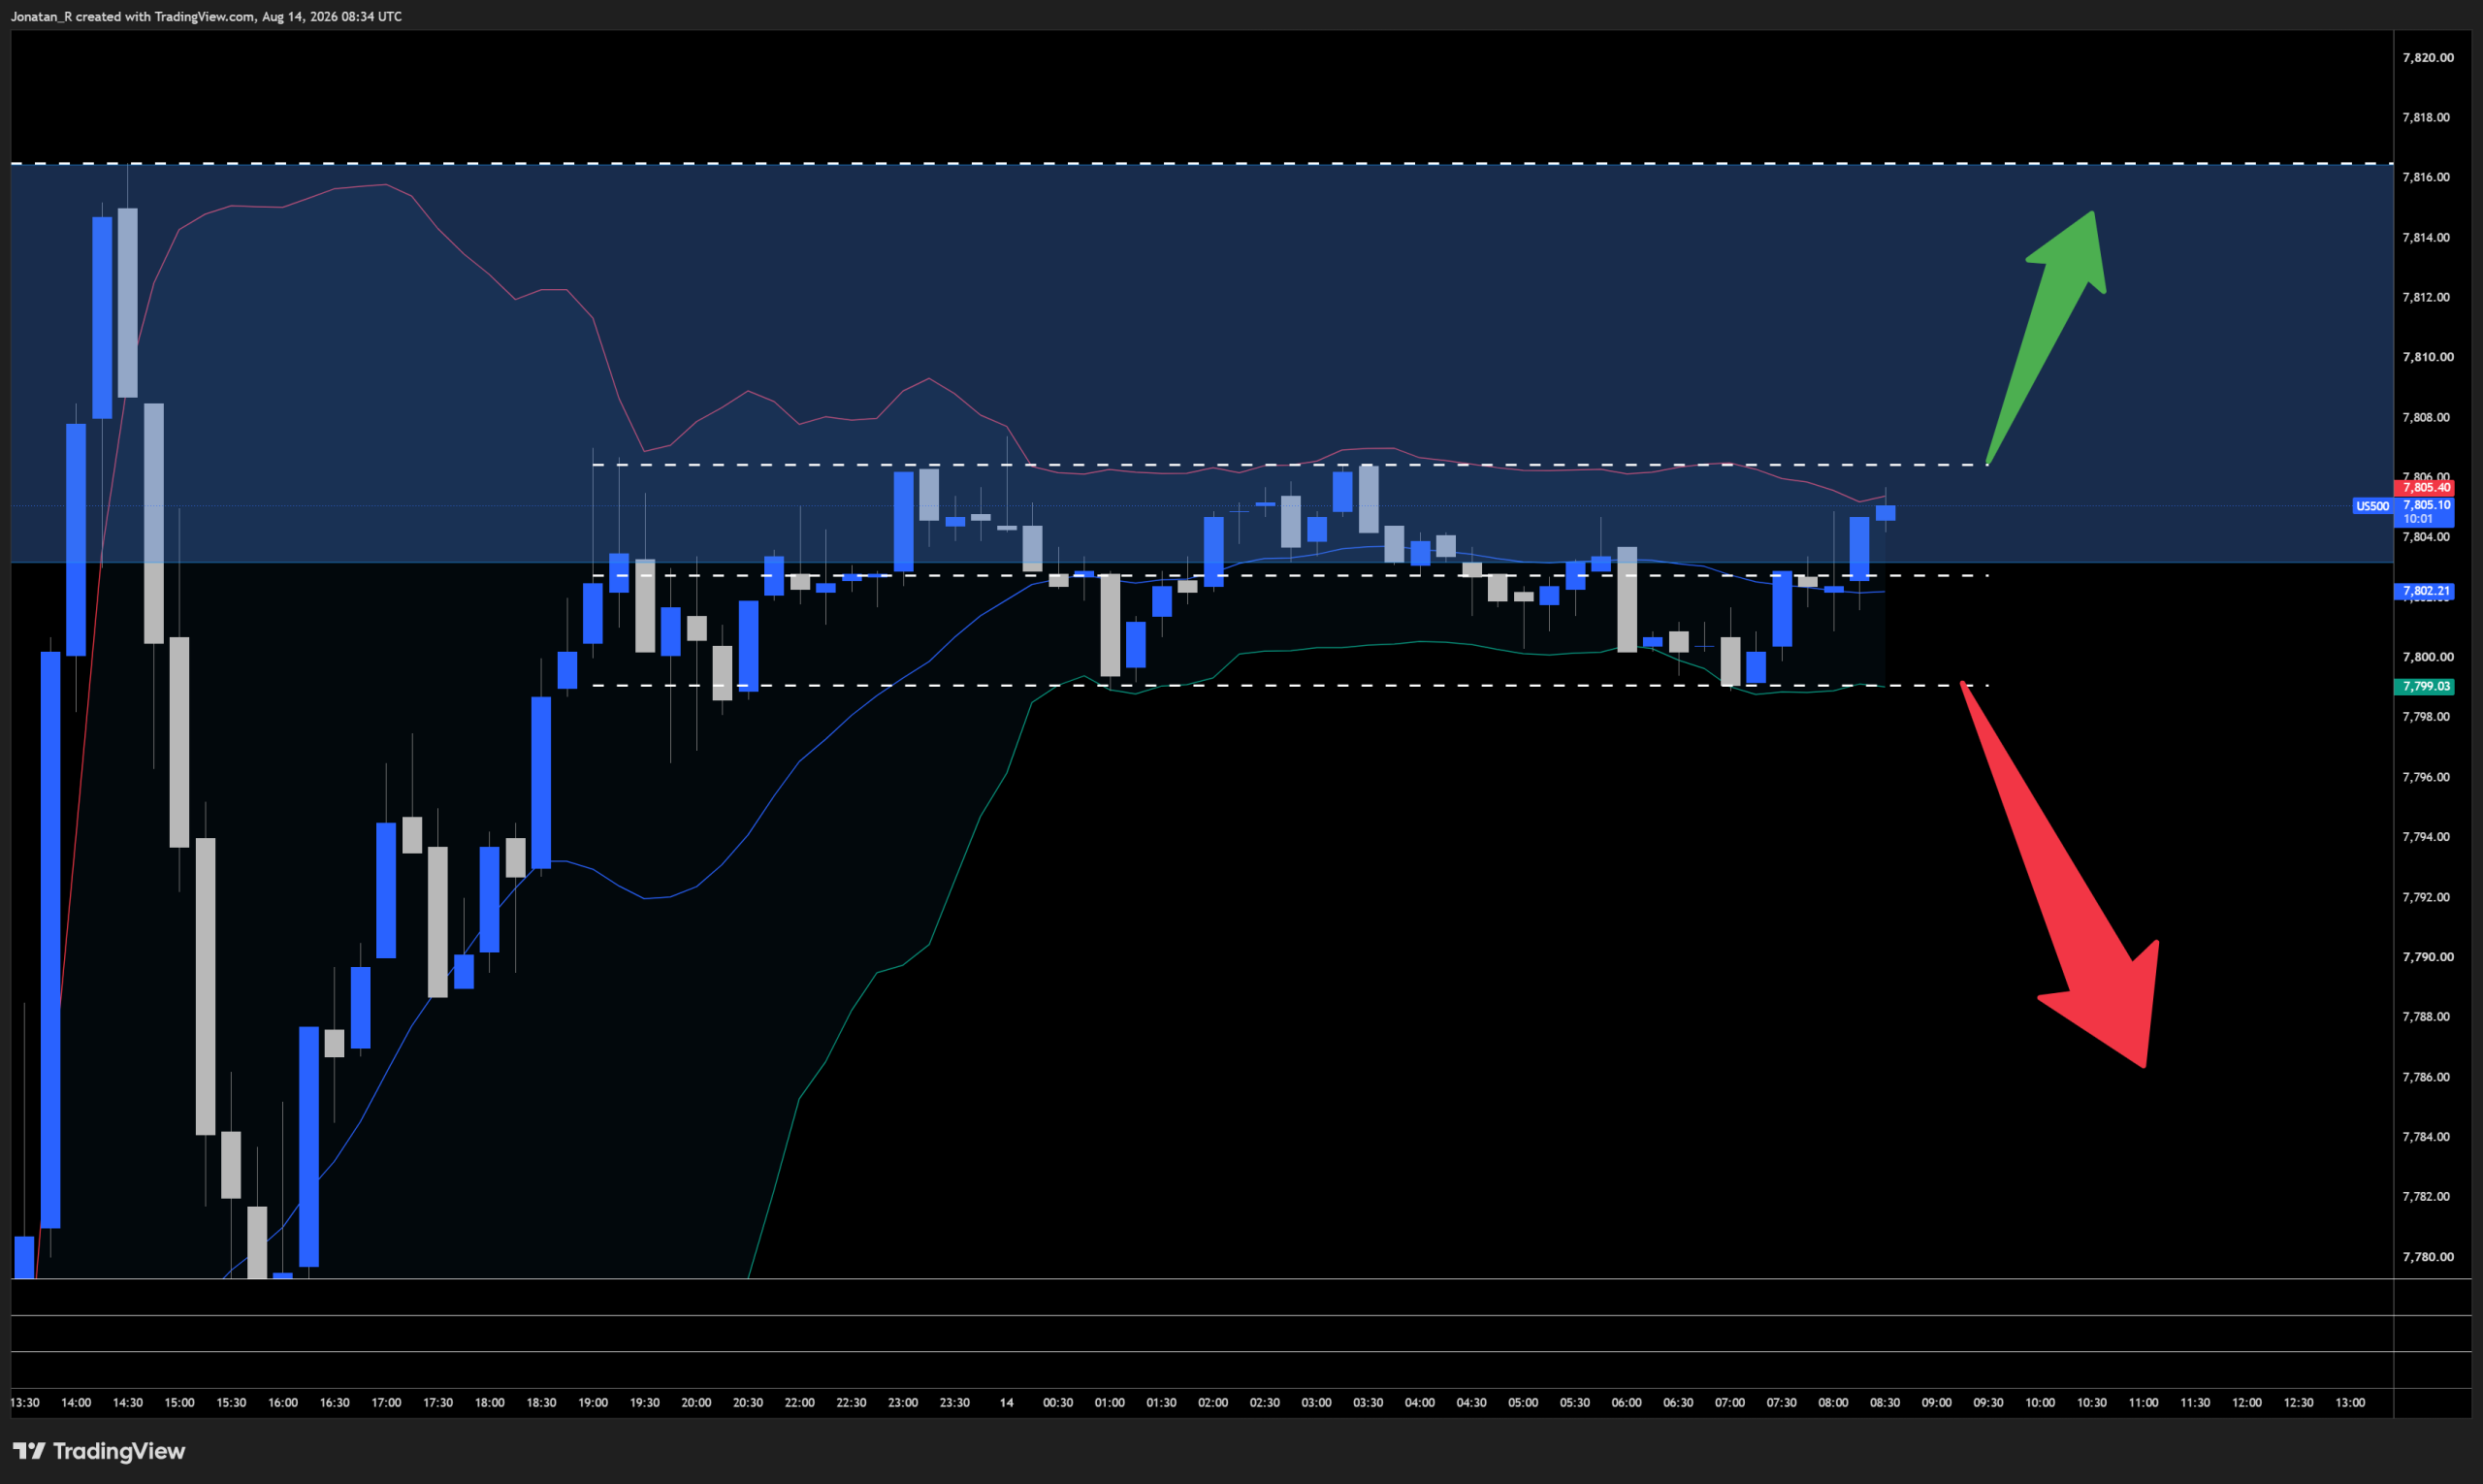
The 15-minute chart showing the compressed intraday range, with the range lows and range highs marked.
Zooming into the lower timeframe gives a clearer intraday picture, and what stands out is how compressed the range has become. Volatility has been very tight since around midnight.
The thing to remember about volatility is that it moves in cycles, and low volatility tends to resolve into high volatility. What we cannot know in advance is the direction in which it expands, only that an expansion is likely to come eventually.
The range lows here sit at 7,799 and the range highs at around 7,806. A break in either direction could be the volatility expansion we are waiting for, and intraday traders would most likely be looking at a breakout trade above or below this range rather than trying to position inside it.
Trade Now
Trading involves risk.
Author



 Risk Disclaimer
The content provided here is for informational purposes only. It is not intended as personal investment advice and does not constitute a solicitation or invitation to engage in any financial transactions, investments, or related activities. Past performance is not a reliable indicator of future results.
The financial products offered by the Company are complex and come with a high risk of losing money rapidly due to leverage. These products may not be suitable for all investors. Before engaging, you should consider whether you understand how these leveraged products work and whether you can afford the high risk of losing your money.
The Company does not accept clients from the Restricted Jurisdictions as indicated in our website/ T&C. Some services or products may not be available in your jurisdiction.
The applicable legal entity and its respective products and services depend on the client’s country of residence and the entity with which the client has established a contractual relationship during registration.