8 min read
Bitcoin Gives Back Its Rally to $84,900
Bitcoin opened the week at $82,116, rallied to $84,898 on Wednesday, October 21, and then gave the move back. It printed a low of $79,220 over the weekend and closed near $80,240, down about 2.3% on the week. The swing tracked flows into US spot ETFs. Funds took in about $1.08 billion from Monday to Wednesday, then lost $635.6 million on Thursday, the largest daily outflow since June 25, and another $137.9 million on Friday. The week still ended with a net inflow of about $301 million. Thursday’s exit coincided with a 2.6% drop in the Nasdaq on concerns about the cost of AI spending, while Brent pushed to its highest since late April.
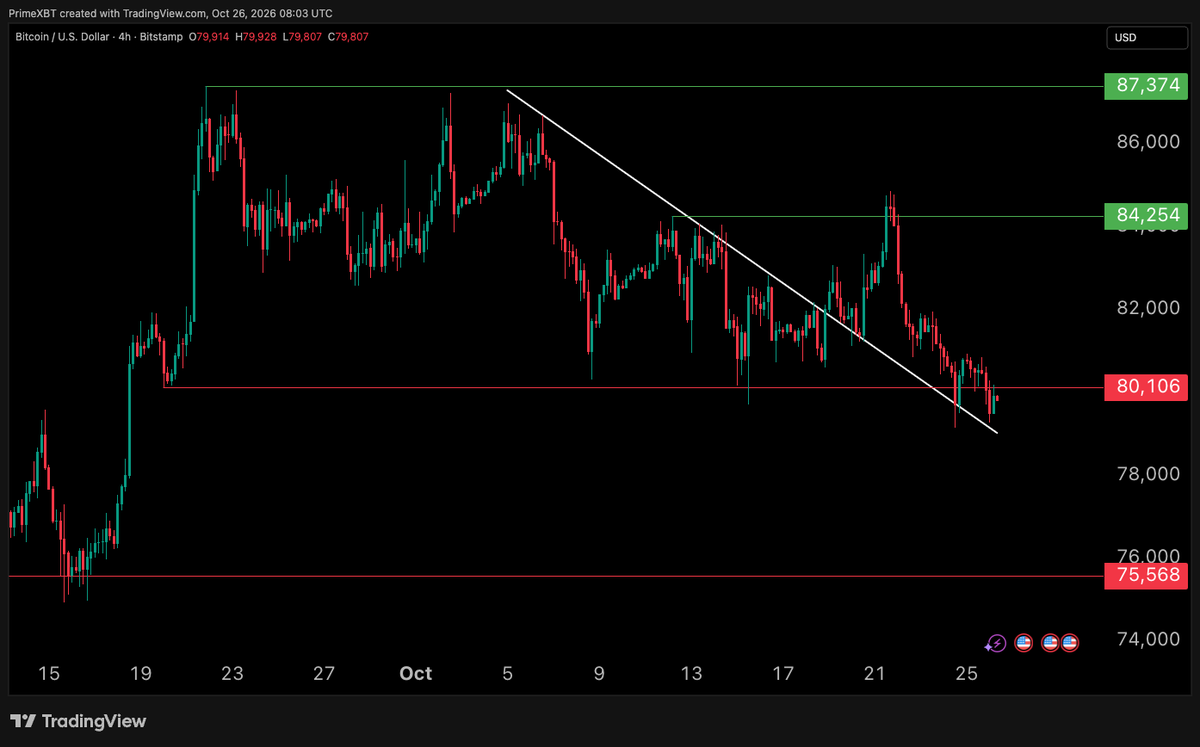
On the 4h chart, Bitcoin has made lower highs since the 87,374 top in early October. Wednesday’s spike briefly cleared 84,254 and reversed at once, which reads as a liquidity sweep above that level rather than a breakout. Price now trades near 79,800, just below support at 80,106, and is retesting the descending trendline from the October 5 high from above. If buyers defend the trendline and reclaim 80,106, the 84,254 area returns into view. A sustained break below the trendline would open the path toward 75,568, the mid-September low marked on the chart.
Crypto heatmap
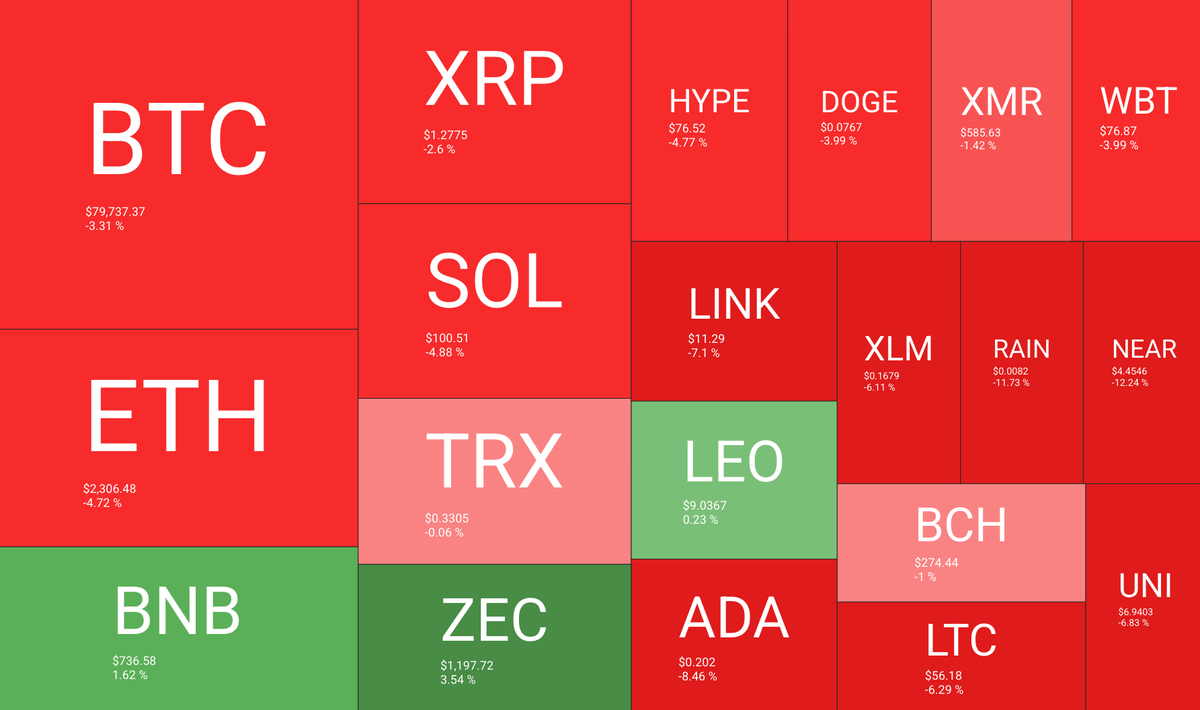
Large caps fell more than Bitcoin on the heatmap. BTC is down 3.31% at $79,737, while ETH lost 4.72% to $2,306, SOL 4.88% to $100.51 and HYPE 4.77%. XRP held up better at minus 2.6%.
Source: https://quantifycrypto.com/heatmaps
The deepest losses came from NEAR (minus 12.24%), RAIN (minus 11.73%), ADA (minus 8.46%) and LINK (minus 7.1%). NEAR, often traded as an AI-linked token, took the brunt of Thursday’s selloff in AI stocks. Only three names finished green: ZEC up 3.54% near $1,198, BNB up 1.62% and LEO up 0.23%. Zcash holds near $1,200 ahead of its NU7 network upgrade, targeted for around November 5, and amid filings for spot Zcash ETFs.
Altcoin Season Index eases to 58
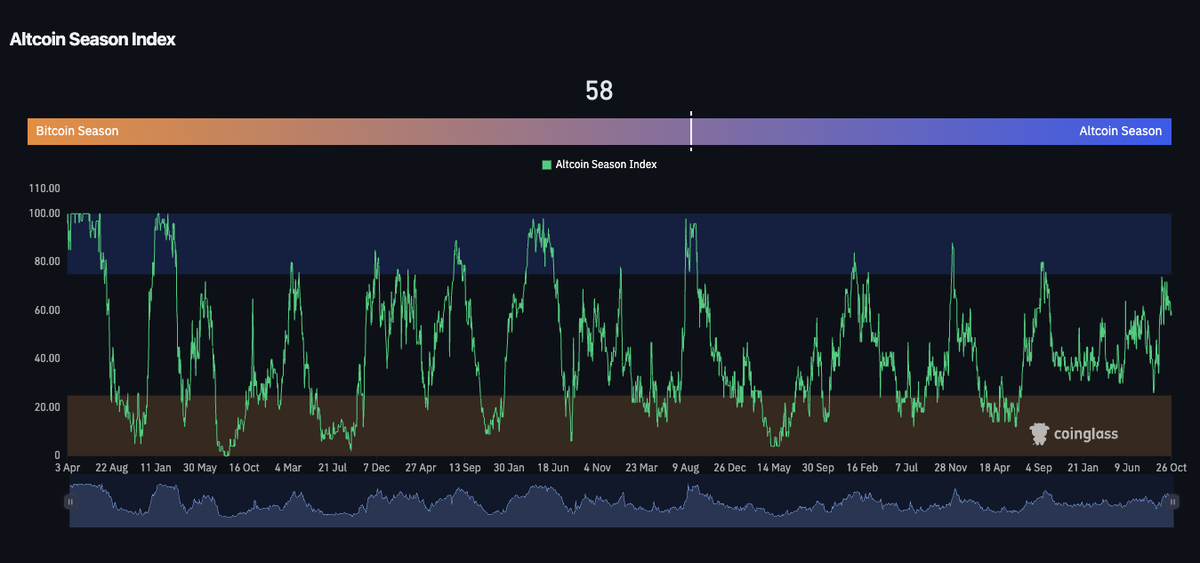
CoinGlass’s Altcoin Season Index stands at 58, down from 64 on October 20 and 66 on October 14. It remains well above the 26 reading of September 1, so altcoins still hold the edge they built in September, but the recent dip matches the heatmap, where most large caps lagged Bitcoin. The index sits in the neutral zone between the Bitcoin Season band below 25 and the Altcoin Season band above 75.
Source: https://www.coinglass.com/pro/i/alt-coin-season
Fear and Greed cools to Neutral
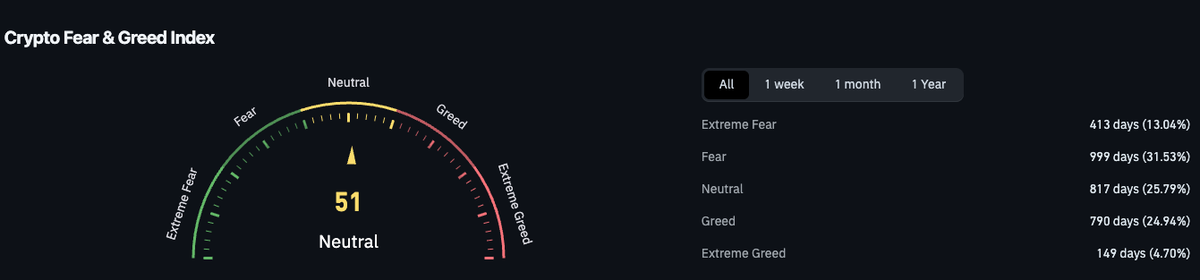
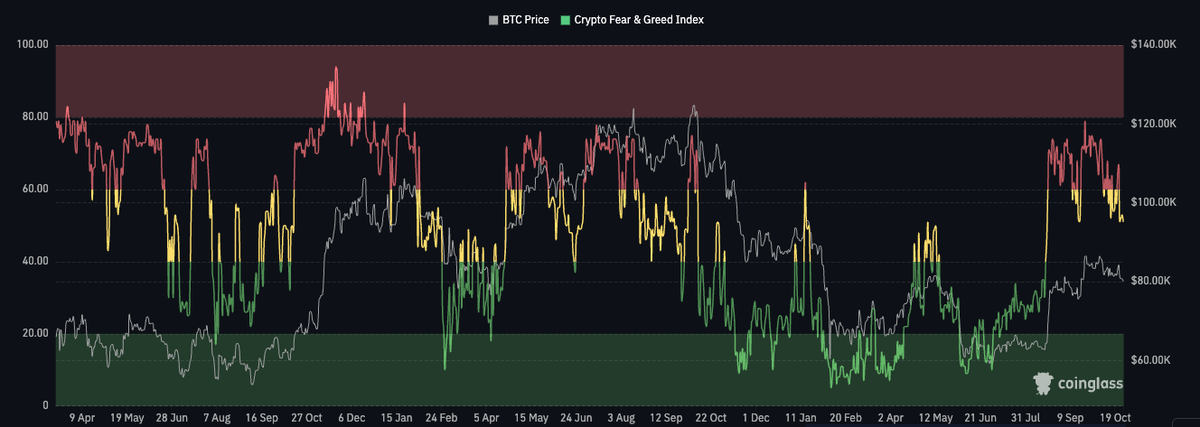
The CoinGlass Fear and Greed Index reads 51, Neutral. The history chart shows a brief return toward Greed during the October 21 rally, followed by a slide back to the bottom of the range the index has held since the August breakout.
Source: https://www.coinglass.com/pro/i/FearGreedIndex
Sentiment has cooled from the high 70s seen in mid-September, but it has not reached the washed-out levels of the summer. On the same chart, the July low below $58,000 came with the index deep in Fear. A move into Fear while price holds above 75,568 would point to capitulation without a structural breakdown, while a neutral reading alongside lower prices leaves room for further reset.
Bitcoin faces a tough macro backdrop as Brent holds above $100
CryptoQuant analyst Darkfost highlights a pattern: when Brent trades in a strong uptrend above its 365-day moving average, Bitcoin has often lost momentum. The grey zones on the chart mark those periods. In 2018 Bitcoin fell close to 80% while Brent held above its annual average, and in 2022 it dropped about 65% as oil topped $120. The chart marks Brent at 104.2, with its 365-day average turning higher after a climb from the $60 to $70 range earlier this year. Prices have moved further since: Brent settled at $116.72 on Friday, its highest since late April.
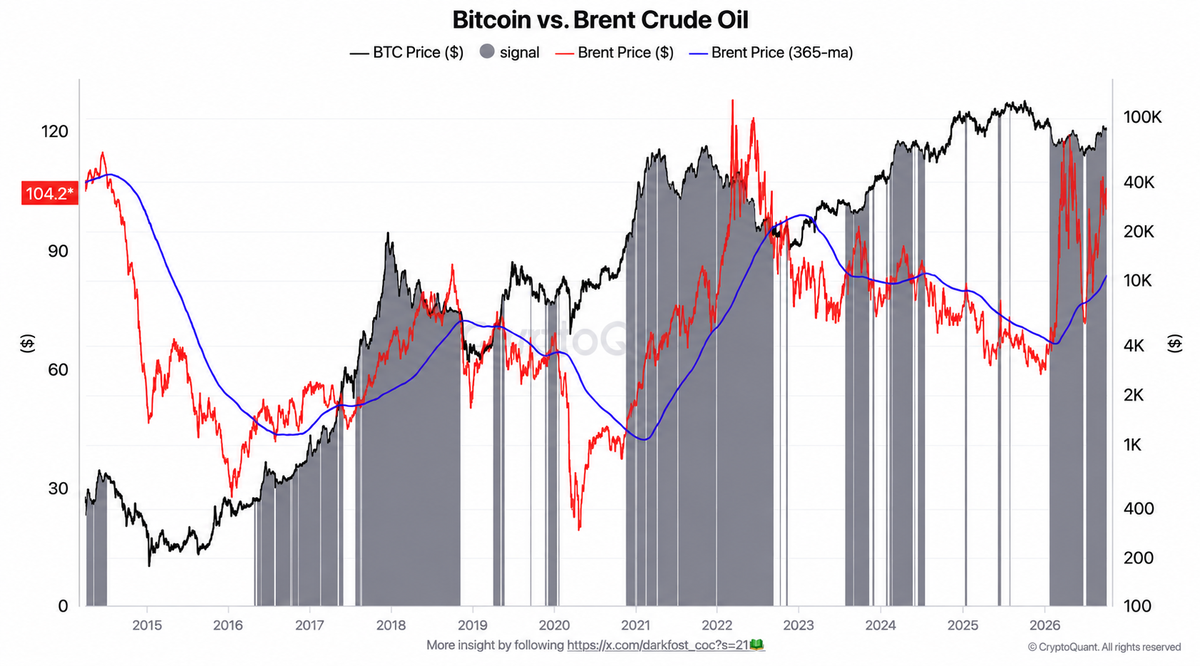
The link runs through inflation and rates rather than oil itself. US CPI rose to 3.7% in September, the Fed hiked in September, and futures price a further hike in December at 84% to 90%. The signal is a correlation, not a rule: the chart also shows grey phases in 2017 and early 2021 that coincided with strong Bitcoin rallies, and this year Bitcoin climbed from below $58,000 in July to about $87,000 while Brent stayed above trend. If Brent slips back below $100 and its annual average rolls over, this headwind would ease.
Bitcoin’s listed miners are walking away. The hashrate isn’t
Five listed miners, IREN, Core Scientific, Cipher, TeraWulf and Bitfarms, are turning their sites into AI and high-performance computing campuses. Four of them alone have signed more than $40 billion in multi-year leases with Microsoft, CoreWeave, Amazon Web Services and Fluidstack, and Bitfarms has shut its US mining. According to a CryptoQuant report from October 22, the five produced 7,075 BTC from January 1 to October 19, down 47% from 13,263 BTC in the same period of 2025.
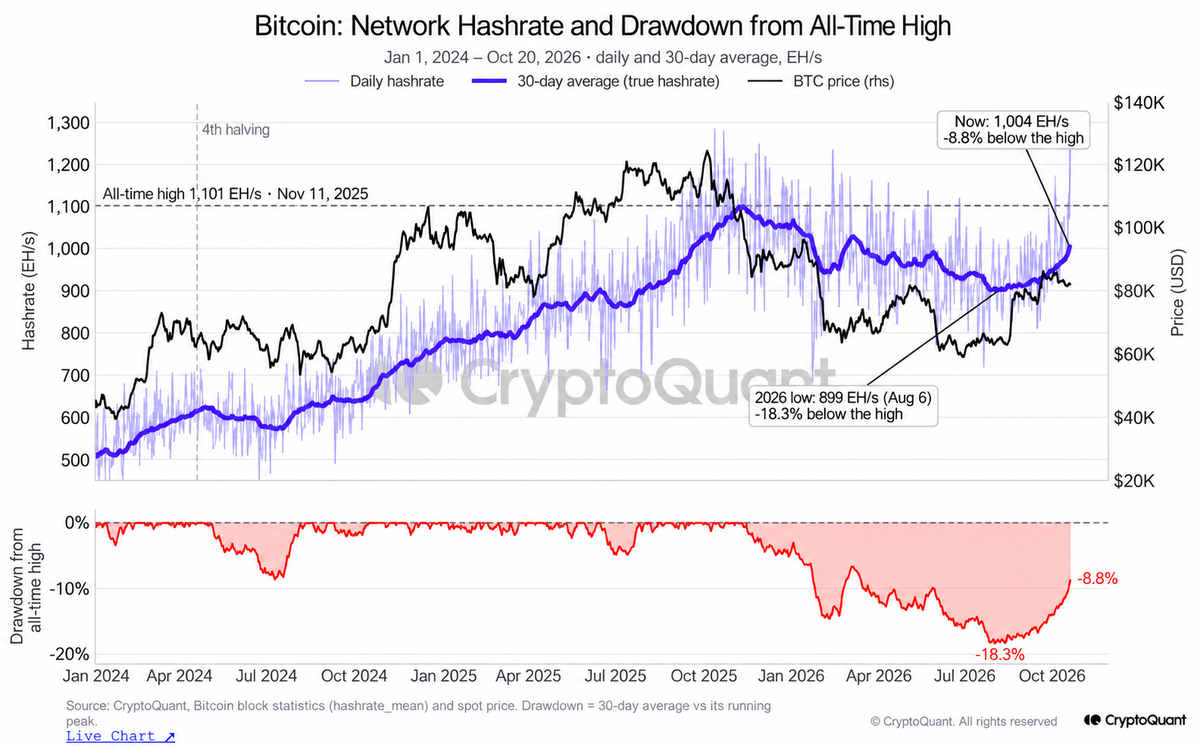
The network has not noticed. The 30-day average hashrate fell 18.3% from its all-time high of 1,101 EH/s on November 11, 2025, to 899 EH/s on August 6. It has since added about 105 EH/s to reach 1,004 EH/s, 8.8% below the peak. Private, sovereign and non-US operators are filling the gap, while Hive nearly doubled output and MARA, Riot, American Bitcoin and CleanSpark kept expanding. Rising hashrate with price near $80,000 squeezes margins for the remaining miners, which helps explain why AI leases look attractive.
Liquidation map: short leverage stacks above price
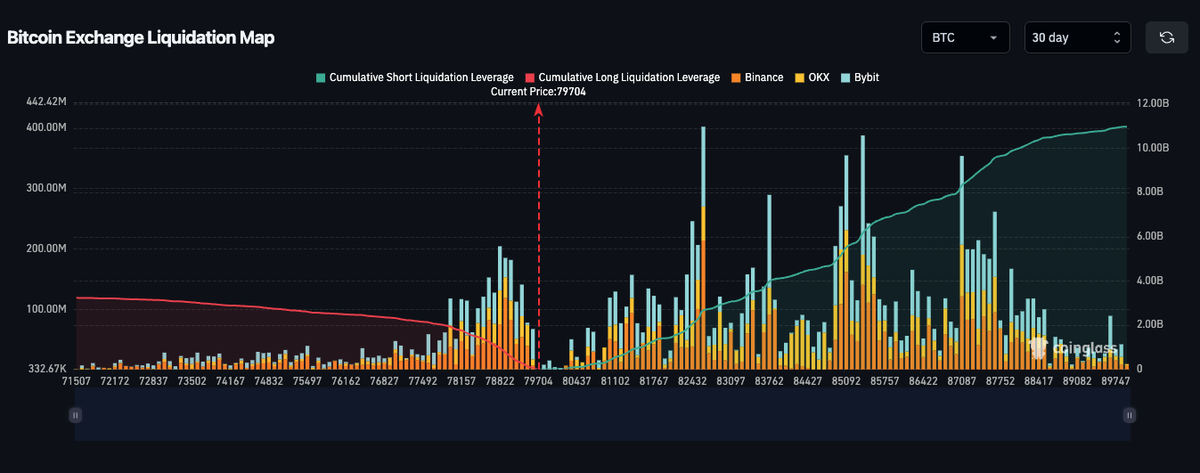
The CoinGlass 30-day liquidation map for Binance, OKX and Bybit shows a clear imbalance around the current price of 79,704. Cumulative short liquidation leverage builds to roughly $10.9 billion by 89,700, against roughly $3.2 billion of long leverage down to 71,500. The largest short clusters sit near 82,400, 85,000 to 85,300 and 87,100, each in the $350 million to $400 million range.
Source: https://www.coinglass.com/pro/futures/LiquidationMap
The downside is not empty, though. A pocket of long liquidations sits between 78,100 and 79,600, with bars of up to about $200 million, right under the price. If Bitcoin reclaims 80,106, the short clusters at 82,400 and above could fuel a squeeze. A break below 78,100 would clear the nearest long pocket and leave thinner support toward 75,568.
Conclusion
Bitcoin ended the week about 2.3% lower after a sharp rejection at $84,900, and it now sits on the trendline and the 80,106 support. ETF demand turned within the week, sentiment has cooled to Neutral without reaching Fear, and altcoins gave back part of their September lead. The macro backdrop stays heavy, with Brent above $100 and the Fed decision on Wednesday, October 28. Hashrate keeps rising even as listed miners turn to AI. The liquidation map leaves both paths open: a reclaim of 80,106 puts the short clusters above 82,400 within reach, while a break below 78,100 shifts focus to 75,568.
Trading involves risk.
Author



 Risk Disclaimer
The content provided here is for informational purposes only. It is not intended as personal investment advice and does not constitute a solicitation or invitation to engage in any financial transactions, investments, or related activities. Past performance is not a reliable indicator of future results.
The financial products offered by the Company are complex and come with a high risk of losing money rapidly due to leverage. These products may not be suitable for all investors. Before engaging, you should consider whether you understand how these leveraged products work and whether you can afford the high risk of losing your money.
The Company does not accept clients from the Restricted Jurisdictions as indicated in our website/ T&C. Some services or products may not be available in your jurisdiction.
The applicable legal entity and its respective products and services depend on the client’s country of residence and the entity with which the client has established a contractual relationship during registration.