4 min read
 Gold has spent weeks coiling above $4,000, and with today’s ADP payrolls report landing ahead of Friday’s non-farm payrolls, price is now pressing the top of that range.
Gold daily chart
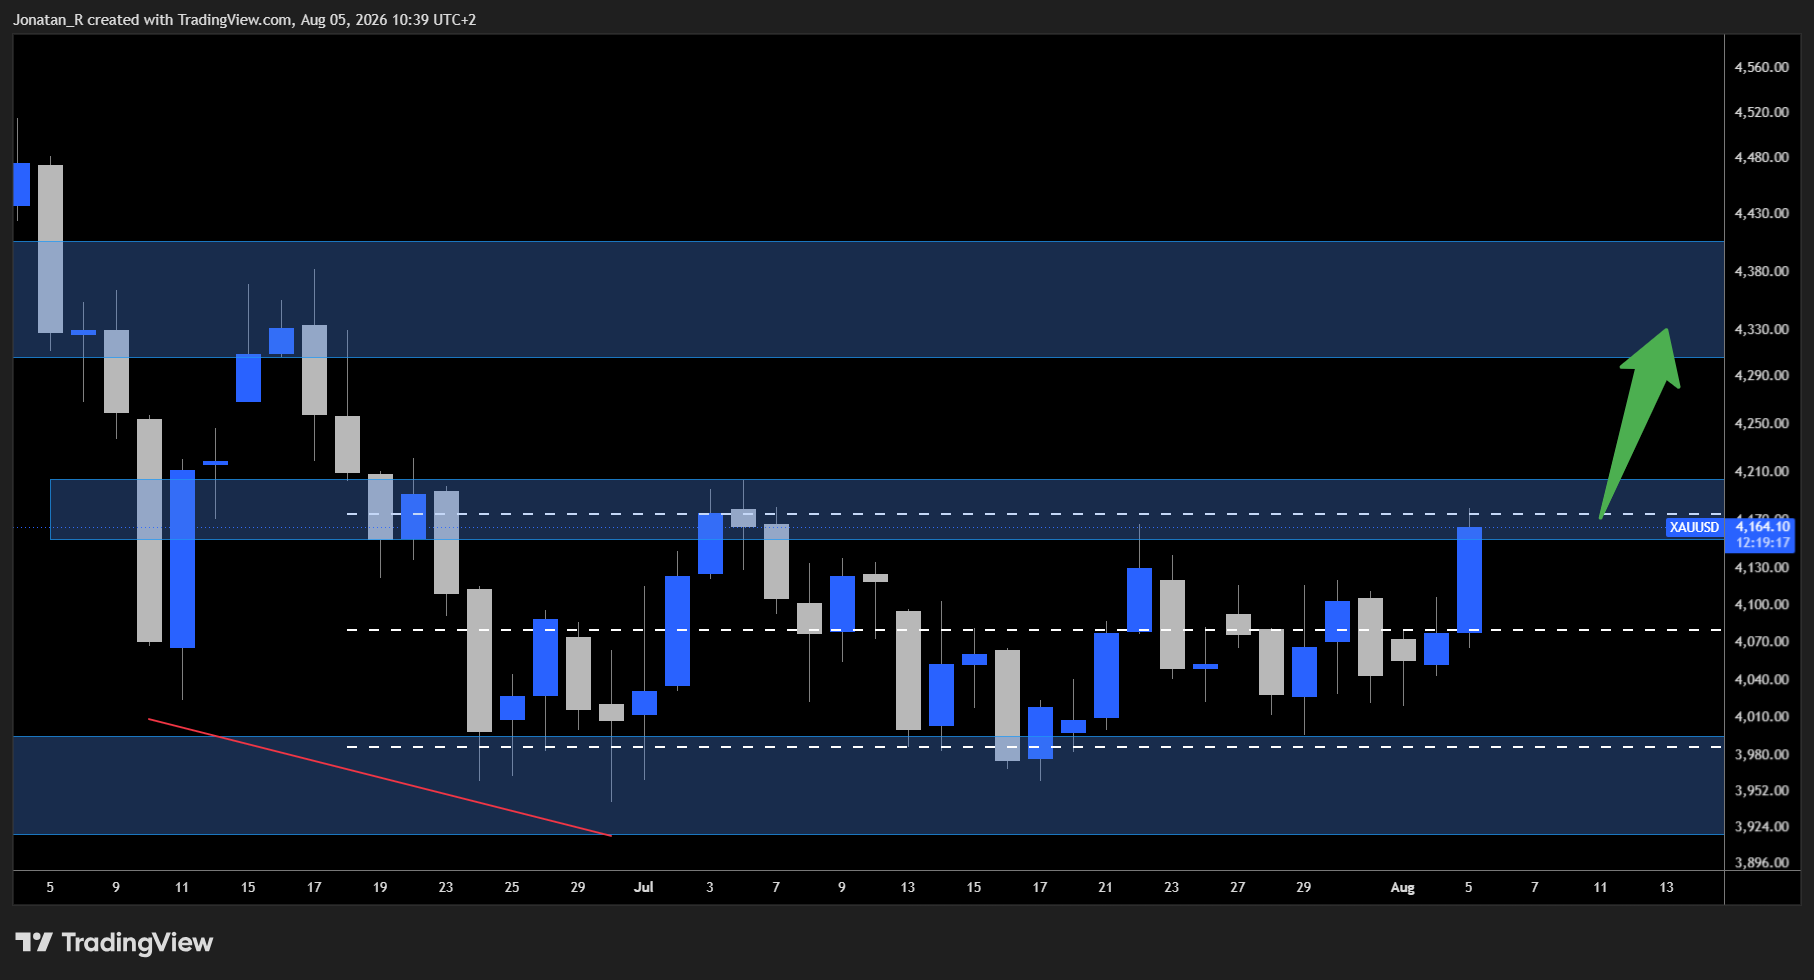
Gold’s daily chart showing price testing the upper boundary of its range.
As we noted in our previous coverage of gold, price has been working inside a well-defined range, and it is now testing the range highs.
Gold is currently trading within a range and testing the range highs. A break to the upside could give us a move to the next immediate resistance above at 4,300.
Gold 4H chart
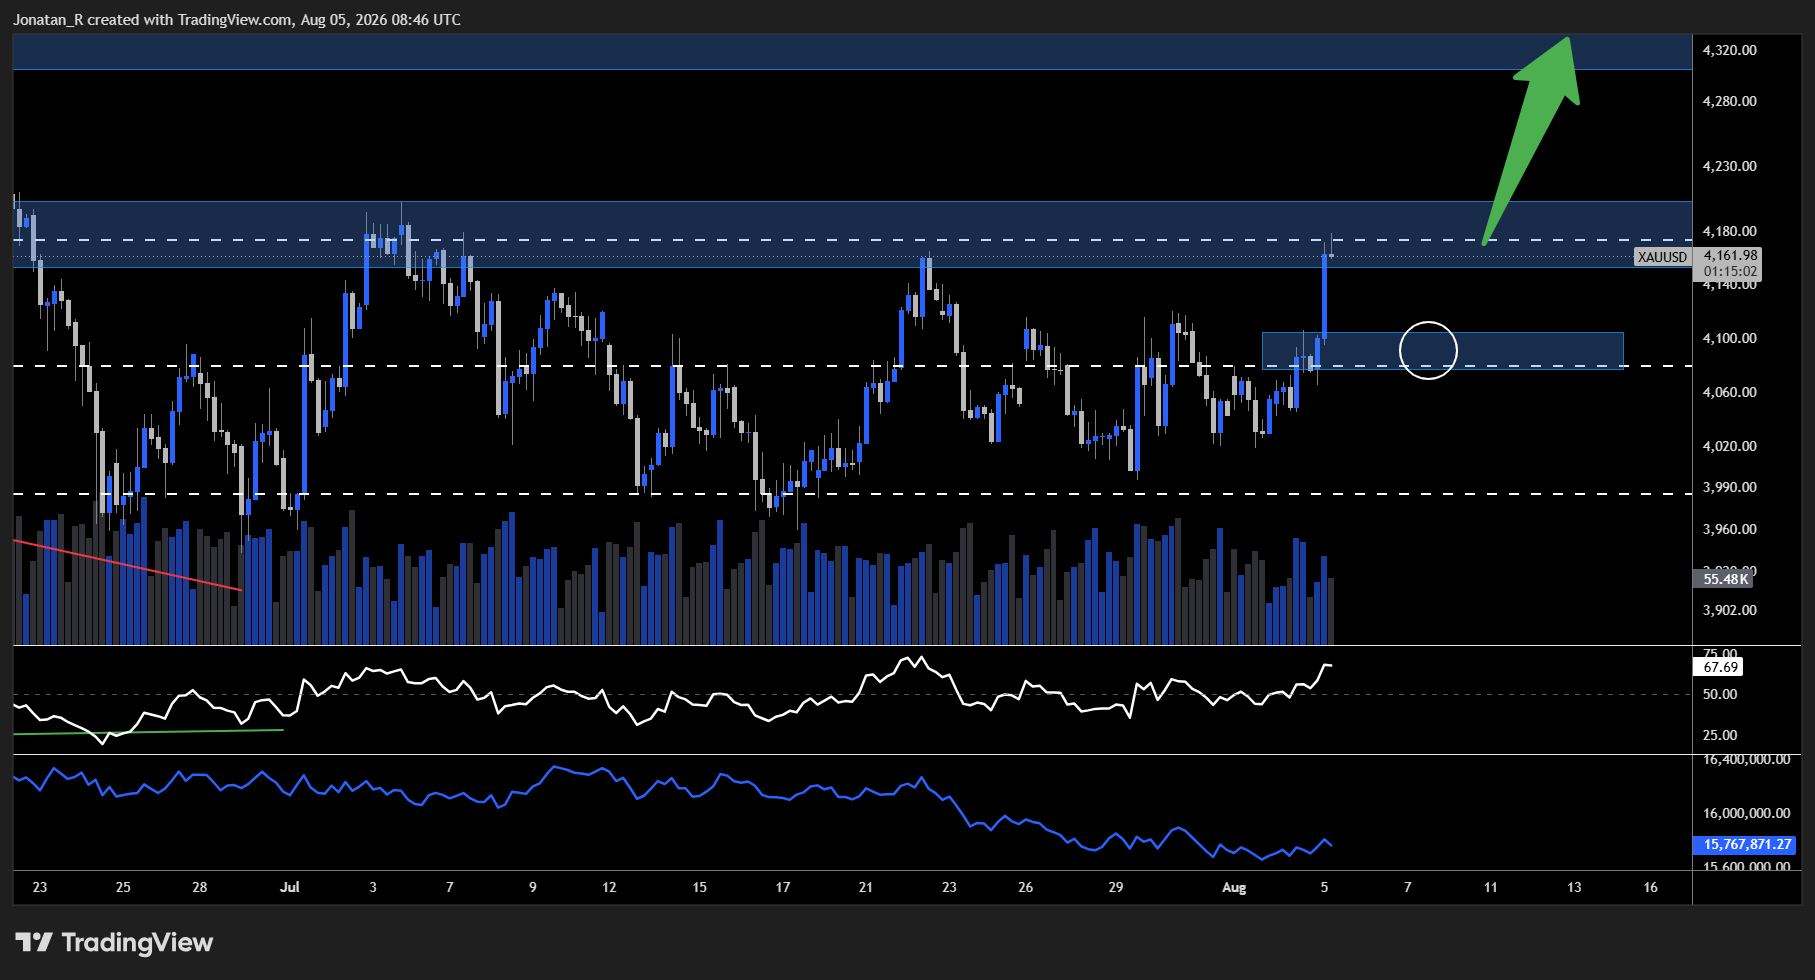
Gold’s 4-hour chart showing price at range resistance with the RSI elevated and volume declining through the move.
The RSI on the 4H is overbought after this strong move to the upside, and price is right within the range high resistance. Looking at volume, it’s declining throughout this move, but that is normal behaviour for gold during this time.
What would be interesting to see is whether we can get a volume spike around 14:00 UTC, when volume usually picks up. If we can get that at the same time as a breakout, that would add some confirmation to the breakout.
But if we get a bigger than average volume spike and a rejection here, the level below at 4,100 looks like a decent support area.
Gold 1H chart
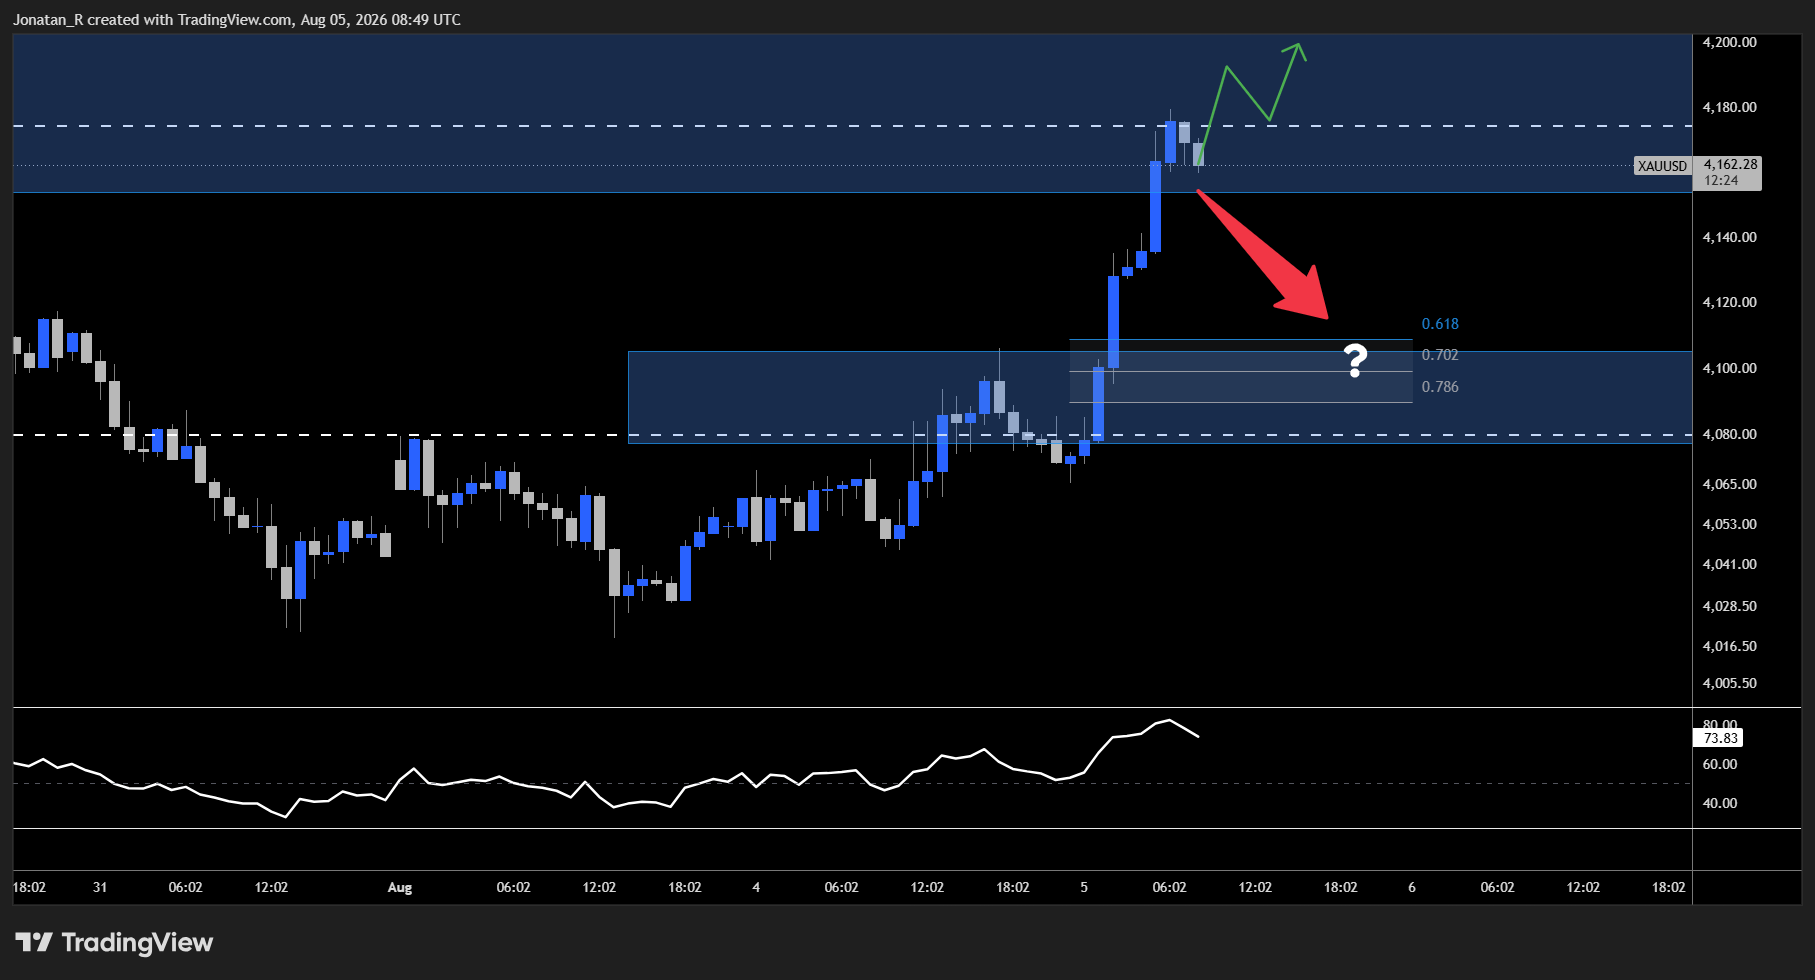
Gold’s 1-hour chart showing a potential rejection at resistance with the fib retracement zone marked below.
Looking at the 1H we do see a rejection at resistance starting to take shape, while the RSI sits in overbought territory. If this rejection materialises, the area below is confluent with the local long reload zone of the fibs, adding good confluence to that level as support.
However, if we see a continued push to the upside from here, it could potentially invalidate the move to the downside.
Trade Now
Trading involves risk.
Author



 Risk Disclaimer
The content provided here is for informational purposes only. It is not intended as personal investment advice and does not constitute a solicitation or invitation to engage in any financial transactions, investments, or related activities. Past performance is not a reliable indicator of future results.
The financial products offered by the Company are complex and come with a high risk of losing money rapidly due to leverage. These products may not be suitable for all investors. Before engaging, you should consider whether you understand how these leveraged products work and whether you can afford the high risk of losing your money.
The Company does not accept clients from the Restricted Jurisdictions as indicated in our website/ T&C. Some services or products may not be available in your jurisdiction.
The applicable legal entity and its respective products and services depend on the client’s country of residence and the entity with which the client has established a contractual relationship during registration.