5 min read
 The US Treasury said on Wednesday it will at least double the size of its long-dated bond buyback operations, an intervention aimed at stabilising a bond market that had pushed long-term borrowing costs to multi-decade highs. Yields fell sharply, the dollar weakened, and Bitcoin was the sharpest expression of the move, tearing through two levels that had capped it since June.
The daily chart
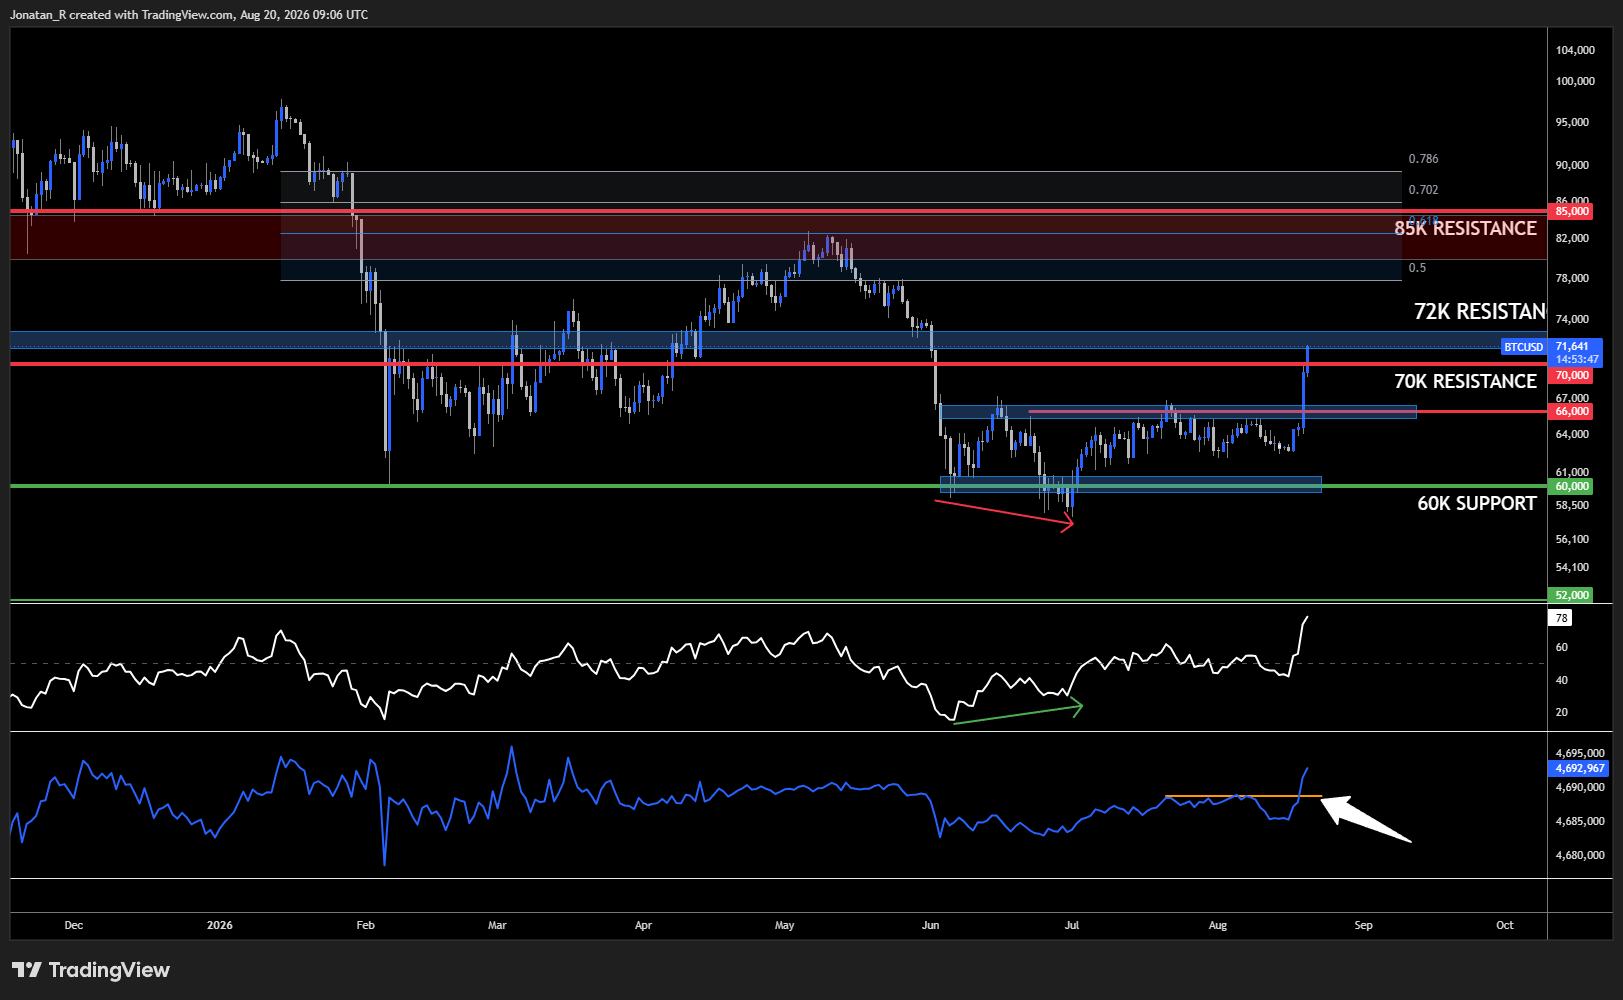
Bitcoin’s daily chart, showing the move through the 66K and 70K resistance levels into the 72K zone, with RSI and the accumulation/distribution indicator below.
Looking at the daily, it’s easy to see how impressive Wednesday’s move was, driven by the news of the US doubling its bond buybacks to stabilise the bond market. Adding to it, President Trump met crypto industry executives at the White House the same day and then publicly pressed Congress to advance the long-stalled market structure bill, which may well have played its own part in the move. Price went straight through the 66,000 resistance and then through 70,000, and at the time of writing Bitcoin is trading just above 71,600, right inside the 72,000 to 73,000 resistance zone. This is a very important level, because a reclaim of that zone would put Bitcoin back above the area where the massive capitulation move took place at the beginning of June. That makes the question of whether crypto is back in a bull market one we can now ask in a more serious way, with an actual possibility of it being the case. This is a make-it-or-break-it moment.
Two things on the indicators are worth adding. There was a clear bullish divergence on the daily RSI between June and July, with momentum building while price was still basing. Below that, the accumulation/distribution indicator has broken clearly above its own resistance, which tells us buyers are in firm control of this move.
The 1-hour chart
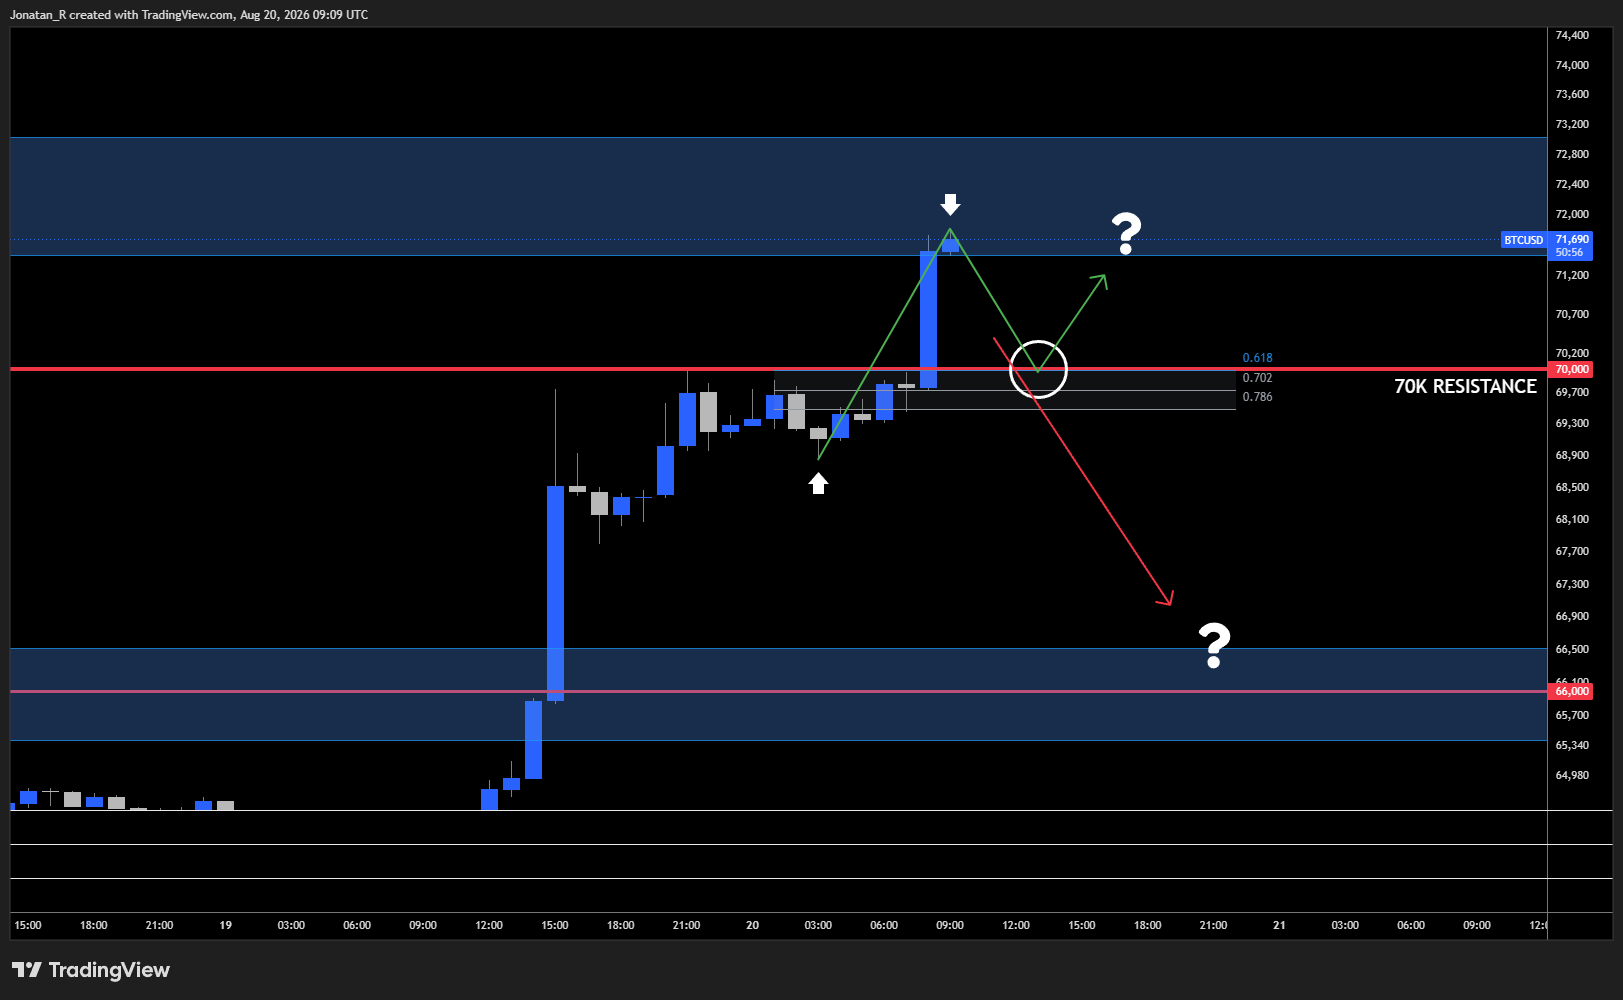
The 1-hour chart, showing the break above 70K into the higher timeframe resistance zone, with the Fibonacci retracement anchored to the recent low and high.
Zooming into the one-hour chart, price initially stalled at the 70,000 region and created a local resistance zone there. This morning, around the London open, we saw a break above 70,000 and a move straight up into the higher timeframe resistance zone at around 72,000.
If we add the Fibonacci retracement tool and anchor it to the points marked with the white arrows, the 0.618 sits perfectly on the 70,000 region. If we get a retracement from current levels, that is where buyers would want to be stepping in to defend. If this run is truly the beginning of a bigger trend, we want that level to hold. A failure to hold the 70,000 zone and we could potentially see a move back down to the 66,000 region.
Bitcoin is at a make-it-or-break-it moment, and there is an exciting day ahead with plenty of potential opportunities in the market.
Trading involves risk.
Author



 Risk Disclaimer
The content provided here is for informational purposes only. It is not intended as personal investment advice and does not constitute a solicitation or invitation to engage in any financial transactions, investments, or related activities. Past performance is not a reliable indicator of future results.
The financial products offered by the Company are complex and come with a high risk of losing money rapidly due to leverage. These products may not be suitable for all investors. Before engaging, you should consider whether you understand how these leveraged products work and whether you can afford the high risk of losing your money.
The Company does not accept clients from the Restricted Jurisdictions as indicated in our website/ T&C. Some services or products may not be available in your jurisdiction.
The applicable legal entity and its respective products and services depend on the client’s country of residence and the entity with which the client has established a contractual relationship during registration.