
 7 min read
 USD/JPY has just been through one of the most dramatic weeks in its recent history, and it took two separate operations to get there. Japanese authorities moved first on Thursday 30 July, acting alone and without confirmation at the time, in what central bank accounts suggest was the largest single-day yen-buying operation on record. They went again the following day, this time alongside the US Treasury. Japan’s finance ministry confirmed both on Monday, describing the action as a response to excessive volatility and disorderly movements in the yen. Across three sessions the currency strengthened by as much as 5% from a 40-year low.
The joint element is what makes this different from every intervention of the past two decades. It was the first time Washington and Tokyo have bought yen together since 1998, and the first coordinated intervention involving the two countries since the G7 acted to weaken the yen after the 2011 earthquake. The US Treasury secretary said afterwards that Washington won’t hesitate to take part again, and that the US strongly supports Japan’s efforts to correct what he called the substantial undervaluation of the yen. Notably, the Treasury sold euros rather than dollars to fund its yen buying, and has since pushed for the Federal Reserve’s dollar lending facility for foreign central banks to be expanded. That would let Japan raise dollars against its US government bond holdings instead of selling them. Japan holds more US debt than any other country, so a solo defence of the yen risks pushing US yields higher at precisely the wrong moment. Any change to that facility needs approval from the Fed’s rate-setting committee, which doesn’t meet again until mid-September.
The problem the intervention was designed to contain resurfaced this morning. The yen weakened for the first time in five sessions, and an auction of 10-year Japanese government bonds drew weaker demand than the previous sale, sending yields higher again. That tension runs underneath the entire move. Japan imports more than 87% of its energy, so a soft yen and expensive crude compound each other, yet core inflation was only 1.6% in June, below the 2% target for a fifth consecutive month. The Bank of Japan held its policy rate at 1.00% on Friday while warning that underlying inflation is likely to exceed target. Friday’s US employment report is the next scheduled test, with June’s 57,000 payroll gain the weakest in four months.
The daily chart has produced equal lows, but not yet a structure break
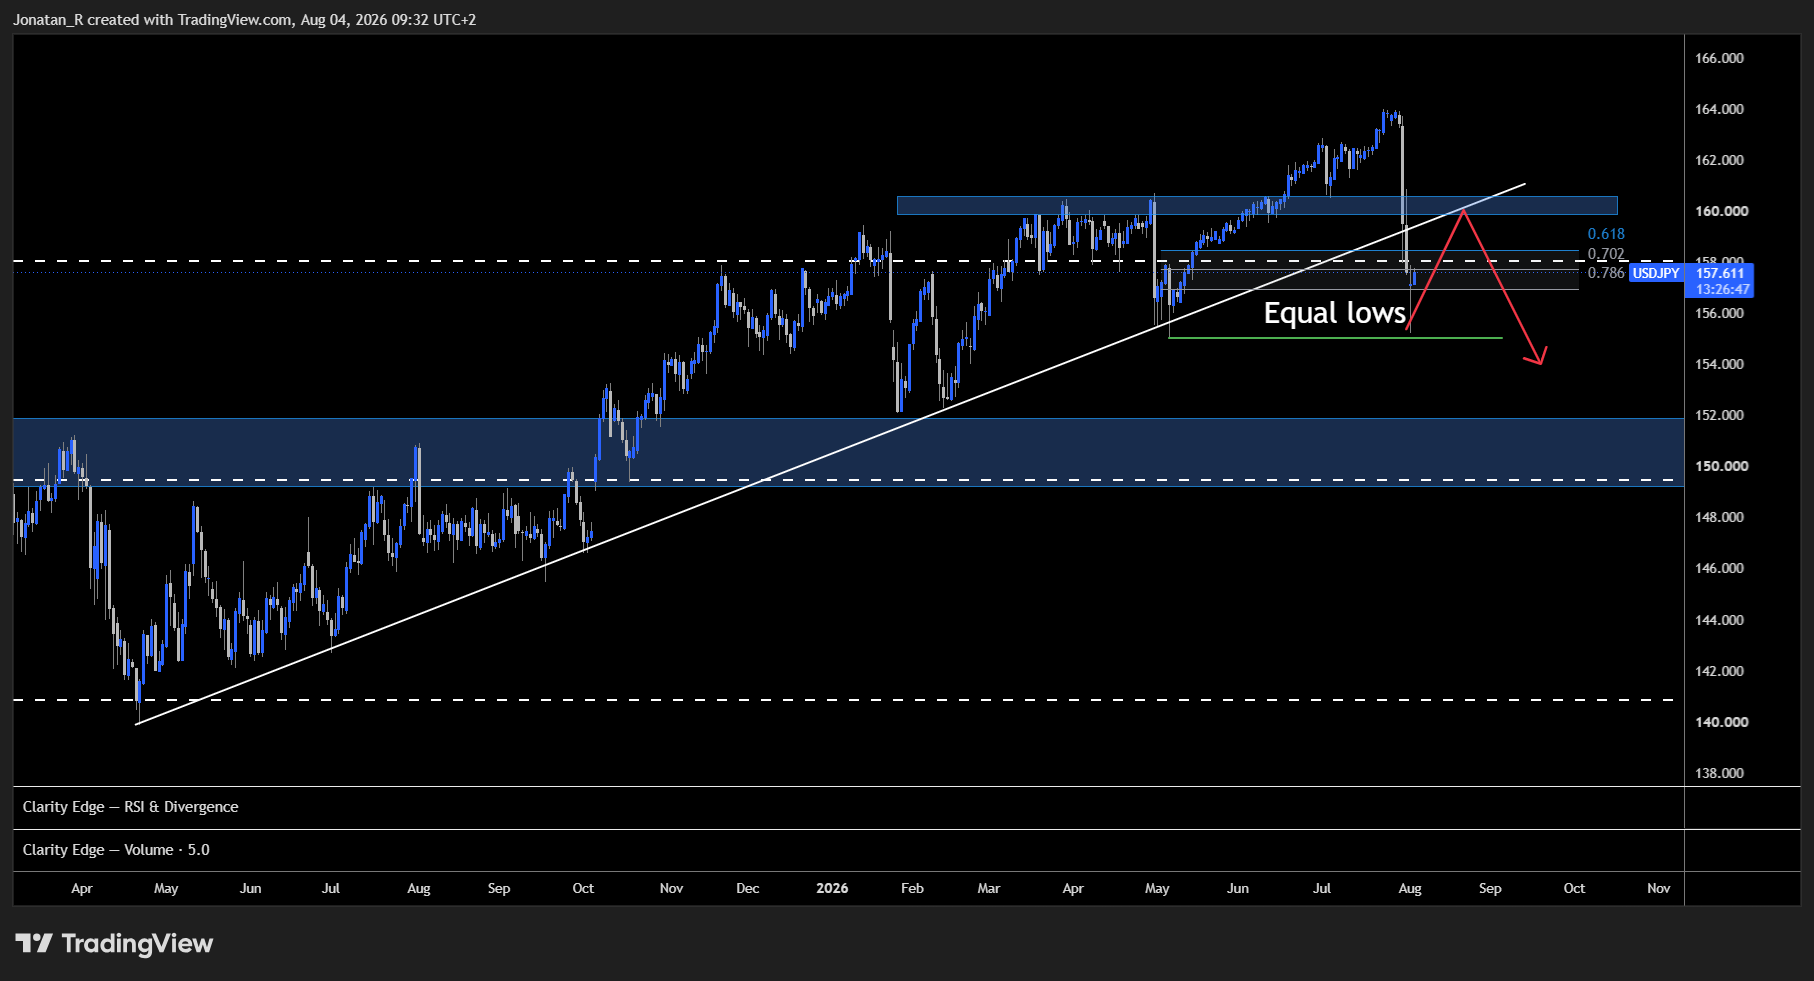
The USD/JPY daily chart shows the pair sitting inside a reload zone after a sharp three-day decline, with equal lows marked below and a long-term ascending trendline overhead.
As we noted in our previous coverage of USD/JPY, the pair had been trading around the range highs before this move began. What followed was a massive move from around the 164 level, and in only three days’ worth of price action it went all the way down to around 155. We’re currently hovering around 157, right inside the local long reload zone.
If we look at the white ascending trendline, one could argue that the trend has broken, but only from a trendline perspective and not from a structural perspective. What we see here is that this current move came down and hit the lows, creating an equal low area, which of course is a sign that there’s a change in behaviour in the trend.
For this to be a sustained move, we’d need to see another low. That could mean price coming back up, hitting the trendline again at 160, and then breaking back below 155 once again. If we get something like that, then we could look at this as a proper structure break, and as evidence that the intervention from the Ministry of Finance, now with the US joining as well, is actually playing out and working accordingly.
However, if we start climbing higher and reclaim that 160 level, it would mean that bulls are back in control. Japanese authorities and their US counterparts would then need to set up a new strategy to tackle the yen weakness.
The 1H chart puts one zone in charge of the next move
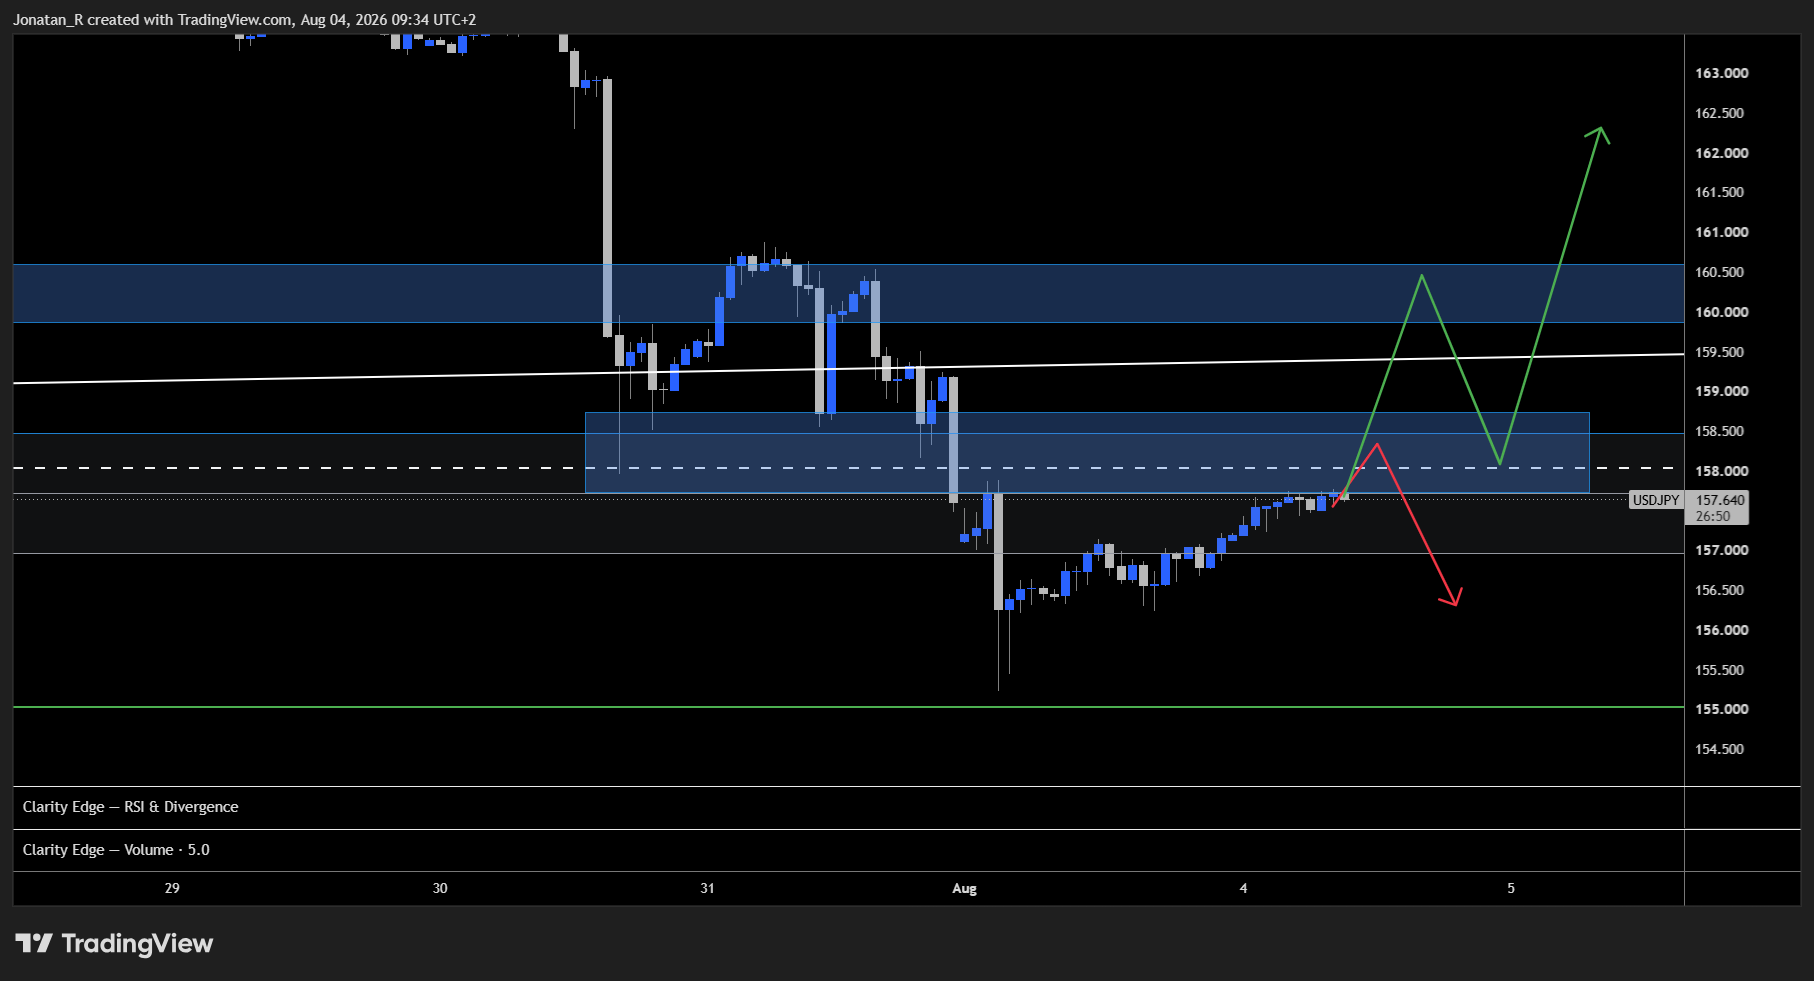
The USD/JPY 1-hour chart shows price recovering off the lows and approaching a marked zone just above, with the intervention low sitting well below.
Moving into the one-hour timeframe, we see a clearer picture, and one particular area looks interesting here. That’s the area marked in blue, the level between 158 and 158.5.
A reclaim of this level could be a sign of short to medium term strength. A rejection at this level would mean that sellers are in control, and would suggest the market is looking at this recent intervention move with more confidence.
Key levels to watch
- 160, the trendline retest area on the daily, a reclaim could mean bulls are back in control
- 158 to 158.5, the 1H zone, a reclaim could signal short to medium term strength while a rejection could show sellers in control
- 157, the current area, inside the local long reload zone on the daily
- 155, the equal lows, a break below could confirm a proper structure break
Trade Now
Trading involves risk.
Author



 Risk Disclaimer
The content provided here is for informational purposes only. It is not intended as personal investment advice and does not constitute a solicitation or invitation to engage in any financial transactions, investments, or related activities. Past performance is not a reliable indicator of future results.
The financial products offered by the Company are complex and come with a high risk of losing money rapidly due to leverage. These products may not be suitable for all investors. Before engaging, you should consider whether you understand how these leveraged products work and whether you can afford the high risk of losing your money.
The Company does not accept clients from the Restricted Jurisdictions as indicated in our website/ T&C. Some services or products may not be available in your jurisdiction.
The applicable legal entity and its respective products and services depend on the client’s country of residence and the entity with which the client has established a contractual relationship during registration.








