
 6 min read
 On Wednesday 19 August, Bitcoin (BTC) climbed from around $64,100 to $69,500, its biggest single-day gain since March. Ethereum (ETH) moved from roughly $1,900 to back above $2,000.
Here’s what caused it, in plain terms.
The US government made borrowing cheaper
The US Treasury said it will buy back twice as much of its own long-term debt as previously planned, lifting the limit from $2bn to at least $4bn per operation. This starts on 9 September and runs to early November.
When the government buys back its bonds, bond prices rise and yields fall. Lower yields make bonds less attractive to hold, so some investors look elsewhere for returns. That’s part of why money moved into crypto.
Washington signalled friendlier rules
The Securities and Exchange Commission (SEC) proposed the first set of rules written specifically for crypto, rather than borrowed from stock market law. It could mean easier fundraising for projects and a clearer path to avoid being classified as a security.
It’s still only a proposal and needs a vote. The same week, crypto executives met at the White House. Neither is a done deal, but together they point in one direction.
Why the move got so big: a chain reaction
Those two news items alone were worth a few percent. The chain reaction did the rest.
A lot of traders were shorting Bitcoin, meaning they’d bet the price would fall. When it rose instead, their losses grew and exchanges automatically closed those positions by buying Bitcoin back. That buying pushed the price up further, which closed more positions, and so on.
Around $1.9bn of positions were liquidated in 24 hours, most of them shorts, and a large part of that went in a single burst.
At the same time, spot Bitcoin exchange-traded funds (ETFs) took in $517m, their biggest day since 4 May.
One detail worth noticing
Gold (XAU) rose 4.35% the same day, its best in six months, and the US Dollar Index (DXY) fell to a three-month low.
That tells us something. If this were purely about optimism, shares would have led. Instead the winners were the assets people buy when they’re worried about the value of money itself. Bitcoin was bought alongside gold, not alongside risky bets.
What the Bitcoin chart shows
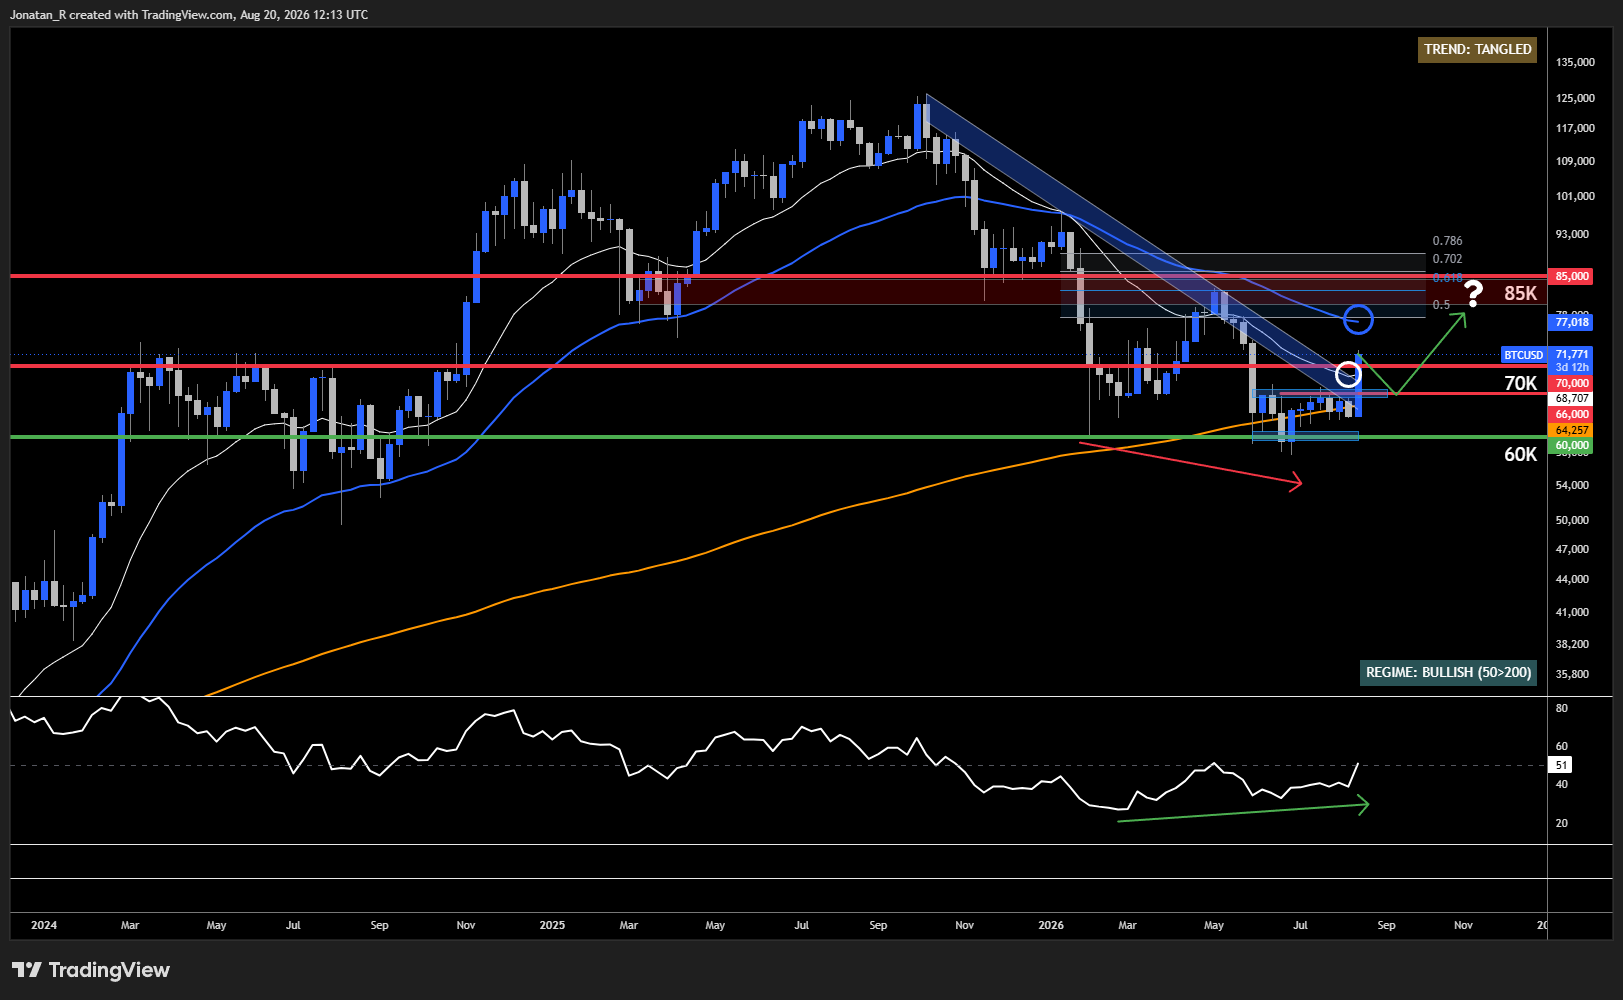
On the weekly chart, momentum had been improving for months. Price kept making lower lows while the Relative Strength Index (RSI) made higher lows, which we call a bullish divergence. It’s a sign that selling is losing force.
This week price broke above the descending trend line and the 20-week exponential moving average. Bitcoin now trades near $71,771.
- If Bitcoin holds $70,000 and pushes higher, or pulls back to $66,000 and sets a higher low, we could get a break in structure. That would be the first proper one since this bear market started.
- The real test sits around $85,000, where the 0.618 Fibonacci retracement sits. Reclaiming that could open the door to a longer bull market.
Zooming in: the daily chart
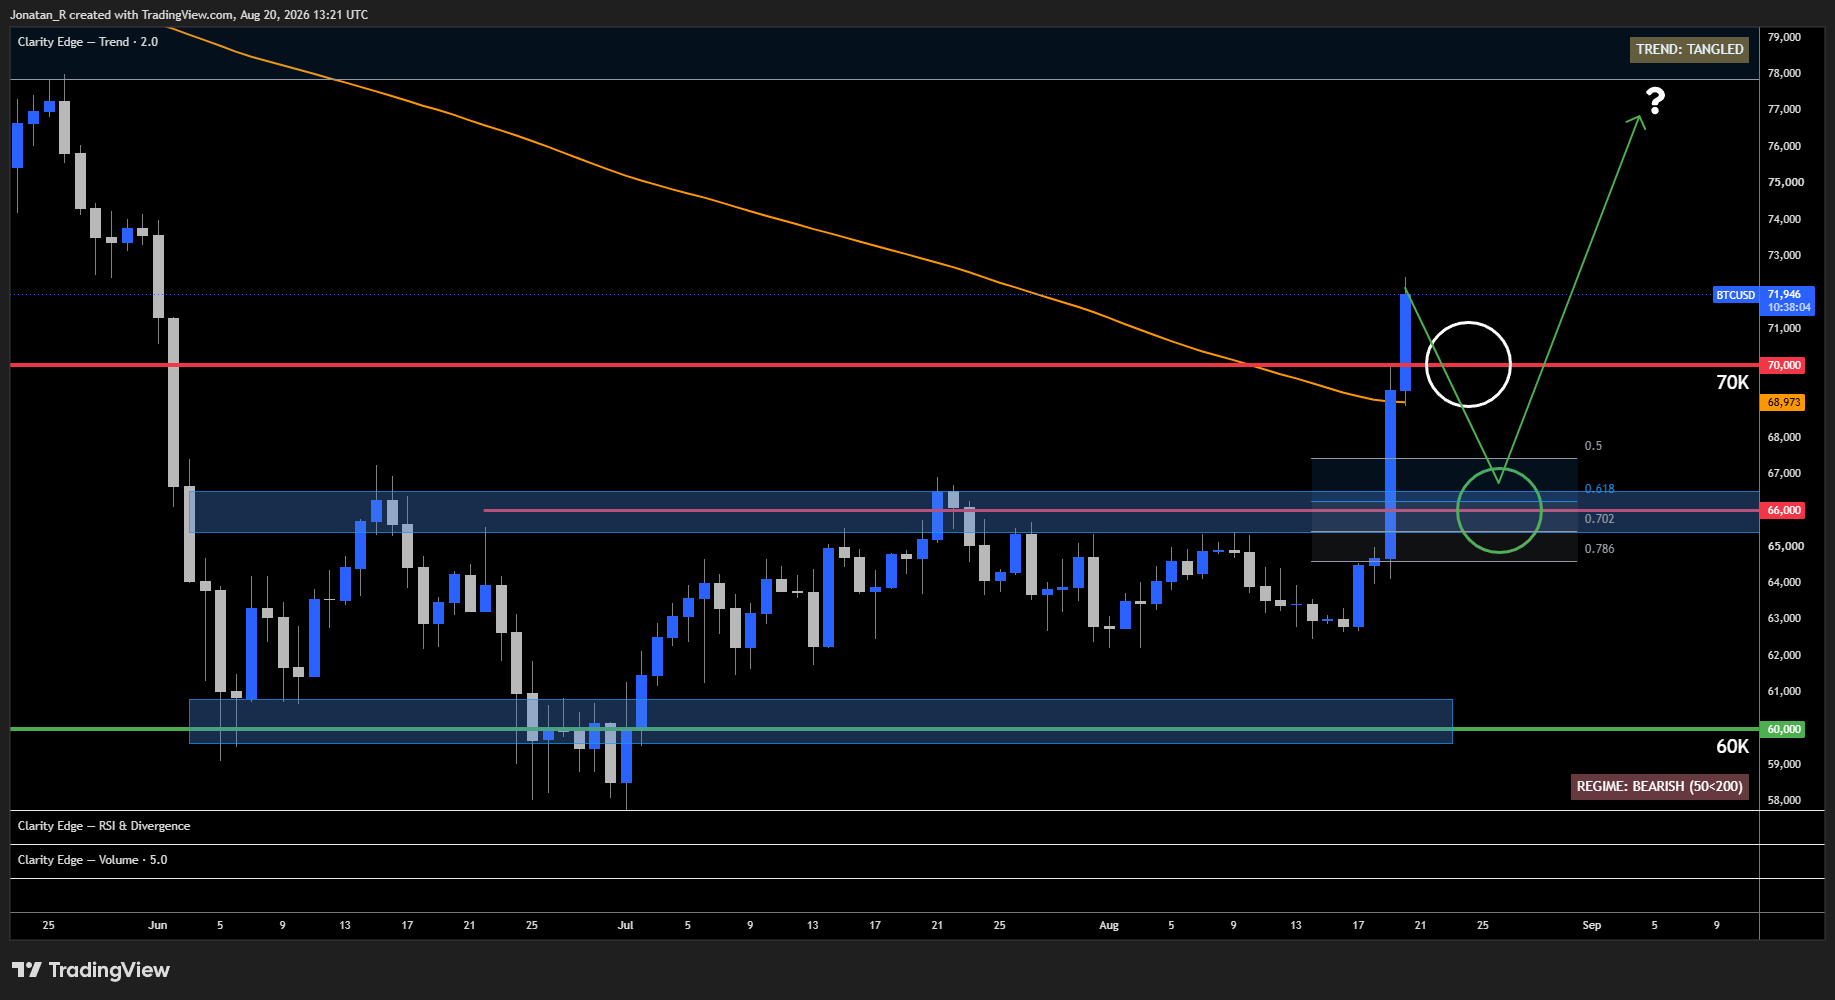
On the daily there are two levels that matter, and both are marked on the chart.
The first is $70,000, circled in white. Bitcoin now trades near $71,946, just above it. If price can hold there and start using $70,000 as support rather than resistance, that would be a meaningful shift in behaviour.
The second is $66,000, circled in green. This is what we’d call a long reload zone: an area where buyers who missed the move would look to step back in. A drop below $70,000 that finds support around $66,000 could also be a meaningful shift, because $66,000 was the top of the previous range. Old resistance holding as new support is one of the more reliable signs that a market has changed character.
If price moves higher from either of those, we could potentially see the beginning of a bigger move towards the $80,000 region.
What’s next?
We’re watching four things:
- The US dollar. If it keeps weakening, the move has support behind it.
- 9 September. The first bond buybacks under the new limit test whether yields stay down.
- ETF flows. One big day is a data point. Several in a row would mean more.
- Bitcoin holding its breakout levels on the way down, not just clearing them on the way up.
Worth remembering September has usually been Bitcoin’s weakest month, averaging a fall of around 3% to 4%. So there’s an obstacle right ahead.
Trading involves risk.
Author



 Risk Disclaimer
The content provided here is for informational purposes only. It is not intended as personal investment advice and does not constitute a solicitation or invitation to engage in any financial transactions, investments, or related activities. Past performance is not a reliable indicator of future results.
The financial products offered by the Company are complex and come with a high risk of losing money rapidly due to leverage. These products may not be suitable for all investors. Before engaging, you should consider whether you understand how these leveraged products work and whether you can afford the high risk of losing your money.
The Company does not accept clients from the Restricted Jurisdictions as indicated in our website/ T&C. Some services or products may not be available in your jurisdiction.
The applicable legal entity and its respective products and services depend on the client’s country of residence and the entity with which the client has established a contractual relationship during registration.








