7 min read
 Key takeaways
- The Nikkei has rebounded for a second straight session as semiconductor stocks lead a broad Asian recovery, driven by strong demand for SK Hynix’s US listing and news that China could allow limited purchases of Nvidia’s H200 chips.
- The bounce is narrow. Short-term breadth has snapped back, but only around 50% of Tokyo-listed stocks sit above their 200-day average, so the broader market’s longer-term trend has only just stabilised.
- On the daily the uptrend is still healthy, with higher highs and higher lows and price bouncing off its ascending trendline inside the long reload zone.
- On the 4-hour, price is capped by a 70,000 resistance zone. A breakout from the local channel and a reclaim of that level could signal the trend continuing higher.
A chip-led rebound after a punishing week
Japan’s Nikkei 225 has clawed back a chunk of the week’s heavy losses, rebounding for a second straight session as semiconductor stocks led a broad recovery across Asia. The move followed reports that South Korean chipmaker SK Hynix’s US listing was more than seven times oversubscribed ahead of its Nasdaq debut, alongside news that China could allow its leading artificial intelligence firms to make limited purchases of Nvidia’s H200 chips. Both fed a wave of buying into Japan’s most heavily weighted chip names, with Advantest, Tokyo Electron and SoftBank among the biggest gainers.
The recovery comes after a punishing stretch. The index fell more than 2% on both 2 July and 8 July, with the second of those declines marking a third straight down session that dragged it below 67,000, shedding close to 3,000 yen across the week before the turn. Those falls tracked a global reversal in semiconductor and AI-related shares, with the Philadelphia Semiconductor Index at one point dropping 6% in the US.
The rebound is narrow
A look under the surface shows why the bounce may be fragile. On 360MiQ’s Tokyo breadth dashboard, the share of stocks trading above their short-term moving average has snapped back with the recovery, with around 71% now above their 20-day average and roughly 61% above their 50-day. The longer-term picture is less convincing. Only about 50% of Tokyo-listed stocks sit above their 200-day moving average, so barely half the market is in a confirmed longer-term uptrend even after the bounce.
A rally led by a small group of high-weight chip names, running ahead of a broader market whose trend has only just stabilised, could stay vulnerable to sharp reversals if sentiment towards the sector turns. The Nikkei volatility index has climbed to a three-month high, pointing to elevated two-way risk.
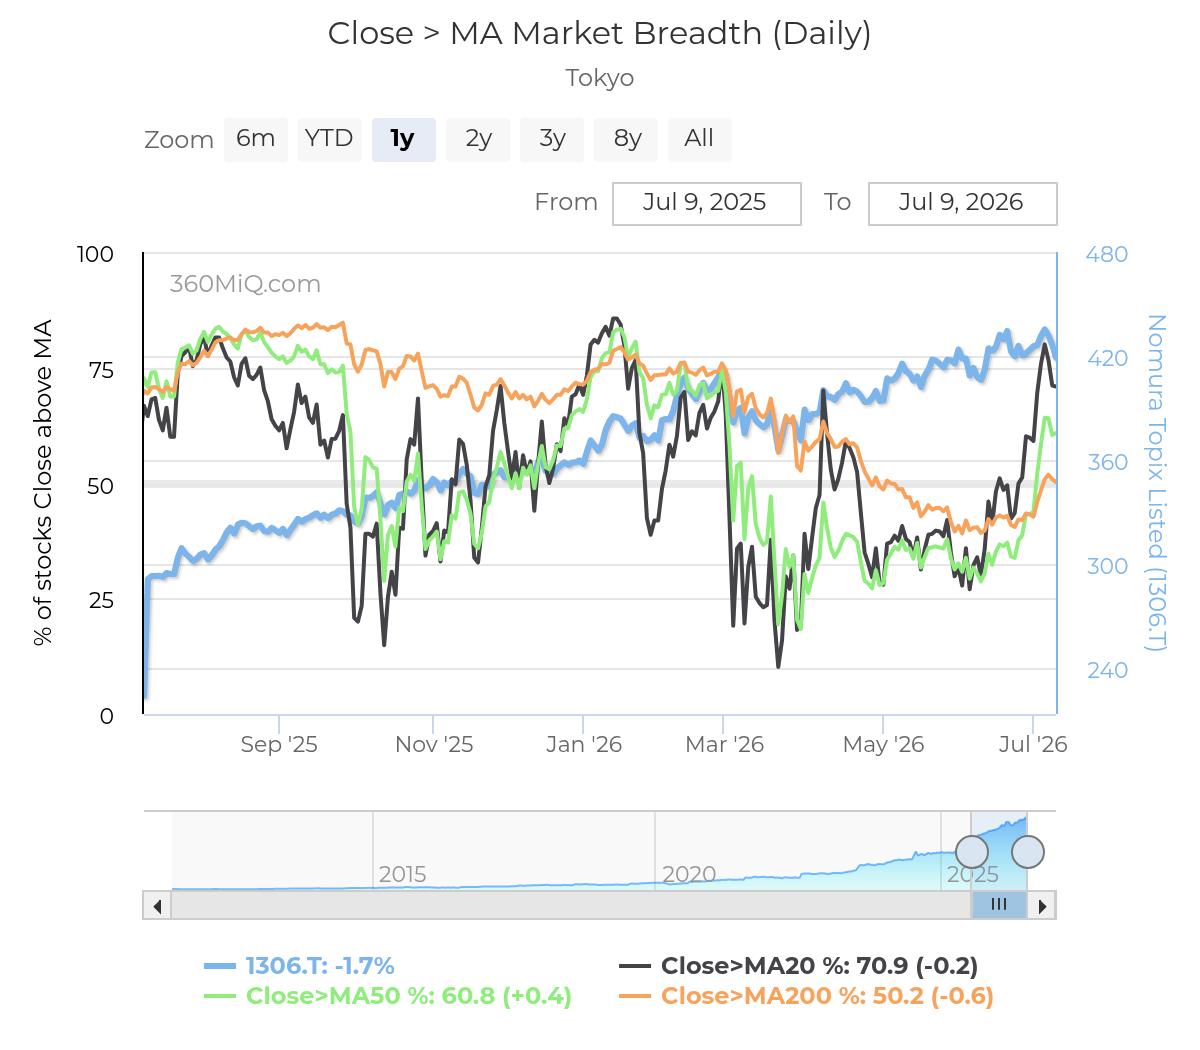
Tokyo market breadth, percentage of stocks trading above their 20, 50 and 200-day moving averages. Source: 360MiQ.
The macro backdrop is not fully supportive
The macro picture leaves room for caution too. Ten-year Japanese government bond yields have pushed towards 30-year highs, a headwind for richly valued technology names, while expected ETF distribution-related selling could add to near-term supply. The ongoing Middle East conflict is keeping oil prices elevated, which could revive inflation concerns for an import-dependent economy and complicate the Bank of Japan’s path after its June hike to 1.0%. For now the index has still not reclaimed its record high from 22 June, leaving open the question of whether this is the start of a durable recovery or another bounce within a volatile range.
Daily chart
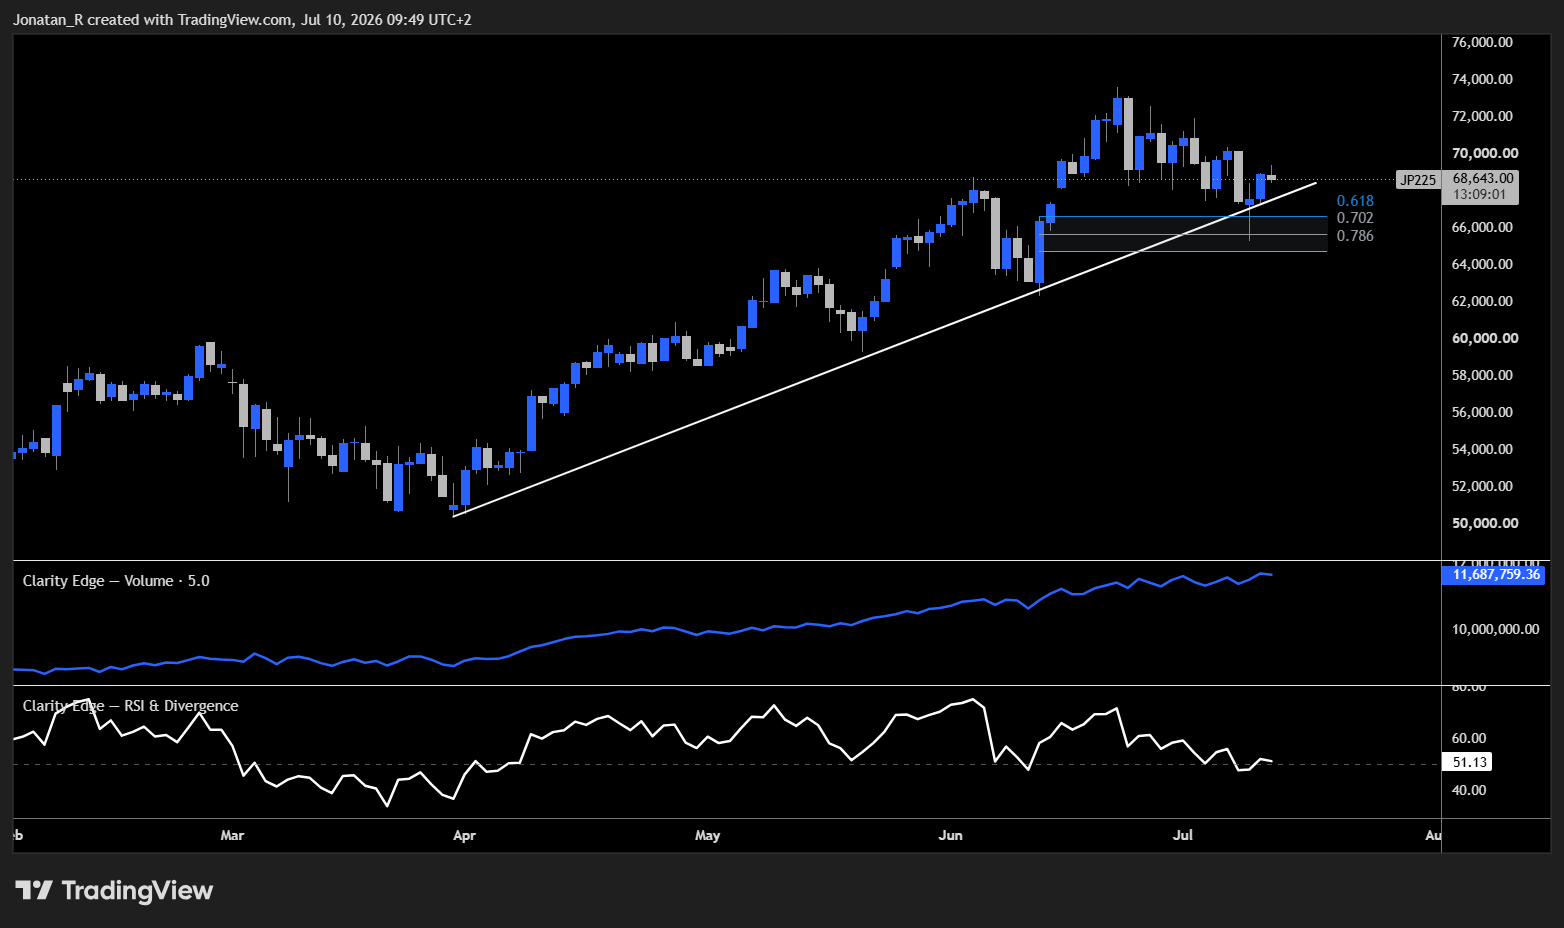
On the daily timeframe the Nikkei is still in a healthy uptrend, printing higher highs and higher lows. The accumulation distribution line is in a steady uptrend alongside price, so buyers are staying in control on the way up. Price is bouncing nicely off the ascending trendline that has defined this move, and the recent bounce is happening right on that trendline as well as inside the local long reload zone (the 0.618 to 0.786 band), where it has printed a doji-type candle, a sign the sellers lost momentum into support.
The RSI backs this up. It’s holding above the 50 level and staying in its bullish range, which is what we want to see while the trend is intact rather than rolling over.
4-hour chart
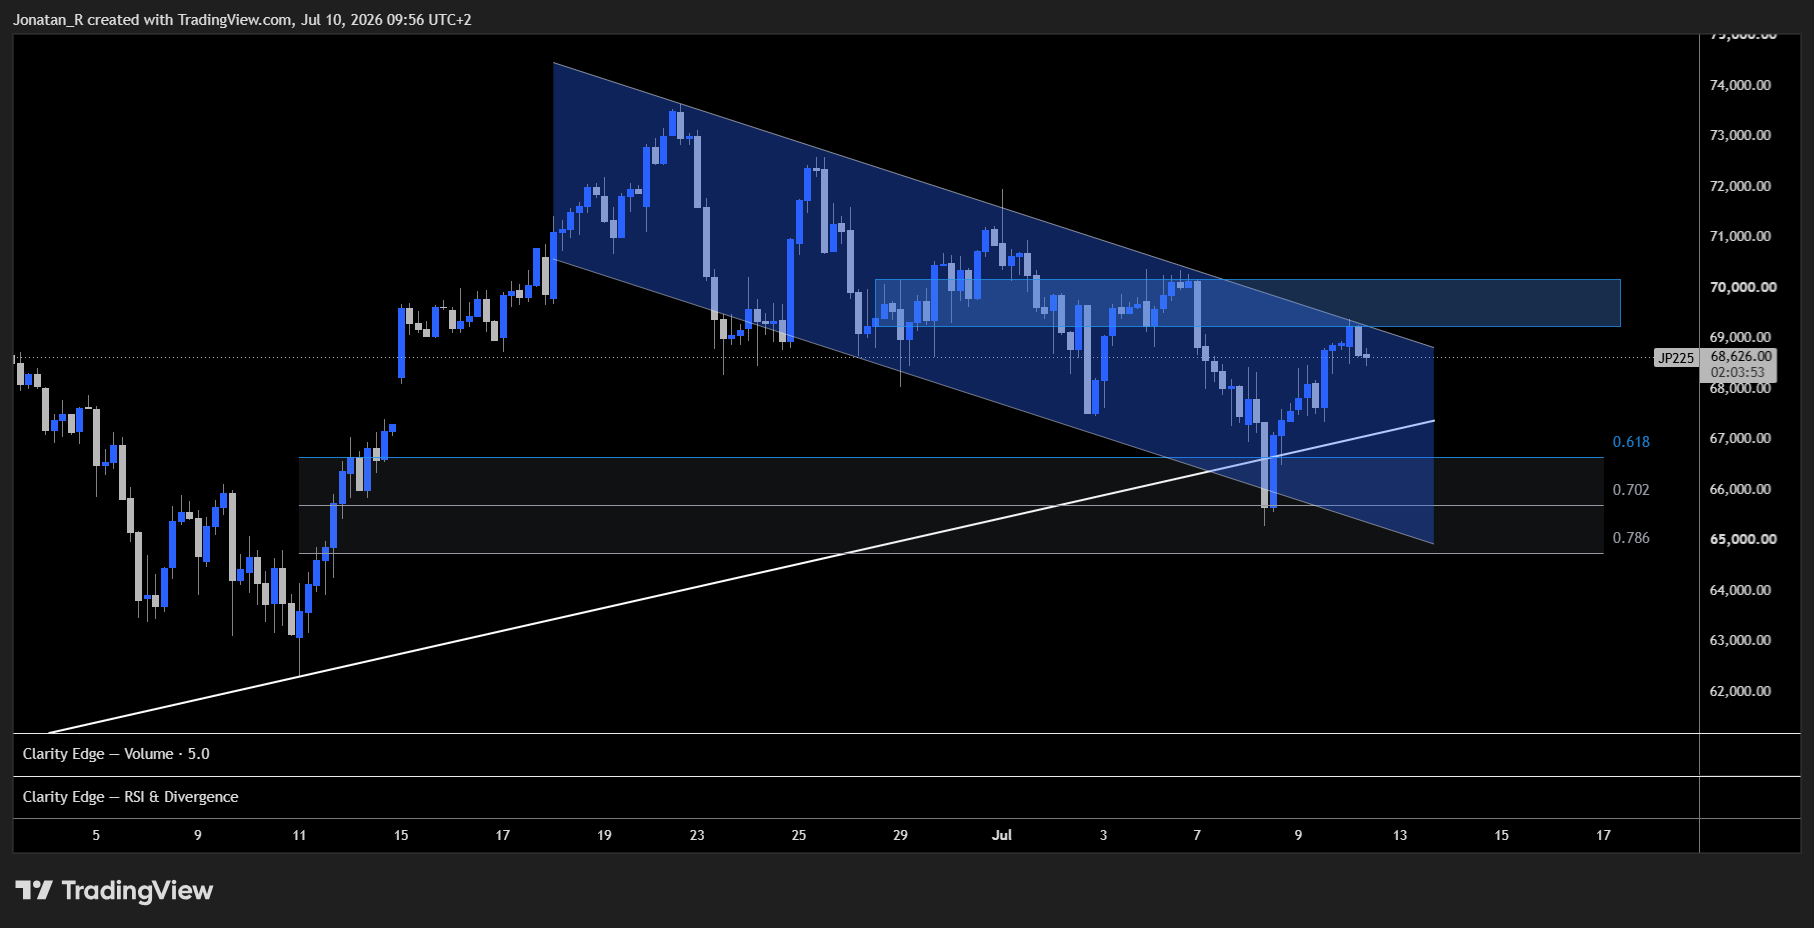
On the 4-hour we see a local downtrend. Price action is confined within a downwards trending channel, with a clear resistance zone above at 70,000. That’s the level the near-term move is fighting against.
For now the index is grinding back up towards the top of that channel. A break out of the channel and a reclaim of the 70,000 zone could be the signal to see this trend potentially continue to the upside, tying back in with the healthy uptrend still intact on the daily.
Key levels to watch
- 70,000 – 4-hour resistance zone. A channel breakout and reclaim of this level could signal the trend continuing higher.
- Ascending trendline / long reload zone (0.618 to 0.786) – daily support, where price is bouncing and has printed a doji-type candle.
- RSI 50 – the bullish threshold holding on the daily, keeping momentum in its bullish range.
Author



 Risk Disclaimer
The content provided here is for informational purposes only. It is not intended as personal investment advice and does not constitute a solicitation or invitation to engage in any financial transactions, investments, or related activities. Past performance is not a reliable indicator of future results.
The financial products offered by the Company are complex and come with a high risk of losing money rapidly due to leverage. These products may not be suitable for all investors. Before engaging, you should consider whether you understand how these leveraged products work and whether you can afford the high risk of losing your money.
The Company does not accept clients from the Restricted Jurisdictions as indicated in our website/ T&C. Some services or products may not be available in your jurisdiction.
The applicable legal entity and its respective products and services depend on the client’s country of residence and the entity with which the client has established a contractual relationship during registration.