5 min read
 The S&P 500 has fallen for three straight sessions since setting its record last week, with semiconductors taking the brunt of the selling as long-dated government bond yields hold at their highest levels in almost two decades. That selling carried into Asia overnight, where the Korean and Japanese markets dropped sharply, and it has left the index trading right on the support it spent last week defending.
The 4-hour chart
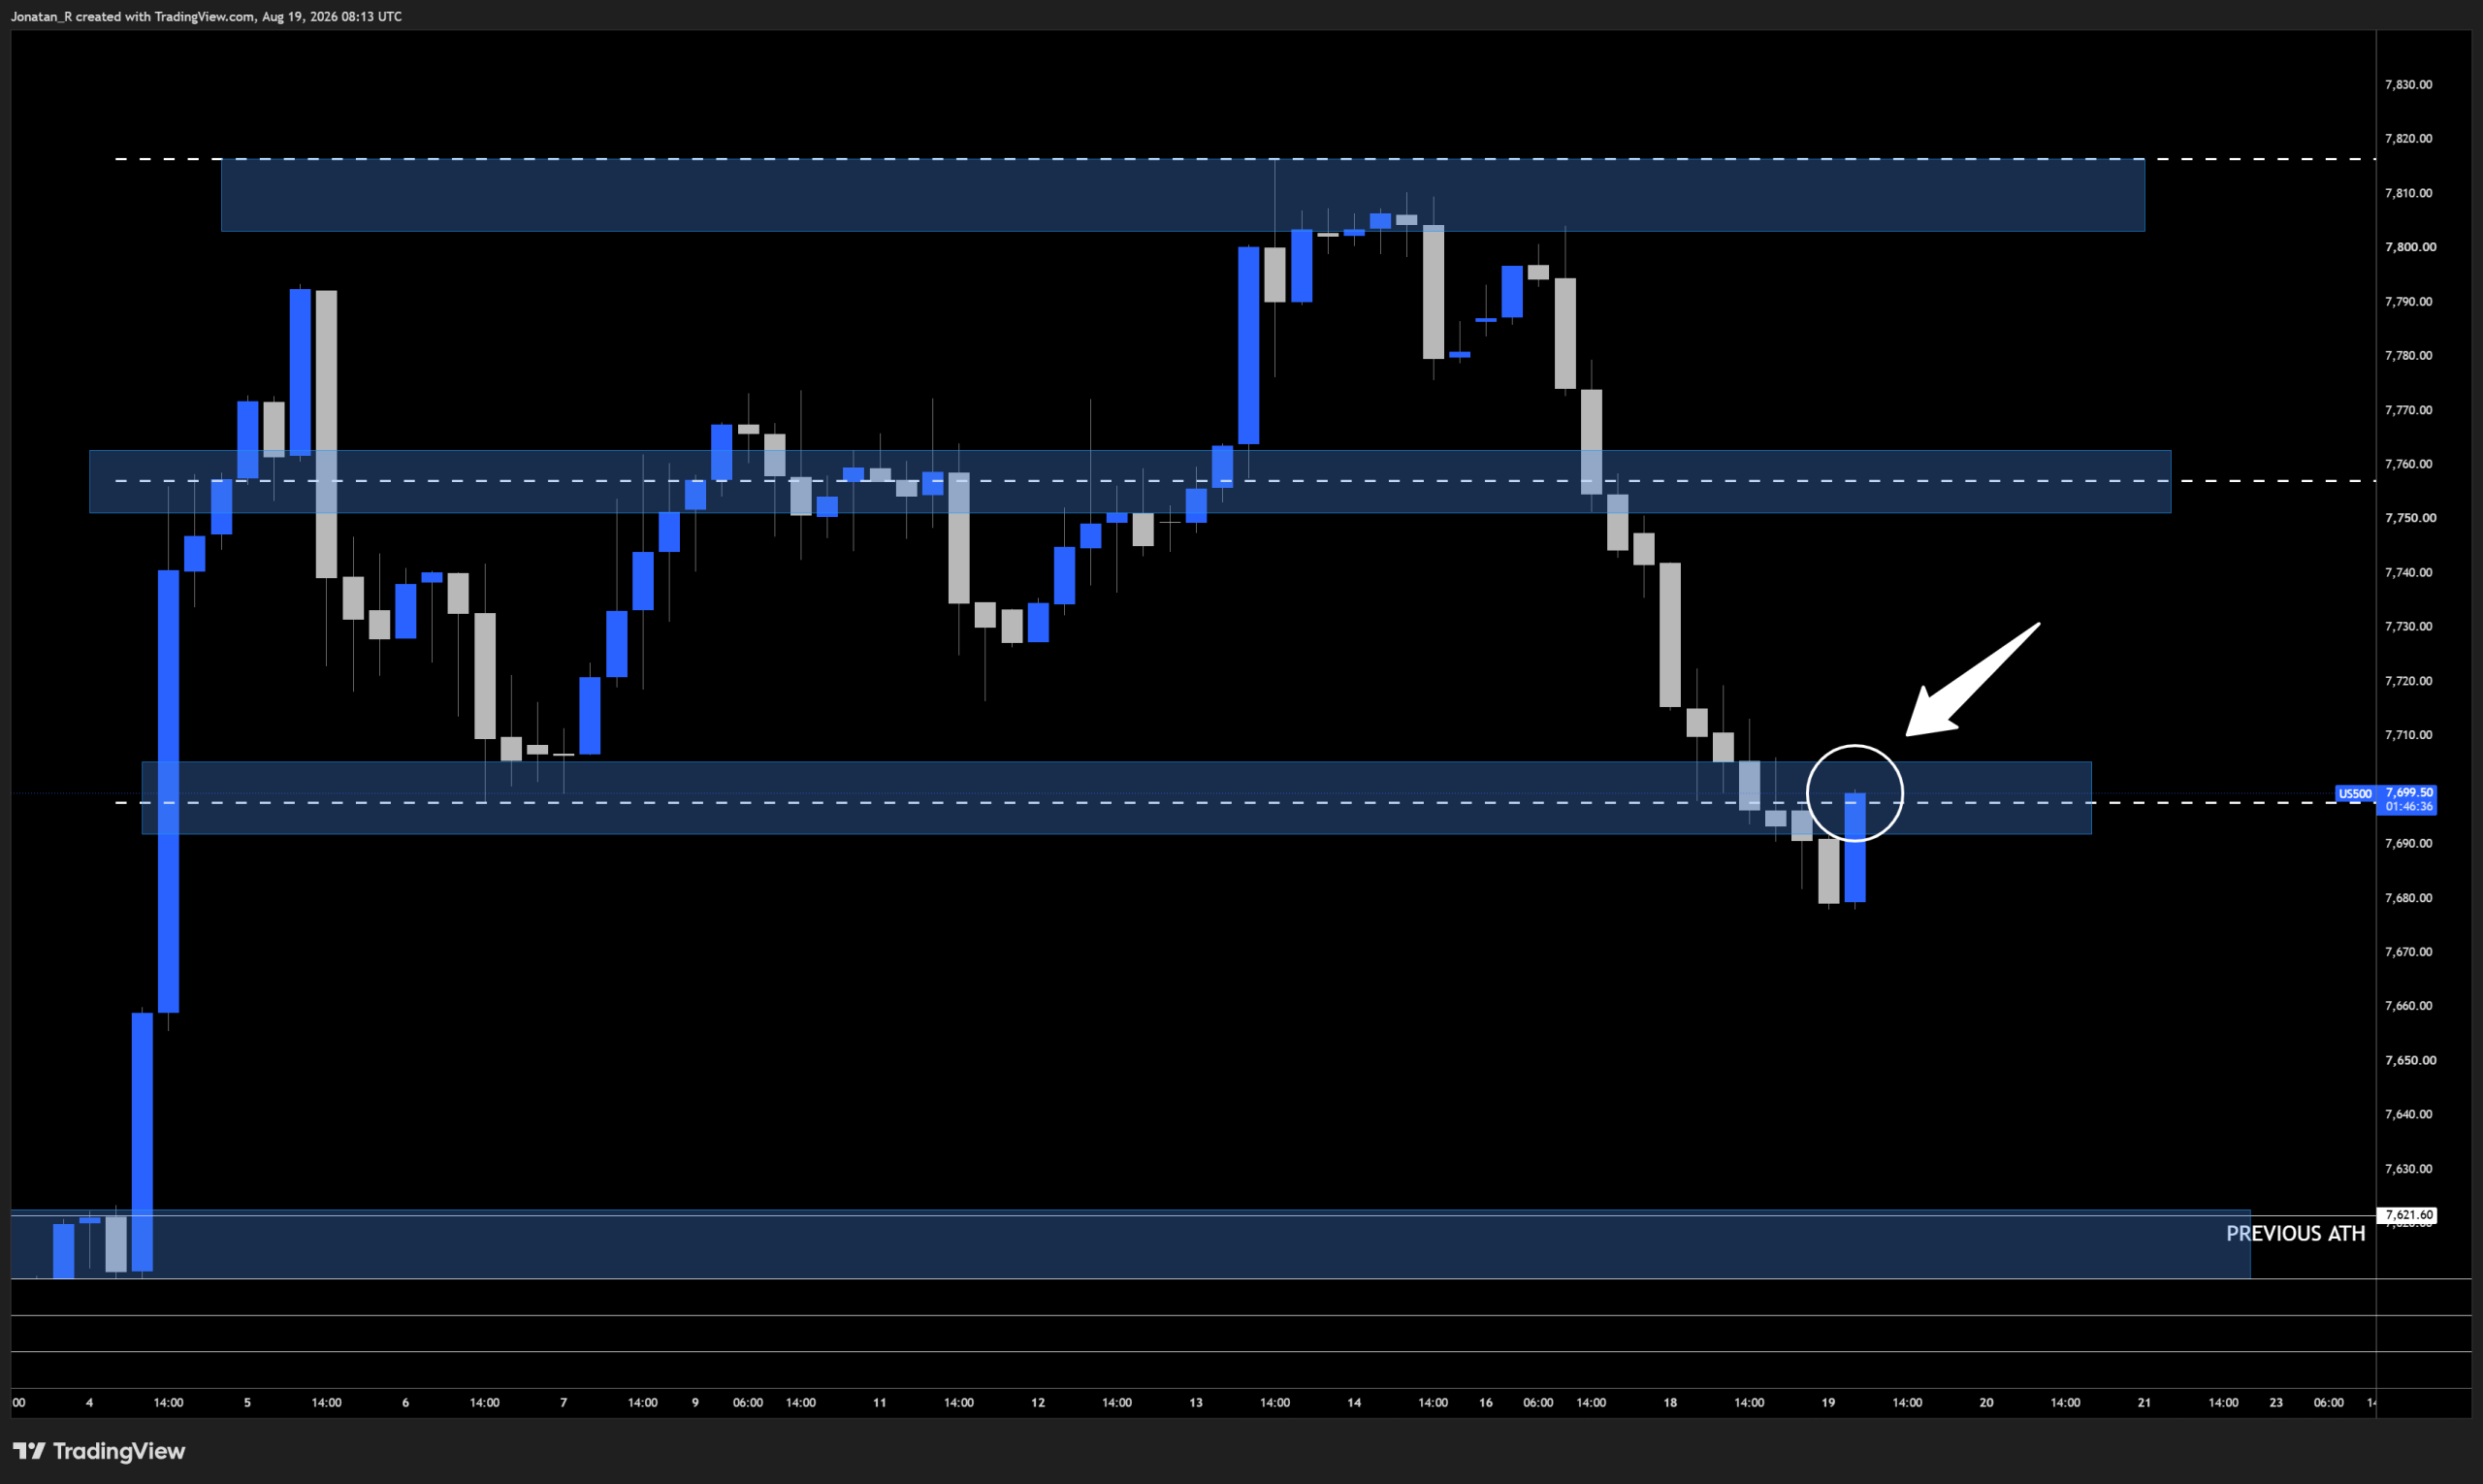
The S&P 500 on the 4-hour chart, testing the 7,700 support zone from below after breaking beneath it overnight.
In our previous coverage of the S&P 500 the index was holding its record with 7,760 as the range equilibrium and 7,700 as the range lows, and price has now worked its way through both. It broke below the 7,700 support level overnight, and we’re seeing some bullish momentum coming back into the market from there.
The question is whether this turns into a bearish rejection of resistance, or whether we get a reclaim of lost support. That will be a crucial sign of where this market is heading, particularly given the renewed uncertainty in the Middle East and the sell-off within the semiconductor index. Minutes from the Fed’s July meeting land after the European close, which adds another layer of event risk to whichever way this resolves.
The 1-hour chart
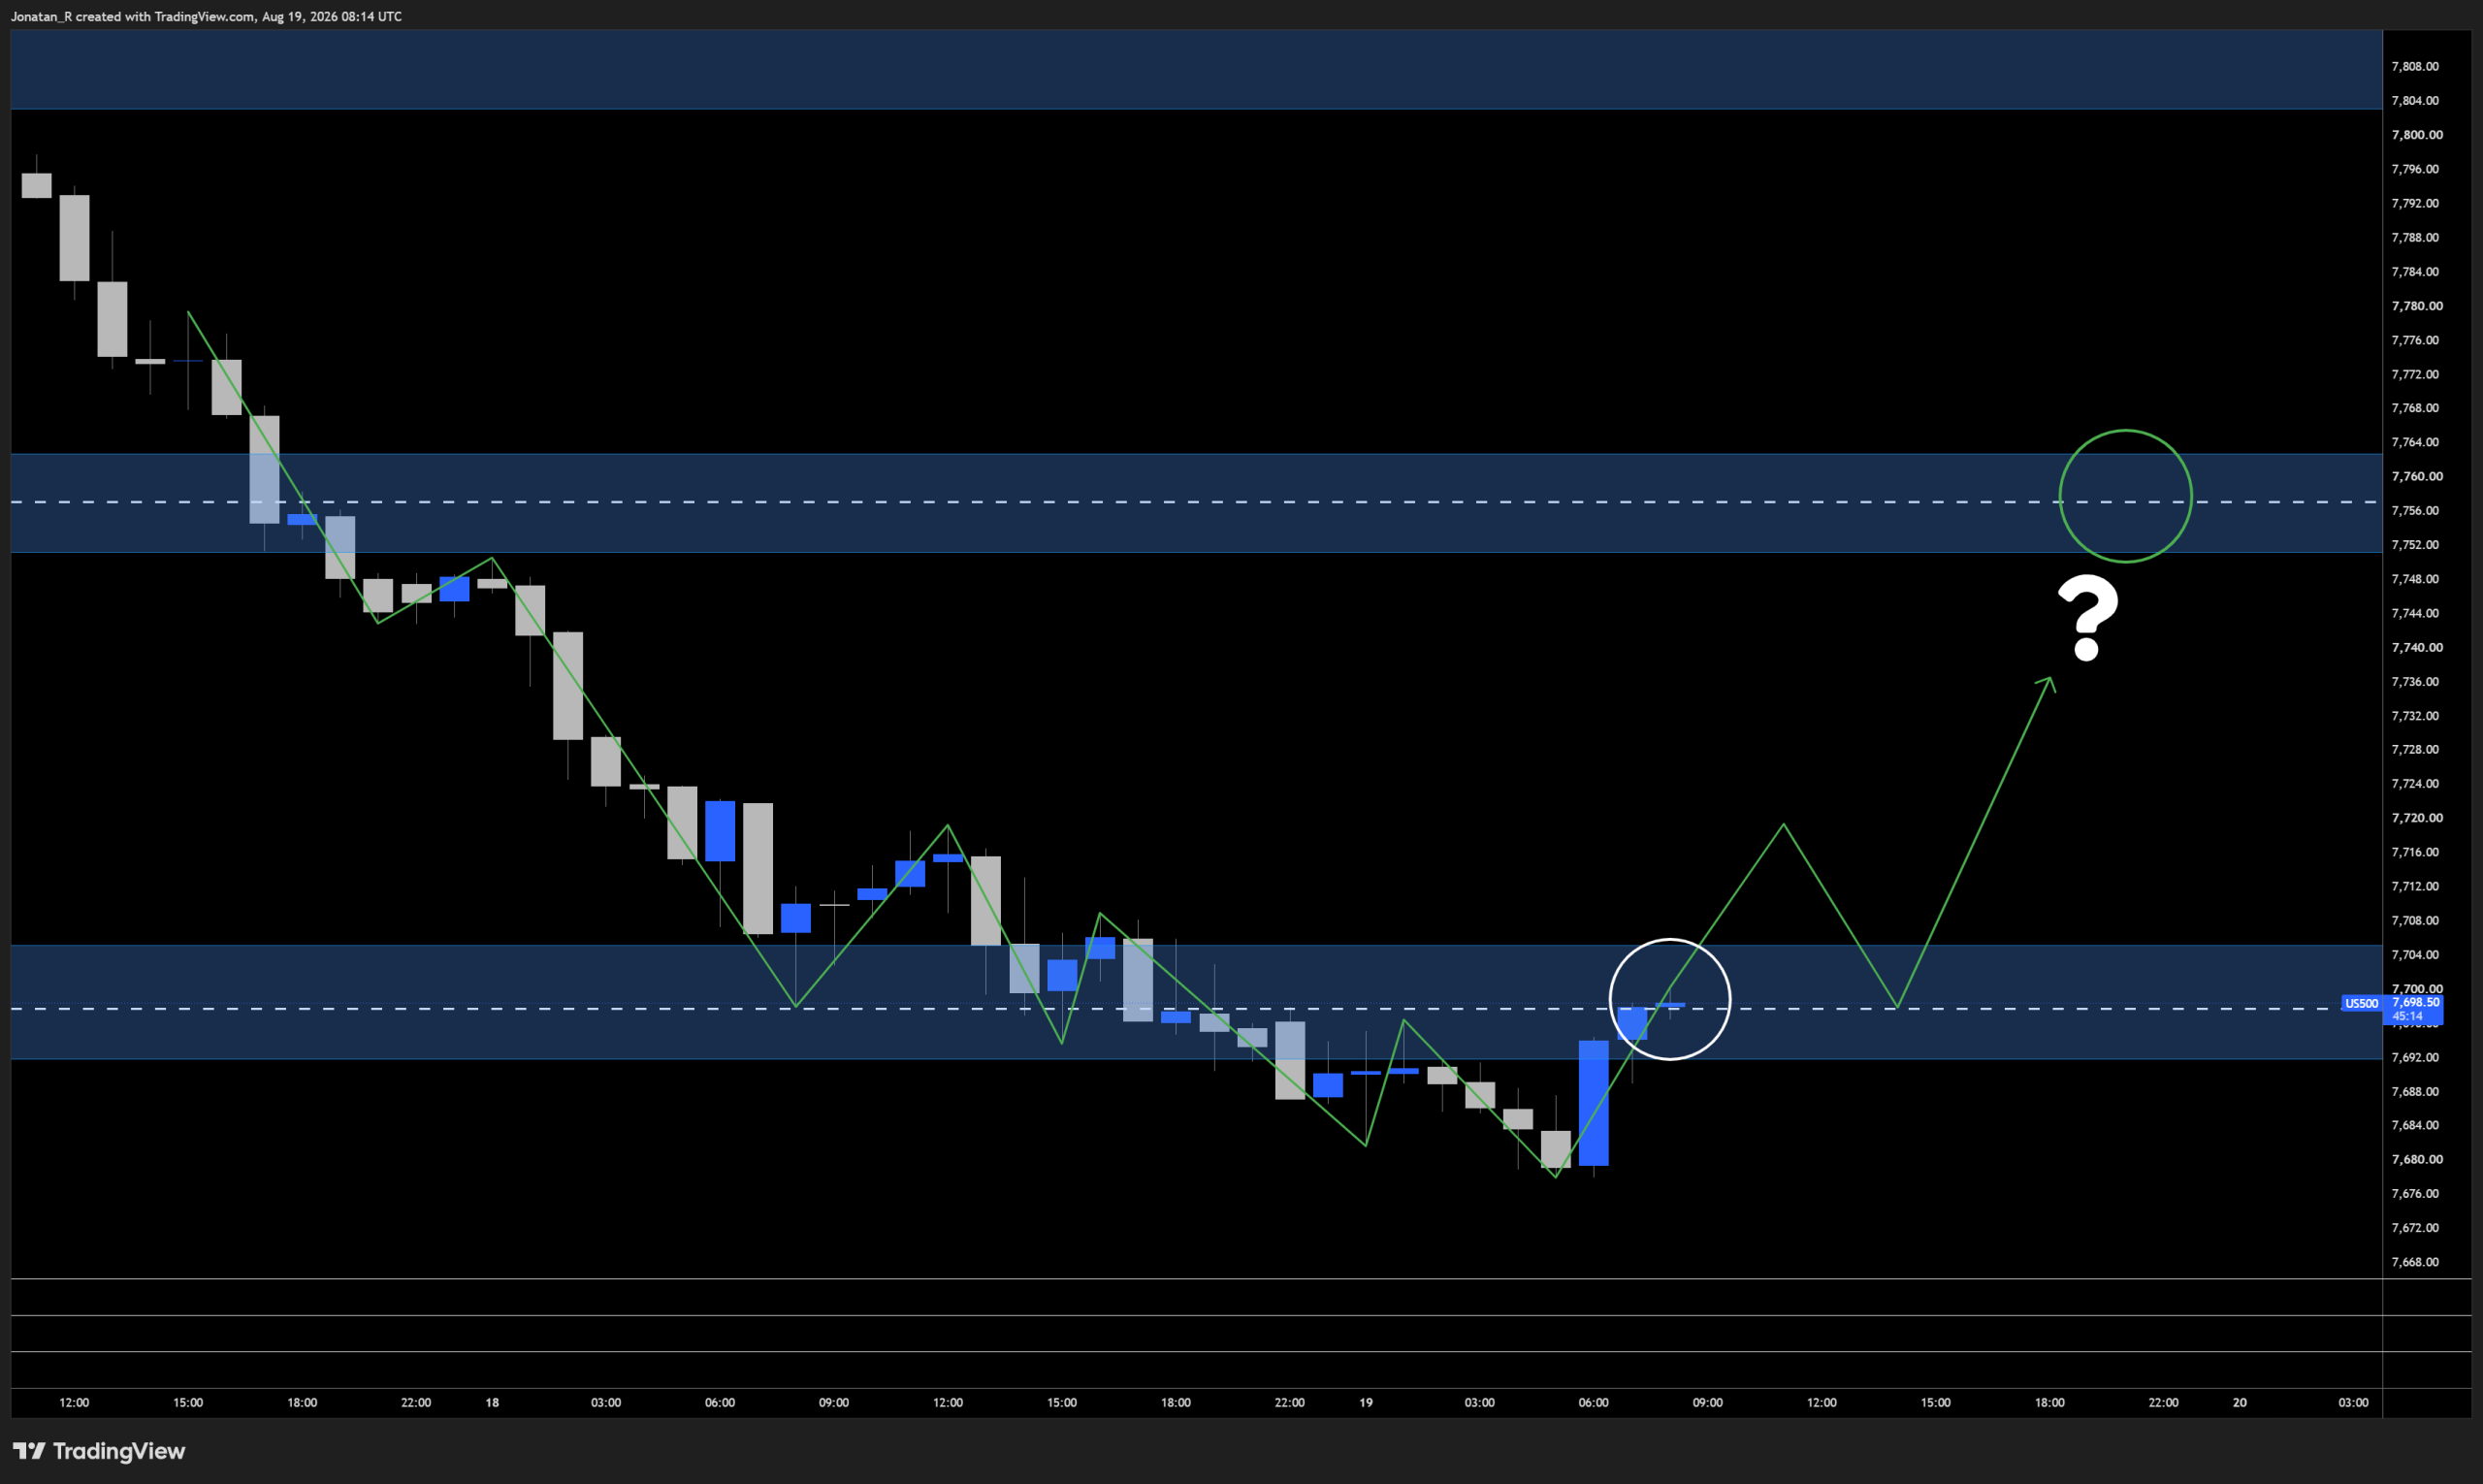
The 1-hour chart shows price retesting the 7,700 region from beneath, with the 7,760 range equilibrium marked above.
On the 1-hour we can see that retest of the 7,700 region, marked with a white circle. If we get a break and retest of this level, we could potentially make our move up to the 7,760 level above, the range equilibrium marked with a green circle on the chart.
A failure to reclaim this level and we could potentially move back down towards the 7,600 area, where the previous all-time high sits and the range high of that earlier consolidation phase.
The semiconductor index
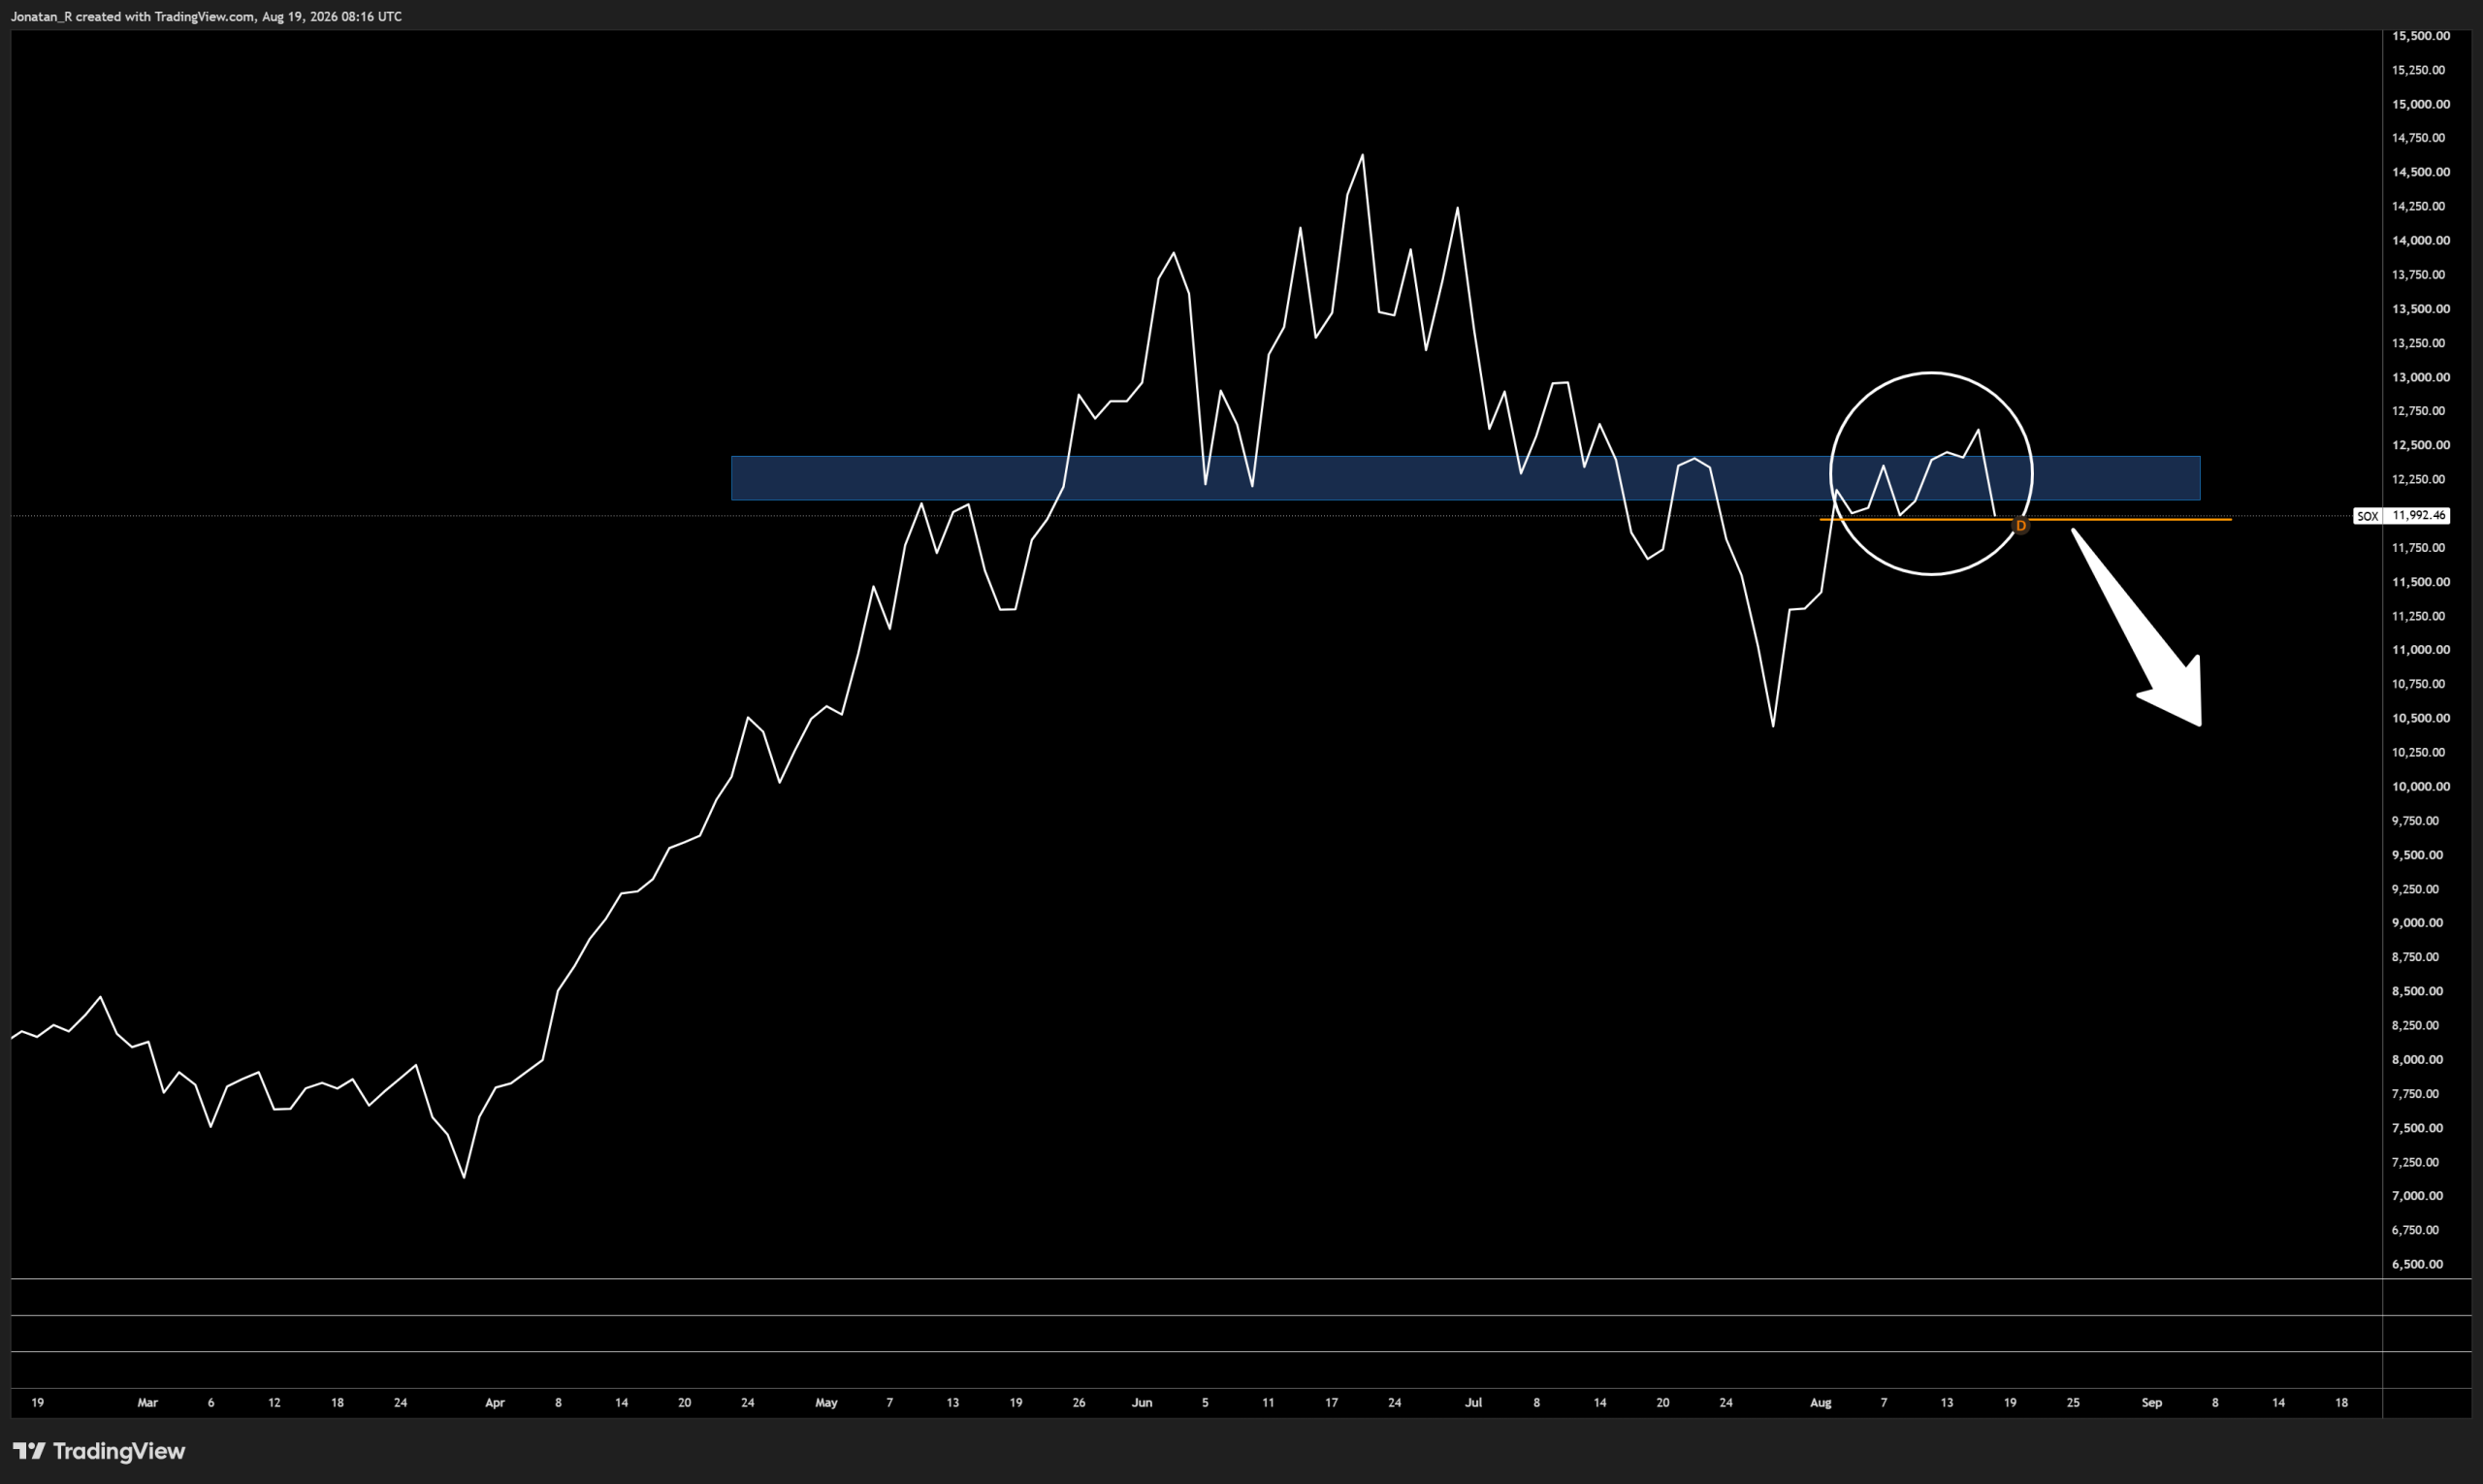
The daily chart of the Philadelphia semiconductor index, showing a potential rejection at the resistance area it has traded around since May.
For some context, the daily chart of the Philadelphia semiconductor index is showing a potential bearish rejection at the 12,250 resistance area, after the index shed more than 5% in a single session on Tuesday with memory and data storage names leading the decline.
If this index breaks lower, below the current support marked in orange, we could potentially see a deeper retrace, and that could potentially translate over into global equities.
Trade Now
Trading involves risk.
Author



 Risk Disclaimer
The content provided here is for informational purposes only. It is not intended as personal investment advice and does not constitute a solicitation or invitation to engage in any financial transactions, investments, or related activities. Past performance is not a reliable indicator of future results.
The financial products offered by the Company are complex and come with a high risk of losing money rapidly due to leverage. These products may not be suitable for all investors. Before engaging, you should consider whether you understand how these leveraged products work and whether you can afford the high risk of losing your money.
The Company does not accept clients from the Restricted Jurisdictions as indicated in our website/ T&C. Some services or products may not be available in your jurisdiction.
The applicable legal entity and its respective products and services depend on the client’s country of residence and the entity with which the client has established a contractual relationship during registration.