
 18 min read
 The S&P 500 trades near 7,680 in late August 2026, about 2% below the record high it set on 13 August. The index (traded on PrimeXBT as the SP500 index CFD) tracks 500 of the largest US-listed companies weighted by float-adjusted market capitalisation, and it is the benchmark most of the world means when it says “the stock market“. This page sets out PrimeXBT’s outlook for the index through 2030 and out to 2050, what Wall Street’s strategists currently expect, the levels traders are watching, and the dated events that could move the market. Every figure is given as a band because a single number on a five-year view would be false precision, and where the evidence points two ways, both directions are shown.
S&P 500 outlook at a glance
- 2026 base case: 7,450–8,250 points, averaging near 7,810 over the remaining months of the year.
- What Wall Street says: published year-end 2026 targets run from 7,100 to 8,400, with the densest cluster at 8,000–8,100.
- Biggest downside risk: long-end Treasury yields near two-decade highs, with a close below the 7,380 area opening the door to the July lows.
- Long-term view: the outlook compounds earnings growth at a rate below the index’s own history, and figures beyond 2030 describe a trajectory rather than dated targets.
Live S&P 500 chart
The chart below tracks the index in real time. The levels that matter right now are covered in the technical section further down.
Trading involves risk.
S&P 500 forecast 2026–2030
PrimeXBT’s expected range for each year is set out below, in index points. Institutional year-end targets rest on different assumptions and are kept separate in the analyst section rather than blended in here.
| Year | Minimum | Average | Maximum |
|---|---|---|---|
| 2026 | 7,450 | 7,810 | 8,248 |
| 2027 | 7,552 | 8,225 | 9,180 |
| 2028 | 7,841 | 8,712 | 9,583 |
| 2029 | 8,050 | 9,148 | 10,246 |
| 2030 | 8,261 | 9,606 | 10,951 |
The shape of that path comes from two inputs pulling in opposite directions. Corporate profits are growing at a pace the index has not seen since the post-pandemic rebound, which argues for higher levels. Valuation and the cost of money argue for a slower climb: the 30-year Treasury yield touched 5.337% in August, its highest in nearly two decades, and a higher discount rate compresses what investors will pay for the same stream of earnings. The forecast leans toward earnings carrying the index higher while the multiple gives ground, which produces a rising path without a melt-up.
S&P 500 forecast 2026
PrimeXBT expects the S&P 500 to end 2026 near 7,900, within a range of roughly 7,450 to 8,250 for the remainder of the year. That base case sits slightly below the 8,000–8,100 cluster where most sell-side strategists have landed, because the outlook gives more weight to the drag from long-end yields than the median strategist does. Only the forward months are shown: the year’s realised prices are history, not forecast.
| Month (2026) | Minimum | Average | Maximum |
|---|---|---|---|
| September | 7,450 | 7,720 | 7,990 |
| October | 7,484 | 7,780 | 8,076 |
| November | 7,519 | 7,840 | 8,161 |
| December | 7,552 | 7,900 | 8,248 |
September is the month with the thinnest cushion. The quarterly index rebalance and the quarterly futures expiry both land on 18 September, two days after a Federal Reserve meeting that carries updated economic projections, and the month has the year’s tightest band as a result.
S&P 500 forecast 2027
PrimeXBT’s 2027 outlook runs from about 7,552 to 9,180, averaging near 8,225, with the path climbing from roughly 7,950 in January to 8,500 by December. The step up rests on earnings rather than sentiment: analysts’ bottom-up estimates point to another year of double-digit profit growth after 2026’s surge, and even a mildly compressing multiple leaves room for the index to advance.
| Month (2027) | Minimum | Average | Maximum |
|---|---|---|---|
| January | 7,552 | 7,950 | 8,348 |
| February | 7,578 | 8,000 | 8,422 |
| March | 7,604 | 8,050 | 8,496 |
| April | 7,629 | 8,100 | 8,571 |
| May | 7,654 | 8,150 | 8,646 |
| June | 7,678 | 8,200 | 8,722 |
| July | 7,702 | 8,250 | 8,798 |
| August | 7,727 | 8,300 | 8,873 |
| September | 7,750 | 8,350 | 8,950 |
| October | 7,774 | 8,400 | 9,026 |
| November | 7,797 | 8,450 | 9,103 |
| December | 7,820 | 8,500 | 9,180 |
2027 is also the year the bears have circled. If the enormous capital spending behind the artificial-intelligence build-out starts flowing through income statements as depreciation faster than it flows through as revenue, that shows up in 2027 earnings, not 2026’s.
S&P 500 forecast 2028–2030
Beyond 2027 the forecast stops trying to time events and compounds instead. PrimeXBT’s outlook grows the index at roughly 5% a year in price terms from the end-2027 anchor, which puts 2028 near 8,712 on average, 2029 near 9,148, and 2030 near 9,606, with the band widening from about 10% to 14% either side.
That 5% is a deliberate choice, and it is below the index’s long-run record. Since 1928 the S&P 500 has returned an average of 10.22% a year with dividends reinvested, about 6.94% after inflation. Strip out dividends and the price-only figure is lower again, and the institutions publishing ten-year assumptions are more cautious still: Goldman Sachs Research sees 6.5% a year in total returns, JPMorgan’s long-term assumptions 6.7%, Vanguard’s model 4.2% to 6.2%, and Research Affiliates just 3.2% nominal. Compounding at the historical rate would have been the optimistic choice. Compounding below it, from a starting valuation this high, is the defensible one.
S&P 500 long-term forecast: 2035, 2040, 2050
Numbers at this distance are a shape, not a schedule. Nobody forecasting from 2026 can price the policy regimes, technologies, or shocks of the 2040s, and the honest signal here is the width of the band rather than the midpoint. Continuing the same 5% price compounding produces the following:
| Year | Minimum | Average | Maximum |
|---|---|---|---|
| 2035 | 9,805 | 12,256 | 14,707 |
| 2040 | 11,732 | 15,642 | 19,553 |
| 2050 | 16,562 | 25,479 | 34,397 |
The gap between the 2050 minimum and maximum is more than double, which is roughly the honest uncertainty in a 24-year equity projection. Anyone quoting a single figure for 2050 is selling precision that does not exist.
What Wall Street expects
Published year-end 2026 targets for the S&P 500 span 1,300 points, from the 7,100 shared by Bank of America and Ned Davis Research up to Ed Yardeni’s 8,400. The table below collects the named calls with the date each was made, because these numbers get revised every few weeks and an undated target is worthless.
| Firm | Year-end 2026 target | Date of call | Change |
|---|---|---|---|
| Yardeni Research | 8,400 | 12 Aug 2026 | Raised from 8,250 |
| RBC Capital Markets | 8,150 | 29 Jun 2026 | Raised from 7,900; horizon reported as both year-end and 12-month |
| Citigroup | 8,100 | 8 Jun 2026 | Raised from 7,700 |
| UBS Global Wealth Management | 8,100 | 21 Aug 2026 | Raised from 7,900; separate mid-2027 target 8,400 |
| Oppenheimer | 8,100 | 8 Dec 2025 | Street high when set |
| Goldman Sachs | 8,000 | 26 May 2026 | Raised from 7,600 |
| Morgan Stanley | 8,000 | 13 May 2026 | Raised from 7,800; separate 12-month call at 8,300 |
| J.P. Morgan | 8,000 | 10 Aug 2026 | Raised from 7,800, second hike in two months |
| Deutsche Bank | 8,000 | 1 Dec 2025 | Initiated |
| Fundstrat (Tom Lee) | 8,000 | 25 Jun 2026 | Joined the 8,000 camp |
| Wells Fargo | 7,950 | 16 Jun 2026 | Raised |
| Barclays | 7,800 | 23 Jun 2026 | Raised from 7,650; 2027 target 8,800 |
| Evercore ISI | 7,750 | Reaffirmed 19 Aug 2026 | Bull case 9,000 |
| HSBC | 7,650 | 11 May 2026 | Raised from 7,500 |
| Ned Davis Research | 7,100 | 26 Nov 2025 | Joint Street low |
| Bank of America | 7,100 | Reaffirmed 31 May 2026 | Unchanged, joint Street low |
The sixteen calls above have a median of 8,000. Across the wider twenty-firm list in Reuters’ August factbox the median works out at 7,900. Both figures are calculations on published lists rather than numbers Reuters prints, which is worth stating plainly because a “consensus” for the S&P 500 is always somebody’s arithmetic. And it decays fast: Reuters’ own strategist poll in late May put the end-2026 median at 7,620, then Société Générale went from 7,300 to 8,000 within four weeks of that poll and UBS Global Research from 7,500 to 8,100 within eight.
What separates the bulls from the bears is not the multiple but the earnings line. J.P. Morgan builds its 8,000 on 2026 earnings of $365 a share against a consensus it quotes at $358. Barclays gets to 7,800 on $337 and cut its assumed Big Tech multiple to 26 times from 27.5. Bank of America’s 7,100 rests on the observation that the index looks expensive on 18 of the 20 valuation measures the bank tracks. Same market, three different arguments, and averaging them would hide all three.
Track record of this forecast
This is the first published PrimeXBT forecast for the S&P 500. From the next monthly review onward, this section will compare the previous forecast against the index’s actual level on the update date, and explain any miss rather than smoothing it over.
S&P 500 technical analysis
The S&P 500 sits above both of its most-watched moving averages, with the 50-day rising through the 7,550–7,620 area and the 200-day far below near 7,100. It has held above the 200-day since April and above the 50-day since the end of July, and the 50-day has been above the 200-day for more than a year. That configuration describes an intact uptrend with a wide cushion, not a market on the edge.
The support levels traders are citing run 7,620 first, then 7,560, the 100-day average near 7,380, the July low zone at 7,313–7,237, and the 200-day near 7,100. On the way up, resistance starts at the record intraday high of 7,816.70, with the next supply zone at 8,000–8,075. Fairlead Strategies’ Katie Stockton has flagged 7,620 as the level the index needs to hold with consecutive closes for the August breakout to stay valid, which makes it the most-watched number on the chart.
Momentum readings are neutral and, unhelpfully, contested. Depending on the data provider, the 14-day RSI reads anywhere from the high 30s to the mid 50s, and the 200-day average itself is quoted as low as 7,100 and as high as 7,605. Where providers disagree this sharply, the range is the finding. All levels are as of publication and are revised at each monthly update.
Correlation with other assets
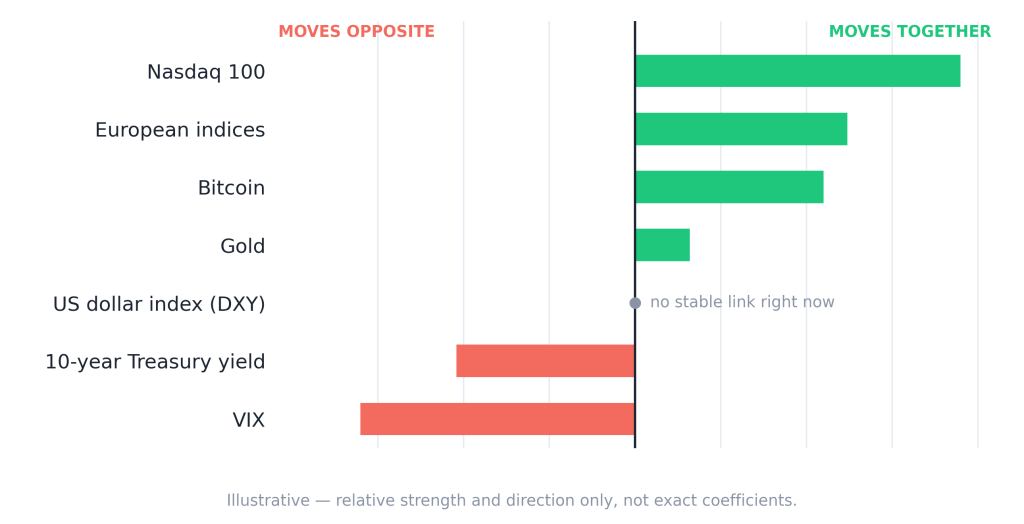
Through 2026 the S&P 500 has traded off the bond market more than anything else. When the 30-year yield pushed above 5.3% in mid-August, equities sold off with it, and when yields eased a week later the index recovered, which is the clearest single relationship in the current market. The VIX normally moves the other way from the index, though that link has been breaking down: on several August sessions both rose together, a pattern traders attributed to record call-option buying. Against the dollar index, no stable relationship is visible right now, and no credible source puts a number on it, so none is offered here. Gold and bitcoin have both rallied on the same dollar-debasement theme rather than on equity risk appetite, which is why they can rise alongside stocks instead of hedging them. Read all of this as the current regime, since these relationships get rebuilt every cycle.
Fundamental factors
Earnings are doing the heavy lifting. FactSet’s 7 August update put second-quarter blended earnings growth at 50.4%, the strongest since 2021, with full-year 2026 growth estimated at 30.0% and 2027 at 13.6%. That is the engine behind every bullish target on the list above.
Valuation depends entirely on which yardstick is used, and the two mainstream ones disagree completely. The forward 12-month price-to-earnings ratio stands at 20.0, barely above its five-year average of 19.9 and one point above its ten-year average of 19.0, which reads as unremarkable. The cyclically adjusted ratio, which averages a decade of inflation-adjusted earnings, sits near 41.6, within a few points of its all-time high. Both are correct. Forward earnings are extraordinary right now, so any measure that divides by them looks tame, while any measure that divides by a ten-year average looks alarming.
Concentration is the third pillar and the main structural risk. The ten largest constituents account for roughly 39% of the index’s market value, and the largest seven technology names for around a third. When a handful of stocks carry that much weight, the index inherits their earnings profile: capital spending across the index grew about 32% year on year in the first quarter of 2026, the fastest since 2007, and the five biggest cloud operators are on track to spend far more on infrastructure than they book in depreciation, deferring a cost that eventually arrives. The index also rebalances quarterly, with share counts and float weights updated effective the third Friday of March, June, September and December, which concentrates index-tracking flows into single sessions.
Upcoming catalysts
Only confirmed, dated events are listed. Macro policy and the inflation data that shapes it remain the clearest near-term drivers.
| Date | Event | Potential impact |
|---|---|---|
| 4 September 2026 | August employment report | A weak print supports rate cuts but revives growth worries |
| 11 September 2026 | August CPI | Sticky core inflation is the main threat to the rate-cut path |
| 15–16 September 2026 | FOMC meeting, with economic projections | The quarter’s biggest single event for the rate path |
| 18 September 2026 | Quarterly index rebalance and quarterly futures expiry | Elevated volume and short-lived dislocations rather than trend |
| 13 October 2026 | Q3 earnings season opens with the large banks | First read on whether the 2027 profit path holds |
| 27–28 October 2026 | FOMC meeting | No projections, so the statement language carries the weight |
| 3 November 2026 | US midterm elections | Control of Congress reprices tax and tariff expectations |
| 8–9 December 2026 | FOMC meeting, with economic projections | Sets the policy frame for 2027 positioning |
| 18 December 2026 | Quarterly rebalance and futures expiry | Year-end flows compound the effect |
FOMC dates follow the Federal Reserve’s published 2026 schedule, CPI and payroll dates the Bureau of Labor Statistics release calendar, and rebalance dates the S&P Dow Jones Indices methodology. Monthly CPI releases also land on 14 October, 10 November and 10 December, and payrolls on 2 October, 6 November and 4 December.
Bull case vs bear case
Bull case:
- Profit growth of 30% in 2026 and an estimated 13.6% in 2027 keeps the earnings engine running.
- The forward multiple of 20.0 is within a rounding error of its five-year average, leaving valuation room the headline warnings imply is gone.
- Strategists have revised up all year, and revision momentum has historically been a better short-run guide than the level of any single target.
- Falling long-end yields would immediately relieve the pressure that caused August’s pullback.
Bear case:
- Long-end yields at two-decade highs leave almost no equity risk premium.
- Concentration means a stumble in a handful of names is a stumble in the index.
- Cloud infrastructure spending is running far ahead of the depreciation being booked against it, and the reckoning lands in 2027 estimates.
- The cyclically adjusted valuation is within a few points of its 1999 record, which historically preceded thin long-run returns rather than an immediate crash.
Invalidation levels. A sustained close under 7,380, the 100-day average, would put the July lows near 7,237 back in play and take the constructive case off the table. The bearish case fails on a clean weekly close above the 13 August record of 7,816.70, roughly 1.8% above where the index trades now, which would confirm the breakout rather than the failure.
Will the stock market crash in 2026?
No credible forecast, PrimeXBT’s included, predicts a crash in the remaining months of 2026, and none rules one out. What can be said with numbers is that crashes are rarer than the coverage suggests: the S&P 500 has closed higher in roughly two thirds of the calendar years since 1928, and bear markets have occupied about a fifth of that period, arriving on average once every three and a half years with an average decline near 35%.
The named bears are not calling for a collapse either. Morgan Stanley’s Mike Wilson said in late July that the index could slip to 7,000 before rallying into year-end. Fundstrat’s Tom Lee put a 10% to 20% drawdown between August and October on his roadmap while keeping an 8,000 year-end target. RBC caps its pullback expectation at 5% to 10% absent a recession. Ray Dalio has pointed to “classic signs” of an artificial-intelligence bubble without naming a level, and the Bank for International Settlements warned in June that an equity repricing could now do more macroeconomic damage than it once would have.
Worth separating the terms: a correction is a decline of 10% to 20%, a bear market is deeper. A 10% pullback from the August record would take the index to roughly 7,035, which is above the 200-day average and inside the range this forecast already contemplates. That distinction, not the word “crash”, is the one that matters for position sizing.
Historical performance
Total returns since 2016 read: 11.96%, 21.83%, −4.38%, 31.49%, 18.40%, 28.71%, −18.11%, 26.29%, 25.02%, 17.88%, and 13.00% so far in 2026. Two down years in eleven, both followed by recoveries inside two years. Figures include reinvested dividends; the price-only index return is roughly a percentage point lower each year, which is worth knowing before comparing any forecast of the index level with a historical return figure.
The drawdowns are the other half of the record. The dot-com unwind cost 49% from March 2000 to October 2002, the financial crisis 57% from October 2007 to March 2009, the pandemic 34% in 33 days, and the 2022 bear market 25%. Earlier in 2026 the index fell short of an official correction, yet the average constituent was down about 21% from its own high at one point, which is what a narrow market looks like from the inside.
Is the S&P 500 a good investment in 2026?
The index enters the final months of 2026 up about 12% on the year, with profit growth at a four-year high and a valuation that looks fair on forward earnings and stretched on a decade of them. That combination is the whole argument, in both directions.
One distinction matters more than the forecast. Holding an index fund for decades and trading an index CFD with leverage are different activities with different risks and different time horizons. PrimeXBT offers the second. A view about where the index sits in 2030 is not a reason to open a leveraged position today, and a five-year forecast says nothing useful about next week’s margin requirements.
How to trade the S&P 500 on PrimeXBT
PrimeXBT lists the S&P 500 as an index CFD under the SP500 symbol, tradeable in both directions regardless of which way this forecast points. Taking a long or a short position works the same way mechanically, and PrimeXBT’s guides to trading the S&P 500 and to index trading cover the setup.
Two features of index CFDs differ from crypto and deserve attention before sizing a position. Cash indices follow exchange hours, so gaps between the close and the next open are normal and a stop can fill beyond its level. Positions held overnight accrue a financing charge, and spreads widen outside the main session, which is covered in PrimeXBT’s breakdown of index CFD spreads. Leverage magnifies gains and losses alike, so position sizing and a stop-loss matter on any trade. Trade on your own analysis and risk tolerance, and never risk more than you can afford to lose.
Trading involves risk.
How we build this forecast
PrimeXBT’s analysts build this outlook from the ground up rather than lifting it from a data feed. The near-term anchor starts from where the index trades and from the spread of published strategist targets, adjusted for how heavily we weight the drag from long-end yields. The 2027 anchor comes from bottom-up earnings estimates and a forward multiple read against its own five- and ten-year averages. Beyond that the path compounds at a rate deliberately set below the index’s long-run history, and the band around each year widens with the horizon because the uncertainty does.
None of this is a guarantee. Equity forecasts are conditional on earnings, policy and liquidity, and one macro surprise can move the index faster than any model expects. Treat every figure here as a considered estimate rather than a promise. The outlook is reviewed and updated monthly as the data changes.
What will the S&P 500 be in 2026?
PrimeXBT's outlook is roughly 7,450–8,250 points for the remainder of 2026, averaging near 7,810, with a year-end base case around 7,900.
What will the S&P 500 be in 2030?
Our outlook puts 2030 in the 8,261–10,951 range, averaging near 9,606. That figure compounds earnings growth rather than forecasting events, so read it as a trajectory.
Where will the S&P 500 be in 10 years?
Around 12,256 on our central path for 2035, within a band of roughly 9,805 to 14,707. The spread is the honest part of the answer.
Can the S&P 500 reach 10,000?
On our numbers, not before 2029, when the top of the modelled band first exceeds 10,000. Getting there sooner would take faster profit growth than analysts currently forecast, or a multiple expanding from an already high base.
Is the S&P 500 a good investment in 2026?
The case runs both ways: profit growth is at a four-year high, and the index looks fair on forward earnings but expensive on a decade of them. Note also that holding an index fund and trading a leveraged index CFD are different activities with different risks.
What is the difference between the S&P 500 and the Nasdaq 100?
The S&P 500 holds 500 companies across every sector of the US market. The Nasdaq 100 holds around 100 of the largest non-financial companies listed on the Nasdaq exchange, which makes it far more concentrated in technology and typically more volatile.
Author



 Risk Disclaimer
The content provided here is for informational purposes only. It is not intended as personal investment advice and does not constitute a solicitation or invitation to engage in any financial transactions, investments, or related activities. Past performance is not a reliable indicator of future results.
The financial products offered by the Company are complex and come with a high risk of losing money rapidly due to leverage. These products may not be suitable for all investors. Before engaging, you should consider whether you understand how these leveraged products work and whether you can afford the high risk of losing your money.
The Company does not accept clients from the Restricted Jurisdictions as indicated in our website/ T&C. Some services or products may not be available in your jurisdiction.
The applicable legal entity and its respective products and services depend on the client’s country of residence and the entity with which the client has established a contractual relationship during registration.








