19 min read
 Silver closed at PKR 7,008 per tola in Pakistan’s sarafa markets on 24 September 2026, or PKR 6,008 per 10 grams. In February, when gold’s price had pushed ordinary buyers out of the market and into chandi, the same 10 grams cost PKR 7,800. Silver (XAG/USD on PrimeXBT) is quoted in US dollars per troy ounce and behaves as two assets at once, a monetary metal that shadows gold and an industrial input that answers to factory demand. Pakistan’s rate is that international price converted at one clean ratio and marked up by a dealer premium. This page forecasts it in rupees per tola through 2030 and out to 2040.
Silver outlook at a glance
- Current price: silver trades at $57.822 per troy ounce, 0.75% over the last 24 hours.
- 2026 base case: PKR 6,210 to PKR 7,670 per tola over the rest of the year, centred near PKR 6,940 in December.
- What analysts say: J.P. Morgan put the Q4 2026 average at $63 per troy ounce in a note dated 13 August, HSBC sees year-end 2026 at $70 from 17 May, and the LBMA’s January panel of 30 analysts averaged $80.36 for the calendar year.
- Biggest downside risk: market-implied odds of an October Federal Reserve hike jumped to 69.7% from 48.7% in a week, and silver has already broken $64.00 to sit on its 50-day average at $63.45.
- Long-term view: compounding below silver’s post-2020 pace points to about PKR 8,830 per tola by 2030 and PKR 13,710 by 2040, a direction and a band rather than a committable price.
Live silver chart
Trading involves risk.
Silver rate in Pakistan today, and what sets it
Pakistan’s silver rate has the simplest arithmetic of any major market, because the tola is not an awkward unit. One tola is 180 troy grains, or exactly three-eighths of a troy ounce, 11.6638 grams. One kilogram is 85.7353 tola. So import parity is a single multiplication: at a spot price of $64.44 per troy ounce and the State Bank’s mark-to-market rate of 277.2045, a tola of silver is worth PKR 6,699. The sarafa rate published the next morning was PKR 7,008.
That gap is 4.6%, and on 21 September the same calculation gave 3.1%. Call it 3% to 5%, and treat a single day’s reading with suspicion: the association rate is set once or twice a day while the international price moves continuously, so a session in which silver falls 1.7% leaves the local number looking expensive until it catches up.
There is no duty layer in that number. Under Pakistan’s Foreign Exchange Act the State Bank prohibits the export of gold and has not permitted it, while silver carries no equivalent restriction. This is the reverse of India, where silver was hit with a 15% import duty in May 2026 and then moved from the Free list to Restricted, and where the domestic premium reached 10% as a result. Pakistan’s silver wedge is a commercial markup, not a tax.
It is also wider than gold’s. On the same day, gold printed PKR 453,936 per tola against a parity of PKR 448,863, a premium of 1.1%. Silver’s is three to four times that. Silver is the smaller and thinner of the two markets in Pakistan, and thin markets charge more for the same service.
Three numbers, one metal. The sarafa association rate is a wholesale reference. A retail bill adds the jeweller’s own margin, and on an article of jewellery it adds making charges as well. Silver ornaments are commonly alloyed rather than fine, so a piece sold by weight contains less metal than its weight suggests. Every figure on this page is on the fine-silver association basis.
Silver rate prediction in Pakistan: 2026–2030
PrimeXBT’s central case puts the Pakistani silver rate near PKR 8,830 per tola by 2030, from PKR 7,008 on 24 September 2026. These are association-basis figures, so they compare to the published sarafa rate rather than to a jeweller’s bill.
| Year | Minimum | Average | Maximum | Average per 10 g | Average per kg |
|---|---|---|---|---|---|
| 2026 (Oct–Dec) | PKR 6,210 | PKR 6,920 | PKR 7,670 | PKR 5,930 | PKR 593,000 |
| 2027 | PKR 6,240 | PKR 7,410 | PKR 8,790 | PKR 6,350 | PKR 635,000 |
| 2028 | PKR 6,030 | PKR 7,930 | PKR 9,830 | PKR 6,800 | PKR 680,000 |
| 2029 | PKR 6,110 | PKR 8,370 | PKR 10,620 | PKR 7,170 | PKR 717,000 |
| 2030 | PKR 6,180 | PKR 8,830 | PKR 11,470 | PKR 7,570 | PKR 757,000 |
All figures are rupees per tola unless the column says otherwise, computed at an assumed USD/PKR of 278 for the rest of 2026 and 292 from 2027, with the dealer premium held at 4%. The 2026 and 2027 rows are derived from the monthly tables below, taking the lowest monthly minimum, the mean of the averages and the highest maximum, with 2026 covering October to December only. The bands widen with horizon and are wider than the dollar bands underneath them, because the currency adds its own uncertainty to the metal’s.
The minimum column barely moves across five years while the maximum nearly doubles. That asymmetry is deliberate. Silver’s downside is bounded by the cost of producing it; its upside is bounded by nothing, which is the whole argument for and against owning it.
Silver price prediction 2026
PrimeXBT’s base case puts the Pakistani rate near PKR 6,940 per tola by December 2026, against PKR 7,008 on 24 September. Slightly lower, in other words. The dollar anchor is $64 per troy ounce for year-end, just above J.P. Morgan’s $63 average for the quarter and far below HSBC’s $70 year-end target, because both calls pre-date the Federal Reserve’s 16 September hike and the sharp repricing of October odds that followed it.
| Month (2026) | Minimum | Average | Maximum |
|---|---|---|---|
| October | PKR 6,240 | PKR 6,890 | PKR 7,550 |
| November | PKR 6,220 | PKR 6,920 | PKR 7,610 |
| December | PKR 6,210 | PKR 6,940 | PKR 7,670 |
Rupees per tola. Two Federal Reserve meetings fall inside this window and the October one now carries a two-in-three chance of a hike, so the band reflects a binary event rather than ordinary drift.
Silver price prediction 2027
PrimeXBT’s 2027 path ends near PKR 7,520 per tola, which puts the year’s dollar average at about $65 per troy ounce. That sits between the two published bank views: J.P. Morgan projects a 2027 full-year average of $63.9 and HSBC $68. Both expect silver to average less in 2027 than in 2026, and this forecast agrees with them.
| Month (2027) | Minimum | Average | Maximum |
|---|---|---|---|
| January | PKR 6,400 | PKR 7,310 | PKR 8,210 |
| February | PKR 6,390 | PKR 7,330 | PKR 8,270 |
| March | PKR 6,370 | PKR 7,350 | PKR 8,320 |
| April | PKR 6,360 | PKR 7,360 | PKR 8,370 |
| May | PKR 6,340 | PKR 7,380 | PKR 8,420 |
| June | PKR 6,330 | PKR 7,400 | PKR 8,480 |
| July | PKR 6,310 | PKR 7,420 | PKR 8,530 |
| August | PKR 6,300 | PKR 7,440 | PKR 8,580 |
| September | PKR 6,280 | PKR 7,460 | PKR 8,630 |
| October | PKR 6,270 | PKR 7,480 | PKR 8,690 |
| November | PKR 6,250 | PKR 7,500 | PKR 8,740 |
| December | PKR 6,240 | PKR 7,520 | PKR 8,790 |
Rupees per tola. The rupee path rises while the dollar path is nearly flat, and the whole of that difference is the currency assumption doing the work.
Silver rate prediction 2028–2030
PrimeXBT’s model compounds the 2027 anchor at 5.5% a year to reach about PKR 8,830 per tola in 2030. No bank publishes a silver target at this range, so the figures rest on structural drivers rather than on anyone’s dated call, and the bands widen accordingly.
2028 is the first year in which the supply deficit has to carry the argument on its own. Metals Focus, writing for the Silver Institute in April 2026, projected a sixth consecutive annual shortfall of 46.3 million ounces, revised down from the 67 million ounces the Institute forecast in February. A deficit that shrinks by a third two months after publication is a thinner foundation than the bullish end of the market treats it as.
2029 and 2030 turn on whether industrial demand resumes growing. Silver fabrication is forecast at 639.6 million ounces in 2026, a 3% fall and the second consecutive decline, with photovoltaic use down 19% as cell makers thrift silver out of their designs. Against that, coin and bar demand is rising 18% to its highest since 2022. The 2030 figure assumes those forces roughly cancel. Break either and the range, not the midpoint, is the answer.
Silver long-term forecast: 2035 and 2040
Past 2030 a silver forecast is compounding rather than analysis. No institution publishes a 2040 silver target, and the honest form of the answer is a wide band around a modest growth rate, here 4.5% a year.
| Year | Minimum | Central case | Maximum | Central case per 10 g | Central case per kg |
|---|---|---|---|---|---|
| 2035 | PKR 6,270 | PKR 11,000 | PKR 15,730 | PKR 9,430 | PKR 943,000 |
| 2040 | PKR 6,440 | PKR 13,710 | PKR 20,970 | PKR 11,750 | PKR 1,175,000 |
Rupees per tola unless the column says otherwise. The minimum column is not an error. Silver set a nominal high of $49.95 per troy ounce in January 1980 and then went forty-five years without beating it, and that 1980 peak is worth roughly $194 in 2026 money, so the metal is still far below its record in purchasing power. A fourteen-year forecast that cannot accommodate a flat decade has not been built honestly.
What analysts expect
| Source | Target | Horizon | Date of call | Change |
|---|---|---|---|---|
| J.P. Morgan | $63 per troy ounce | Q4 2026 average | 13 August 2026 | — |
| J.P. Morgan | $63.9 per troy ounce | 2027 full-year average | 13 August 2026 | — |
| HSBC (James Steel) | $70 per troy ounce | Year-end 2026 | 17 May 2026 | 2026 average raised to $75 from $68.25 |
| HSBC (James Steel) | $65 per troy ounce | Year-end 2027 | 17 May 2026 | 2027 average raised to $68 from $57 |
| LBMA Forecast Survey, 30 analysts | $80.36 average, range $42 to $165 | 2026 full-year average | 20 January 2026 | — |
Read the LBMA row with its date attached. It was published on 20 January 2026, nine days before silver peaked, and it forecasts an average for the whole calendar year rather than a level on any date within it. Silver spent the first quarter far above $80 and the third far below, so the panel may land close on the annual average while saying nothing useful about today. The $42 to $165 spread, from Bart Melek at TD Securities to Ross Norman at Metals Daily, is the informative half of that row.
The two banks agree on the mechanism and differ on the timing. J.P. Morgan expects the gold-silver ratio to widen toward 70 in the second half of 2026 and about 75 in 2027 as central banks turn hawkish, and flags a possible 30% fall in photovoltaic demand. HSBC’s Steel makes the same point in fewer words, warning that the ratio is likely to widen and let silver ease even if gold rallies. Neither house publishes a bullish counterweight, and this page does not invent one.
Track record
This is the first PrimeXBT silver forecast for Pakistan, so there is no prior review to mark. Every monthly update from here will set the previous figures against what silver actually did, including the misses.
Technical picture
Silver fell below $64.00 per troy ounce on 24 September 2026, closing near $63.34 after a 1.7% session, and is now sitting on its 50-day simple moving average at $63.45. It lost its 100-day average at $66.20 earlier in the week. Both of the averages that mattered through the summer are now overhead.
The levels below are narrow and well-defined. First support is the 50-day itself at $63.45, then $62.30, the low from both 14 and 16 September and the floor of the three-week range, then $61.01 from 23 March and the round $60.00. On the resistance side, $64.00 has flipped from support, then the 100-day at $66.20, $67.55 from 22 September, $68.00 where the range has capped for three weeks, and $71.12 to $71.56 from the late-August and mid-June highs. RSI was below its neutral line and falling at the time of writing.
These are spot XAG/USD levels, not COMEX futures and not the sarafa rate. Converting them to rupees is a separate calculation with its own exchange-rate assumption, which is why this section stays in dollars. The live silver chart carries the current picture.
What silver moves with
Silver’s strongest relationship is with gold, and for a Pakistani buyer the second strongest is with the rupee. Neither is fixed. The gold-silver ratio stood at 64.7 on 23 September 2026 against a mean of 60.5 since 1971, having travelled between 46.3 and 85.1 inside the past 52 weeks. A relationship that moves by that much in a year is a trade, not an anchor.
Against real interest rates the link runs inverse, and it has done most of the damage this year. Silver pays nothing to hold, so a rising real yield raises the cost of holding it, which is exactly what a hiking Federal Reserve delivers. The dollar index works the same way and less reliably. What separates silver from gold is the industrial leg: roughly two-thirds of annual demand is fabrication, so a manufacturing slowdown hits silver in a way it never hits gold, and silver is a poorer diversifier than its monetary half suggests.
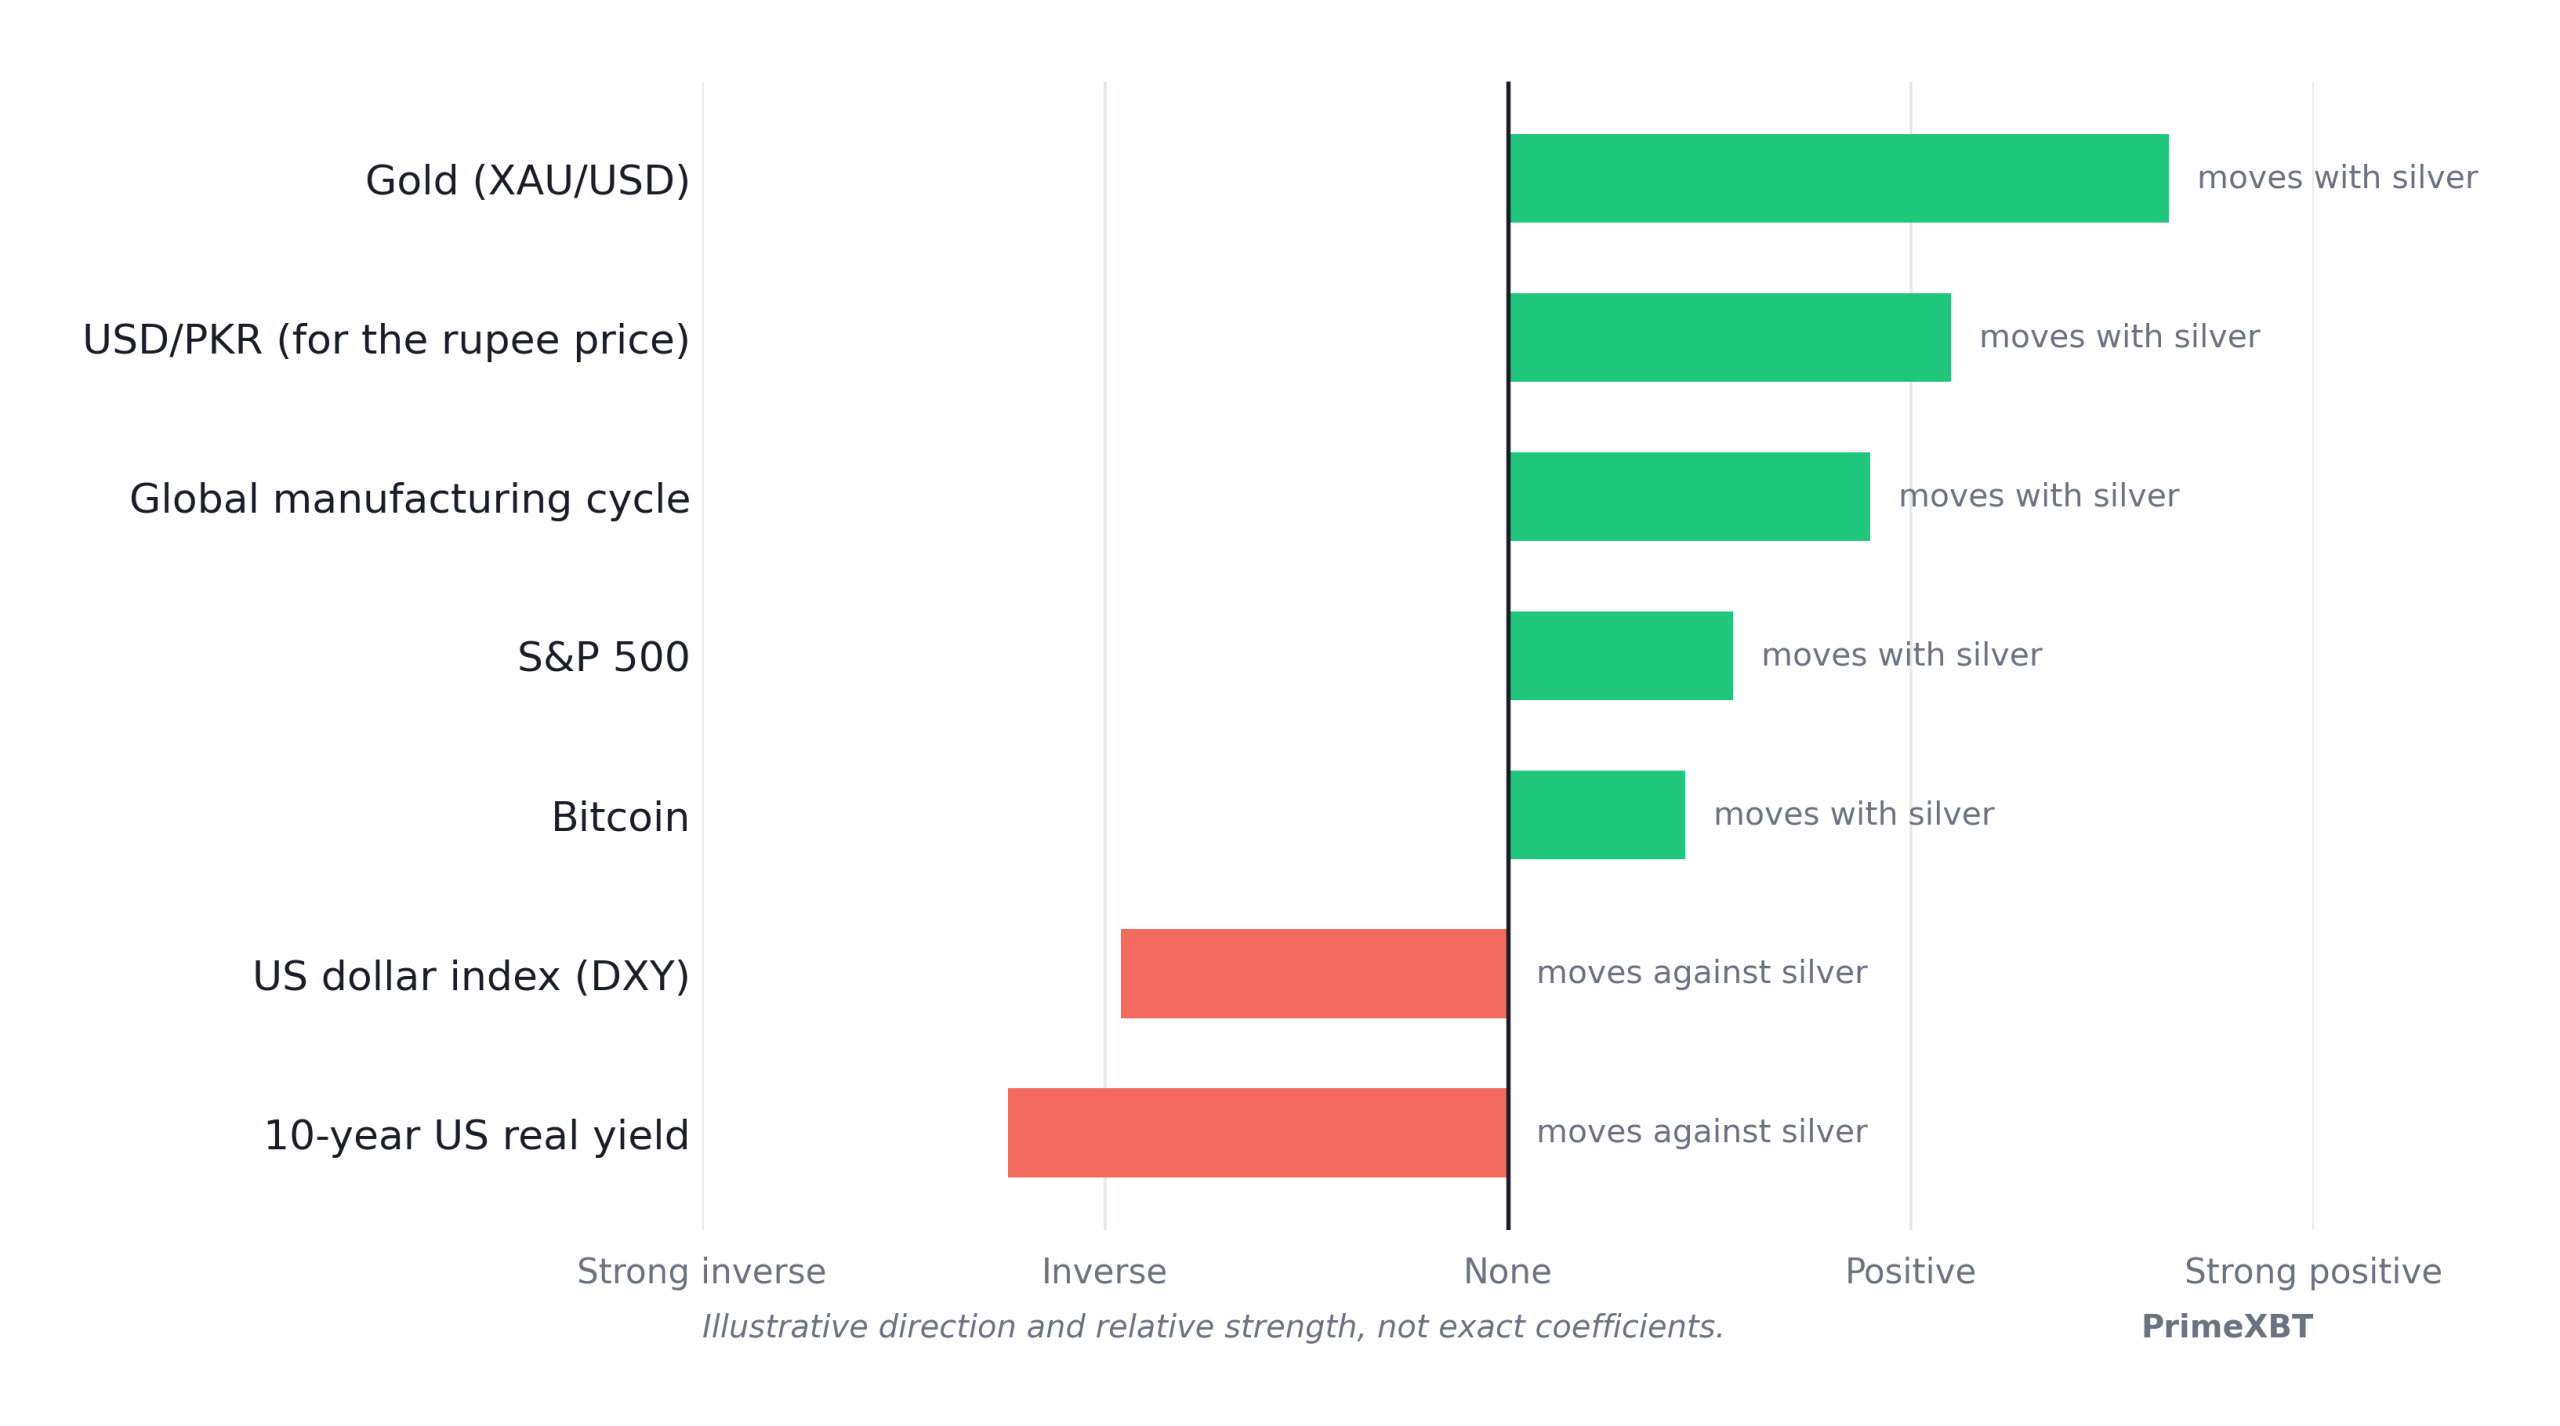
Treat the bars as directions with rough magnitudes rather than measured coefficients. Each of these relationships has broken down at some point in the last decade.
What drives the silver price
Supply and demand, and the gap between them. Metals Focus projected a 46.3 million ounce deficit for 2026 in the World Silver Survey published on 15 April, the sixth consecutive shortfall, with mine supply broadly flat and recycling at multi-year highs. The Silver Institute’s February forecast had put the same deficit at 67 million ounces. The direction is unchanged and the magnitude is shrinking.
Industry, the half of silver that gold does not have. Fabrication demand is forecast at 639.6 million ounces in 2026, down 3% and falling for a second year. Photovoltaics, the sector that carried the bull case for five years, is expected down 19% as cell makers cut silver loadings and substitute where they can. High prices caused that thrifting, which makes it the least likely part of the demand picture to reverse quickly.
Investment, which is doing the offsetting. Coin and bar demand is rising 18% in 2026 to its highest level since 2022. In Pakistan that shift has a documented local shape: Al Jazeera reported on 5 February 2026 that record gold prices were pushing buyers toward chandi, with jewellers in Lahore, Karachi and Islamabad describing customers who could no longer afford gold and families moving away from passing jewellery down.
The rupee, which sets how much of any of this a Pakistani buyer feels. The local rate is the international price times a fixed unit conversion times the exchange rate times a dealer premium. Three of those four move. Silver in dollars is down 48% from its January peak; silver in rupees per 10 grams is down about 23% since early February. The difference is the currency.
Catalysts to watch
| Date | Event | Why it matters |
|---|---|---|
| 27–28 October 2026 | FOMC meeting | No projections; currently priced at about a 70% chance of a hike |
| 8–9 December 2026 | FOMC meeting | Carries the Summary of Economic Projections |
| 26–27 January 2027 | FOMC meeting | First meeting of 2027 |
| January 2027 | LBMA Forecast Survey | Next published analyst panel; date not yet confirmed |
| 16–17 March 2027 | FOMC meeting | Carries the Summary of Economic Projections |
| April 2027 | World Silver Survey | Next full supply and demand balance; date not yet confirmed |
Only confirmed, dated events are listed. FOMC dates follow the Federal Reserve’s published calendar, and the economic calendar carries the releases between them.
Bull case and bear case
The bull case: the deficit runs a sixth straight year and draws down above-ground stock; coin and bar demand grows 18% in 2026 while Pakistani buyers priced out of gold keep moving into silver; the gold-silver ratio at 64.7 sits above its long-run mean and reached 46.3 inside the past year; and silver is down 48% from January with industrial substitution already priced in. The bull case weakens if silver closes below $62.30 per troy ounce.
The bear case: October hike odds have doubled to nearly 70% in a week and the Fed’s own projections imply no cuts in 2027, which raises the cost of holding a metal that pays nothing; industrial demand is falling for a second year and photovoltaic use is down 19%; the 2026 deficit has already been revised from 67 to 46.3 million ounces; and both 50-day and 100-day averages are now resistance rather than support. The bear case is invalidated on a sustained close above $68.00.
Will silver rates fall in Pakistan in 2026?
In dollars they already have. Silver peaked at $121.62 per troy ounce on 29 January 2026 and trades near $63 in late September, a fall of about 48% in eight months. In rupees the drop is smaller, roughly 23% per 10 grams since early February, because the currency assumption and the dealer premium are multipliers that do not fall with the metal.
The question worth asking is whether the fall is over, and the published evidence does not settle it. J.P. Morgan’s Q4 average of $63 sits at the current price and HSBC’s year-end $70 sits above it, which means two serious houses disagree by 11% on a horizon of three months.
History makes the drawdown less remarkable than the headline suggests. Silver reached $49.95 in January 1980 and then spent forty-five years without a new nominal high, the longest such stretch of any major commodity. Falls of 30% or more have happened repeatedly inside bull markets and have also opened decade-long declines, and there is no reliable way to tell the two apart while one is happening. A correction and the start of a bear market look identical for months.
How silver has performed
Silver broke $50 per troy ounce in October 2025, clearing a level that had held since January 1980, then ran to $121.62 by 29 January 2026 before giving back close to half. Even after that fall it is up about 40% for the year to date. In nominal terms the 2025-26 advance was the largest in the metal’s modern history.
In real terms it was not. Adjusted for inflation the 1980 peak is worth roughly $194 in 2026 money, so silver’s record in purchasing power has stood unbroken for forty-six years. Silver pays no dividend and no coupon, costs money to store and insure, and has returned approximately nothing in real terms across its most-cited peak-to-peak window. What it delivers is volatility, in both directions, on a scale gold does not approach. That is the case for trading it and the case against holding it, and they are the same fact.
Is silver a good investment in Pakistan in 2026?
That depends on the form more than on the metal, and in Pakistan the forms differ sharply.
Physical bars and coins carry the 3% to 5% dealer premium on the way in and a spread on the way out, plus storage and the risk of holding metal at home. The premium is not refunded when you sell.
Jewellery and ornaments add making charges that are rarely recovered on resale, and are usually alloyed rather than fine, so the metal content is below the weight on the tag. Comparing an association rate to an ornament price understates the gap.
Silver CFDs track the international price in dollars, allow positions in either direction, and carry leverage and overnight financing. They are a short-to-medium-horizon instrument and give no ownership of metal.
Tax treatment of gains differs by holding form and holding period, and this page states no rates. Check the current provisions before choosing between these. What the comparison does settle is that the physical premium and the making charge are known costs paid on day one, while the forecast above is a range.
How to trade silver on PrimeXBT
Silver is available as a CFD under the symbol XAG/USD, quoted in US dollars per troy ounce. A CFD settles the difference between the opening and closing price, so a long and a short are equally available whatever any forecast says.
Commodity CFDs have a daily trading break and gap across it, so an overnight position can open away from where it closed. Spreads widen outside the main session and around scheduled data. Overnight positions accrue financing, which compounds against anyone holding for months. Silver’s daily range is wider than gold’s, so the same nominal size carries more risk and a stop-loss set at gold-like distances will be hit more often. Leverage magnifies gains and losses alike, and you should never risk more than you can afford to lose.
Current spreads and financing rates are listed under fees and conditions. The full commodity CFD range and its live charts sit alongside gold, and readers weighing the two metals can compare this page with the gold rate forecast and with our guide to investing in gold in Pakistan.
Trading involves risk.
How we build this forecast
PrimeXBT anchors the dollar leg of this forecast on published analyst targets with stated horizons, then compounds beyond the last published target at 5.5% a year to 2030 and 4.5% after it. The rupee leg is not a conversion of the dollar leg. It is built from the domestic identity: the international price per troy ounce, times 0.375 ounces per tola, times an assumed USD/PKR of 278 for 2026 and 292 from 2027, times a dealer premium of 4%. That premium is the midpoint of two readings, 3.1% on 21 September and 4.6% on 24 September, and it is noisy because the association rate is set once a day while the metal trades around the clock. Monthly rows are interpolated between anchors; the 2026 and 2027 yearly rows are derived arithmetically from them. Bands widen with horizon and are wider in rupees than in dollars. This is a forecast, not a prediction. It will be wrong in detail, and it is reviewed monthly.
What will the silver rate be in Pakistan in 2030?
About PKR 8,830 per tola in PrimeXBT's central case, in a range of roughly PKR 6,180 to PKR 11,470. That is about PKR 7,570 per 10 grams, or PKR 757,000 per kilogram.
What is the silver rate prediction for 2026 and 2027?
Close to flat, then mildly higher. The central case is PKR 6,940 per tola in December 2026 and PKR 7,520 in December 2027, against PKR 7,008 on 24 September 2026. Both published bank forecasts expect silver to average less in dollars in 2027 than in 2026.
Can silver reach PKR 10,000 per tola?
It needs silver near $88 per troy ounce internationally at an exchange rate of 292 and the current dealer premium. That is well below the all-time high of $121.62 set on 29 January 2026, so it is not a stretch target. It falls inside the upper band for 2030 and close to the central case for 2035.
Will the silver rate increase or decrease?
Over the next 15 months the published evidence points sideways to slightly lower in dollars. J.P. Morgan put the Q4 2026 average at $63 per troy ounce and the 2027 average at $63.9, both at or below the current price. In rupees the path is flatter, because the exchange rate assumption and the dealer premium are multipliers that do not fall with the metal.
What will 1 kg of silver cost in Pakistan?
One kilogram is 85.7353 tola. At the 2026 central case that is about PKR 593,000, rising to roughly PKR 757,000 in 2030 and PKR 1,175,000 in 2040. Today's rate of PKR 7,008 per tola works out at about PKR 601,000 per kilogram.
Why is silver in Pakistan more expensive than the international price?
A dealer premium of roughly 3% to 5% over import parity. There is no duty layer: under the Foreign Exchange Act the State Bank restricts gold and not silver. The premium on silver is three to four times the 1.1% carried by gold, because silver is the thinner of the two local markets.
Is silver a good investment in Pakistan in 2026?
That depends on the form more than on the metal. Bars and coins carry the dealer premium on the way in and a spread on the way out; ornaments add making charges and are usually alloyed rather than fine; CFDs track the dollar price with leverage and financing and give no ownership of metal. None of them pays income.
What will the silver rate be tomorrow?
This page does not answer that. It runs on a monthly cycle and forecasts monthly averages, not daily closes. Anyone publishing a next-day silver rate is guessing.
Author



 Risk Disclaimer
The content provided here is for informational purposes only. It is not intended as personal investment advice and does not constitute a solicitation or invitation to engage in any financial transactions, investments, or related activities. Past performance is not a reliable indicator of future results.
The financial products offered by the Company are complex and come with a high risk of losing money rapidly due to leverage. These products may not be suitable for all investors. Before engaging, you should consider whether you understand how these leveraged products work and whether you can afford the high risk of losing your money.
The Company does not accept clients from the Restricted Jurisdictions as indicated in our website/ T&C. Some services or products may not be available in your jurisdiction.
The applicable legal entity and its respective products and services depend on the client’s country of residence and the entity with which the client has established a contractual relationship during registration.