7 min read
 Key takeaways
- The S&P 500 gapped lower on Monday’s open after a sharp weekend escalation in the Middle East conflict, with the US and Iran exchanging strikes and the Strait of Hormuz back in dispute.
- June CPI lands on Tuesday, the last major inflation print before the Fed’s 28 to 29 July meeting. Headline is expected to cool sharply to around 3.8%, but almost entirely on energy, with core inflation still sticky.
- Despite the gap, price never broke below the daily 20 EMA, and buyers have stepped in to defend the 7,520 to 7,540 area. The whipsaw effect of each new escalation appears to be fading.
- Key levels to watch: 7,520 to 7,540 as the defended support area, the 4H range between 7,530 and 7,580 with equilibrium at 7,555, and the all-time high at 7,621.60 above.
The rally runs into a wall
The S&P 500 closed last week up 1.2%, pressing back toward its record high as investors looked through the Middle East conflict and leaned back into technology. That position was tested over the weekend.
On Friday, President Trump described the June memorandum that paused hostilities with Iran as “over.” What followed was one of the sharpest escalations since the ceasefire was signed. Iran reportedly struck a commercial container ship and declared the Strait of Hormuz closed. US Central Command responded with successive waves of strikes, hitting around 140 Iranian military targets on Saturday night and returning early on Monday with attacks aimed at degrading Iran’s ability to threaten shipping. Iran retaliated against US Gulf allies, firing projectiles at Kuwait, Qatar and the UAE, the first time the UAE has been targeted in two months.
The two sides do not even agree on the basic facts. Washington maintains that traffic through the strait is still flowing, while Tehran insists the waterway is closed. Oman-mediated talks on safe navigation appear to have faltered, though both sides have left the door open to further discussions. UN estimates put the number of seafarers still stuck in the waterway at around 6,000.
For equities, the transmission channel is familiar by now. Escalation around Hormuz threatens energy supply, higher energy prices feed back into inflation, and that hardens the Fed’s higher-for-longer stance under Chair Kevin Warsh. The index opened Monday with a gap to the downside as a result.
The timing could hardly be worse
That threat arrives in the middle of one of the heaviest weeks of the quarter.
June CPI is released on Tuesday, the last major inflation reading before the FOMC meets on 28 to 29 July. Headline inflation is expected to cool sharply, to roughly 3.8% from May’s 4.2%, which was the highest reading since April 2023. But the improvement is expected to come almost entirely from an energy correction, with core inflation still grinding higher at around 0.3% on the month.
In other words, the headline could look reassuring while the underlying trend does not. And if strikes on shipping lanes push energy prices back up, the very thing that is expected to flatter Tuesday’s print could reverse in the months ahead.
Markets are not positioned for relief. Rates are held at 3.50 to 3.75%, and traders are pricing a quarter-point hike as soon as September rather than a cut. Warsh delivers his first Congressional testimony as Fed Chair from Tuesday, giving him a platform to reinforce or soften that stance.
The rest of the calendar is dense too. PPI follows on Wednesday and retail sales on Thursday, while Q2 earnings season opens with the major banks on Tuesday, ASML on Wednesday, and TSMC and Netflix on Thursday. With the semiconductor complex having driven much of the recent recovery, those chip updates carry particular weight.
S&P 500 daily chart
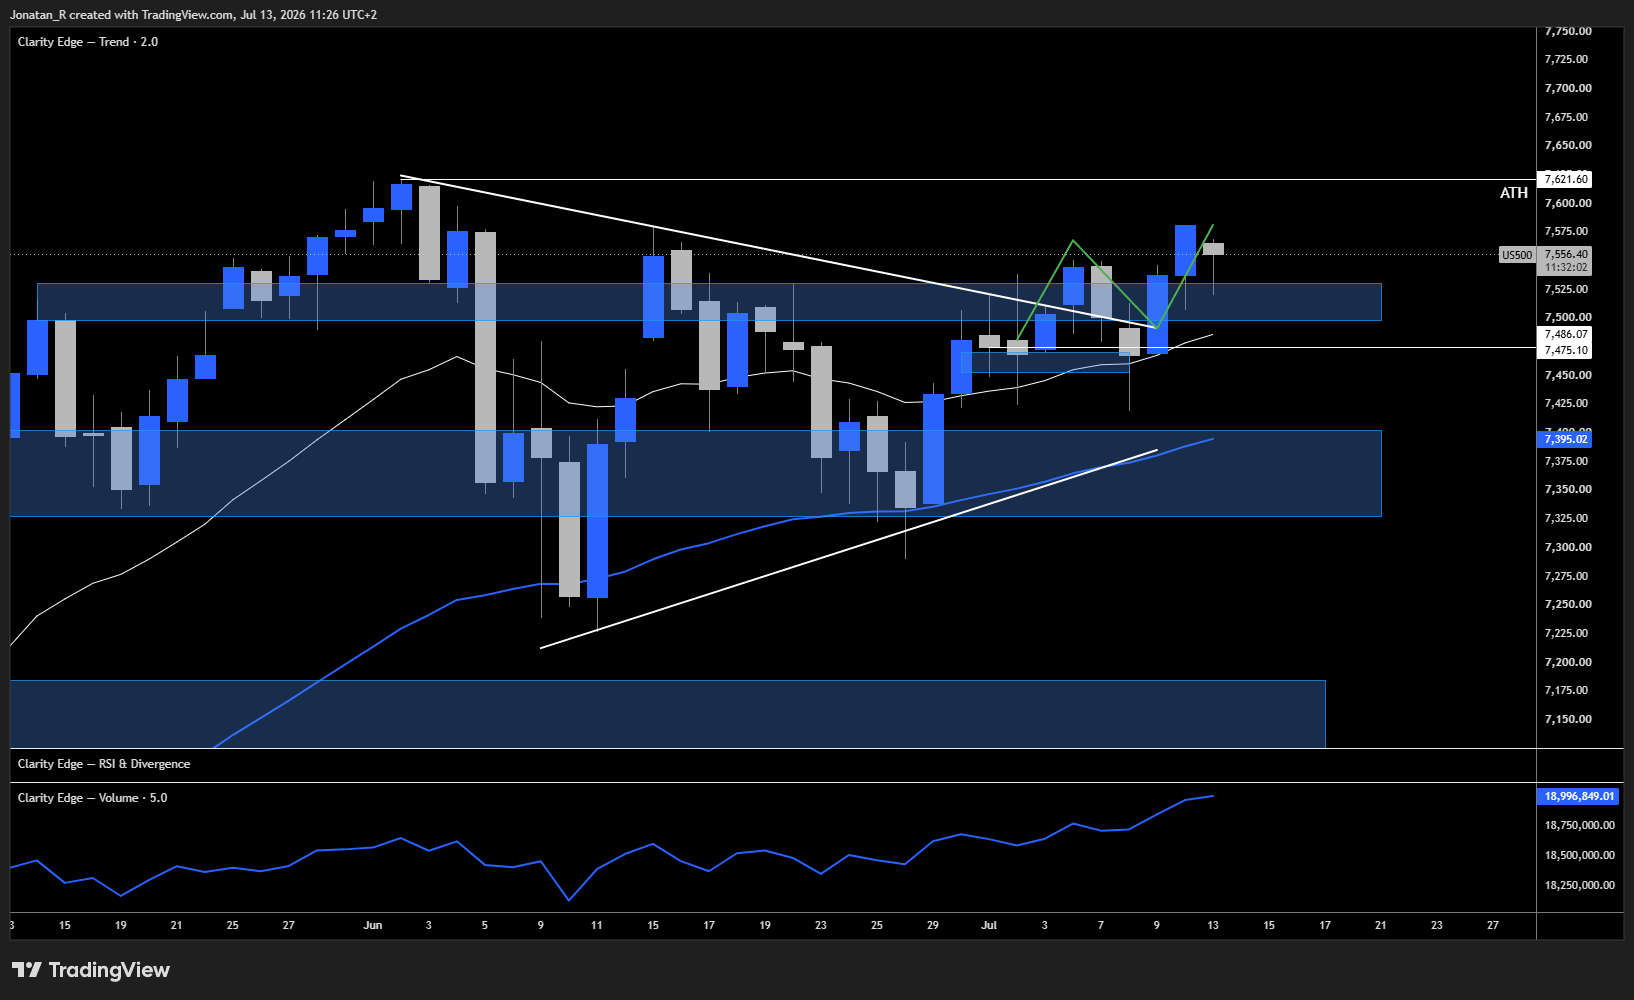
In our previous coverage we highlighted the symmetrical triangle that had been forming on the daily. That triangle has now broken out, and we saw the break and retest of the upper descending trendline hold.
We’re also seeing the accumulation/distribution indicator breaking out into a new uptrend alongside price, which tells us buyers have been in control through the move.
Importantly, price never broke below the daily 20 EMA, even with the gap to the downside following the weekend escalation in the Middle East. Buyers are stepping in and defending the 7,500 area, specifically between 7,520 and 7,540.
The whipsaw effects of this situation in the Middle East seem to be causing less and less volatility with each new headline. With June CPI coming up on Tuesday, the market could potentially range here while it waits for the next real catalyst. That print is the one that could potentially take the S&P 500 up toward the all-time high at 7,621.60.
S&P 500 4H chart
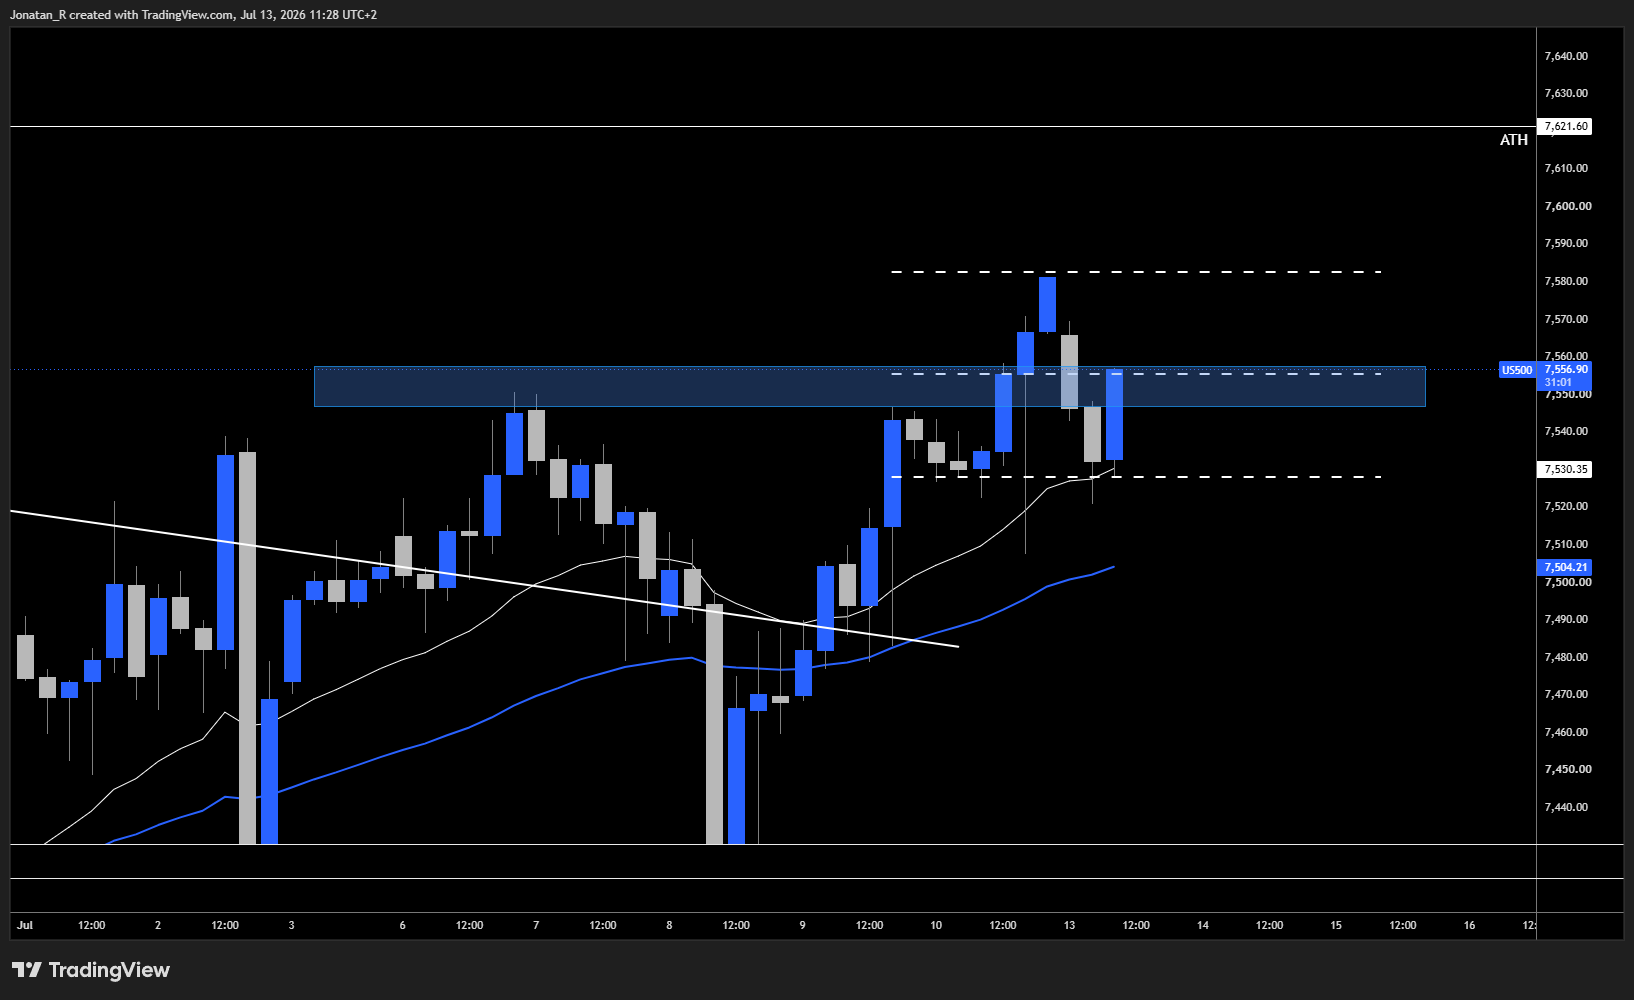
On the 4H, price is holding the 4H 20 EMA nicely.
We have a potential range forming here, with the range lows around 7,530, the range highs around 7,580, and range equilibrium around 7,555. There’s a very strong 4H candle printing at the time of writing.
A reclaim of that range equilibrium area could potentially take us higher toward the range highs, and potentially on toward the all-time high region above.
Trading involves risk.
Author



 Risk Disclaimer
The content provided here is for informational purposes only. It is not intended as personal investment advice and does not constitute a solicitation or invitation to engage in any financial transactions, investments, or related activities. Past performance is not a reliable indicator of future results.
The financial products offered by the Company are complex and come with a high risk of losing money rapidly due to leverage. These products may not be suitable for all investors. Before engaging, you should consider whether you understand how these leveraged products work and whether you can afford the high risk of losing your money.
The Company does not accept clients from the Restricted Jurisdictions as indicated in our website/ T&C. Some services or products may not be available in your jurisdiction.
The applicable legal entity and its respective products and services depend on the client’s country of residence and the entity with which the client has established a contractual relationship during registration.