7 min read
 Stocks shrug off a 24-year yield high
Last week tested risk appetite from three sides, and stocks absorbed them. September payrolls showed just 29,000 new jobs against roughly 90,000 expected, cooling bets on an October hike after the Fed moved to 3.75% to 4.00% on September 16. On October 8, Trump pledged no strikes on Iran before the November 3 midterms, citing “productive discussions” with Tehran. A day later he announced a deal with Putin to bring Russian diesel to US and global markets, a sharp reversal of sanctions policy. The S&P 500 set its first record close since August on October 6 and ended the week at 7,811.54, up about 1.2%.
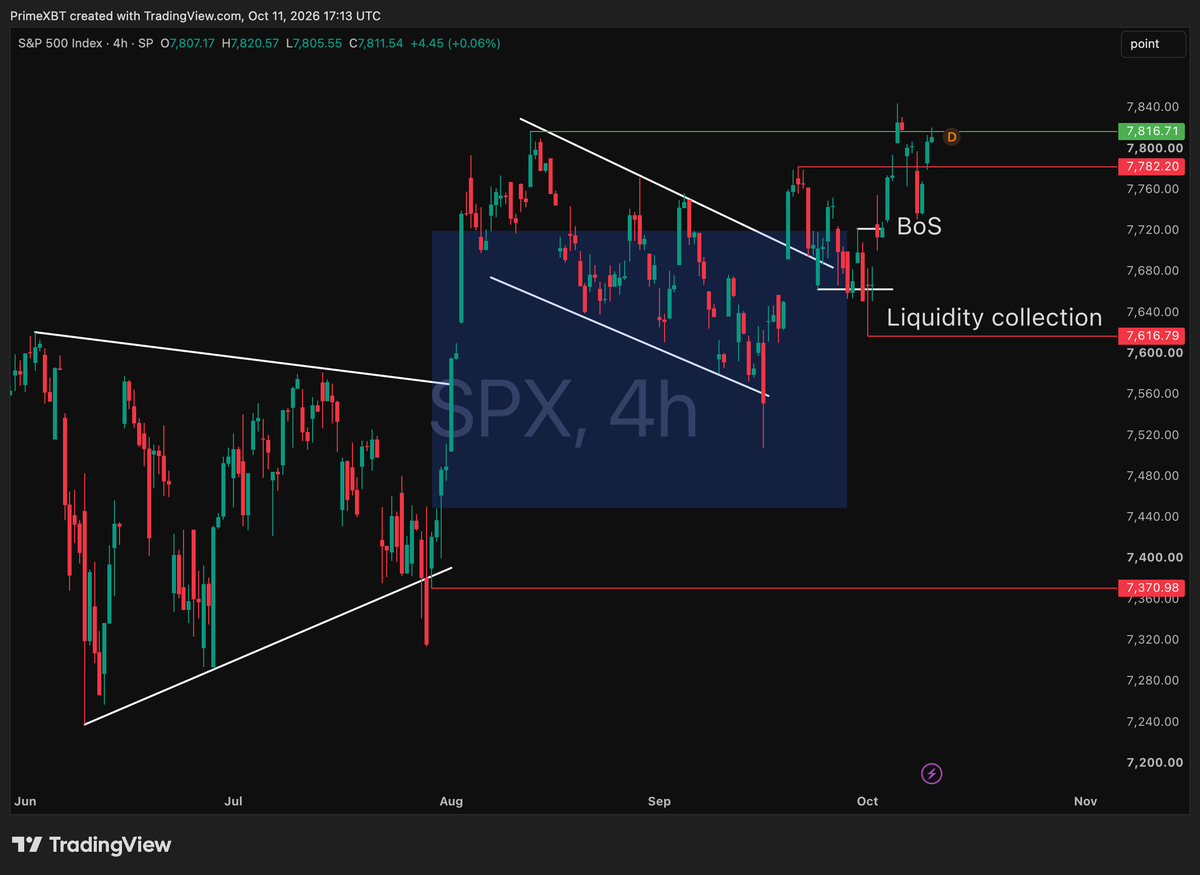
On the 4h chart, the S&P 500 broke above the September high at 7,782.20 and retested it. The midweek dip to about 7,735 was bought back above the level, so former resistance now acts as support. A sustained move above the August high at 7,816.71 would keep records in play, while a 4h close below 7,782.20 would reopen the path toward the liquidity low at 7,616.79.
The 10-year yield rejects the top of its range
The 10-year yield touched nearly 5.37% on October 7, its highest since 2002, as energy-driven inflation worries met hawkish FOMC minutes: most officials judged another hike would probably be appropriate by year-end. Selling then faded after a solid 30-year auction, which cleared at 5.618% with a 2.54 bid-to-cover, and Trump’s Iran pledge pulled oil lower.
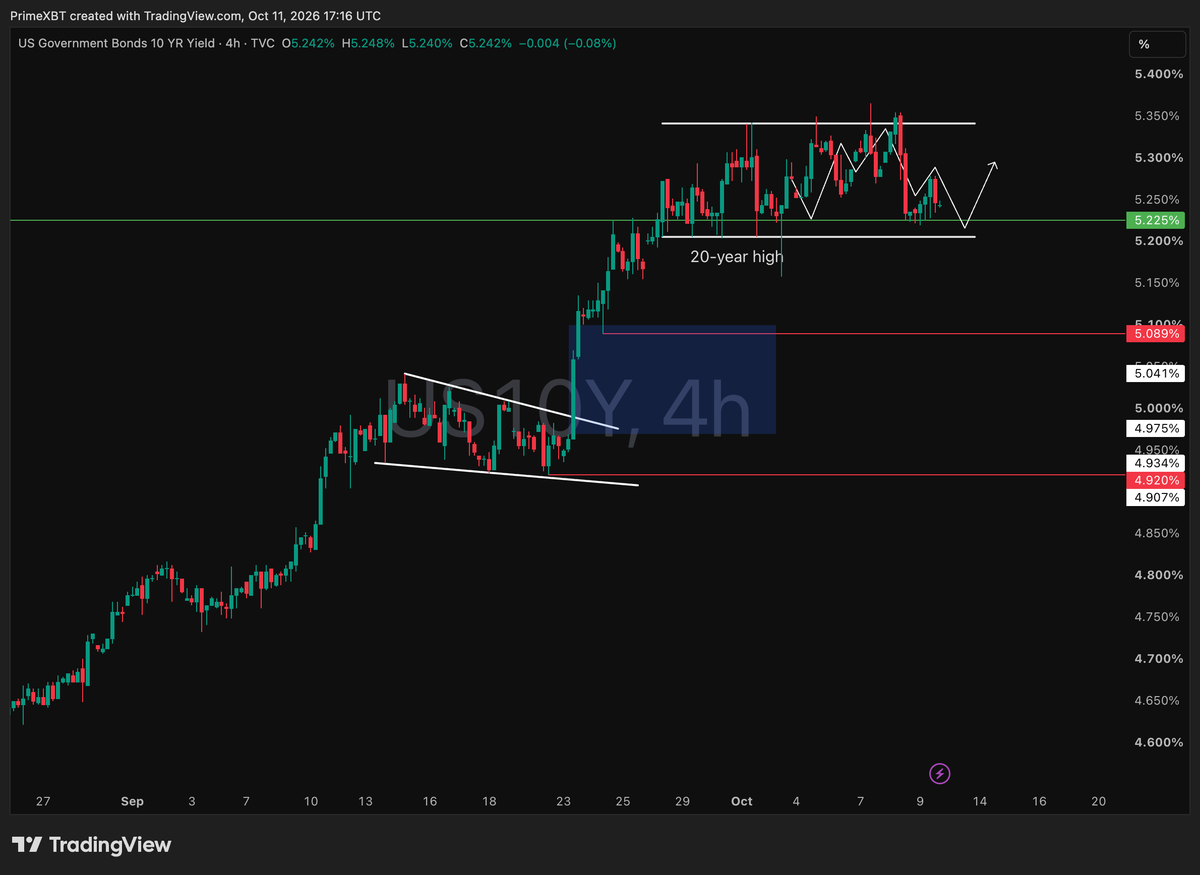
The move played out as outlined a week ago. The yield rejected the top of the white range near 5.34% and slid back toward the 5.225% support, letting equities push higher and giving risk assets a breather. A 4h close above 5.34% would put the high back in focus, while a break below 5.20% would open the imbalance zone toward 5.089%. US bond markets are shut on Monday for Columbus Day.
WTI recovers after a dip below $88.72
Crude was pulled between supply relief and war risk. A G7 plan to release 100 million barrels of emergency reserves pushed WTI toward $87 early in the week. Prices rebounded midweek on Gulf escalation fears, then eased after Trump’s Iran pledge and the diesel deal. WTI ended near $91.67, little changed from the prior Friday’s $91.11 settlement.
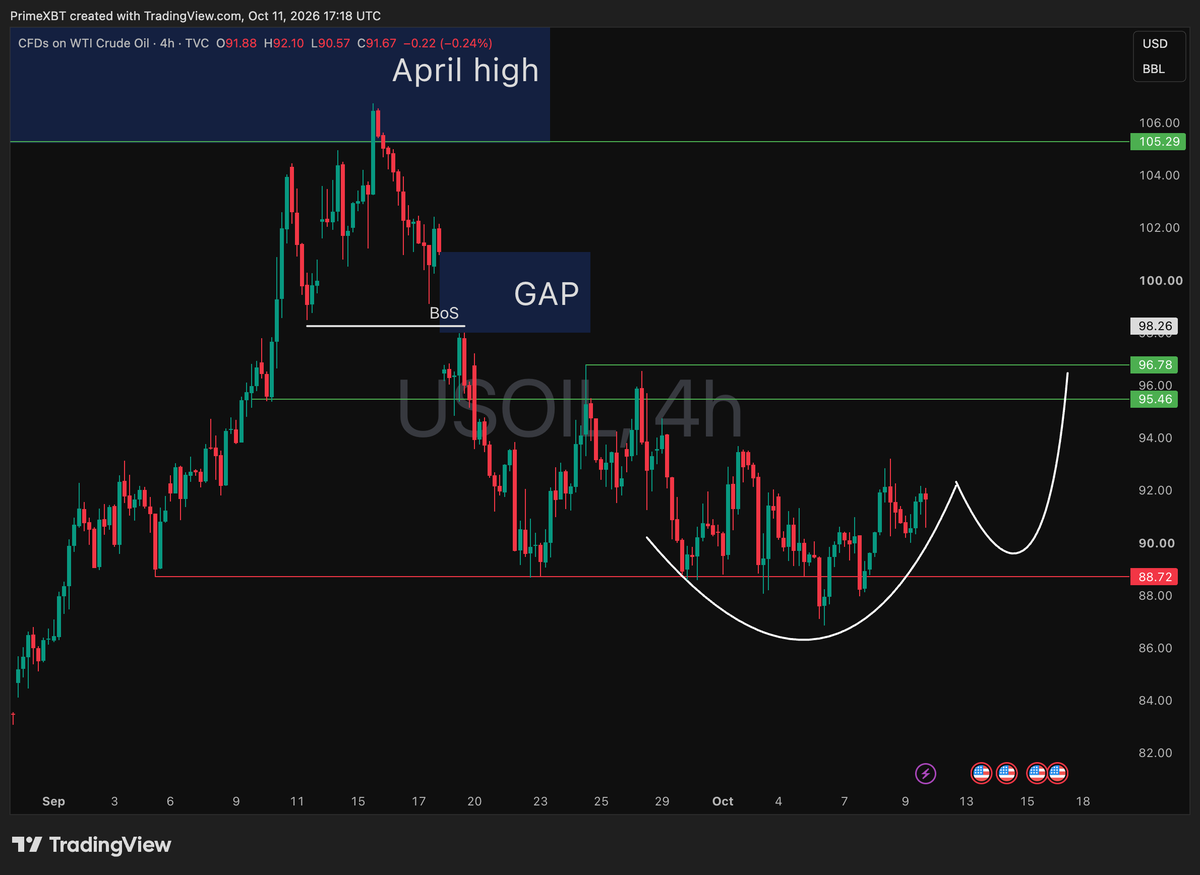
On the 4h chart, WTI crude briefly broke below 88.72 on October 6 but reclaimed it within a day, forming the base of a potential cup and handle. If a shallow handle holds above 88.72, the pattern opens the path toward 95.46 and 96.78. A 4h close back below 88.72 would invalidate the setup.
US CPI m/m (Wednesday)
September CPI is due on Wednesday, October 14, at 12:30 GMT. Consensus sees headline CPI at 0.6% m/m and 3.7% y/y, up from 0.4% and 3.4% in August, driven mostly by energy. Core is expected at 0.2% m/m and 2.5% y/y, after 0.3% and 2.4%. FedWatch prices about an 80% chance of a hold on October 28 and roughly 70% odds of a December hike. A hot core print would revive October hike bets and support the dollar.
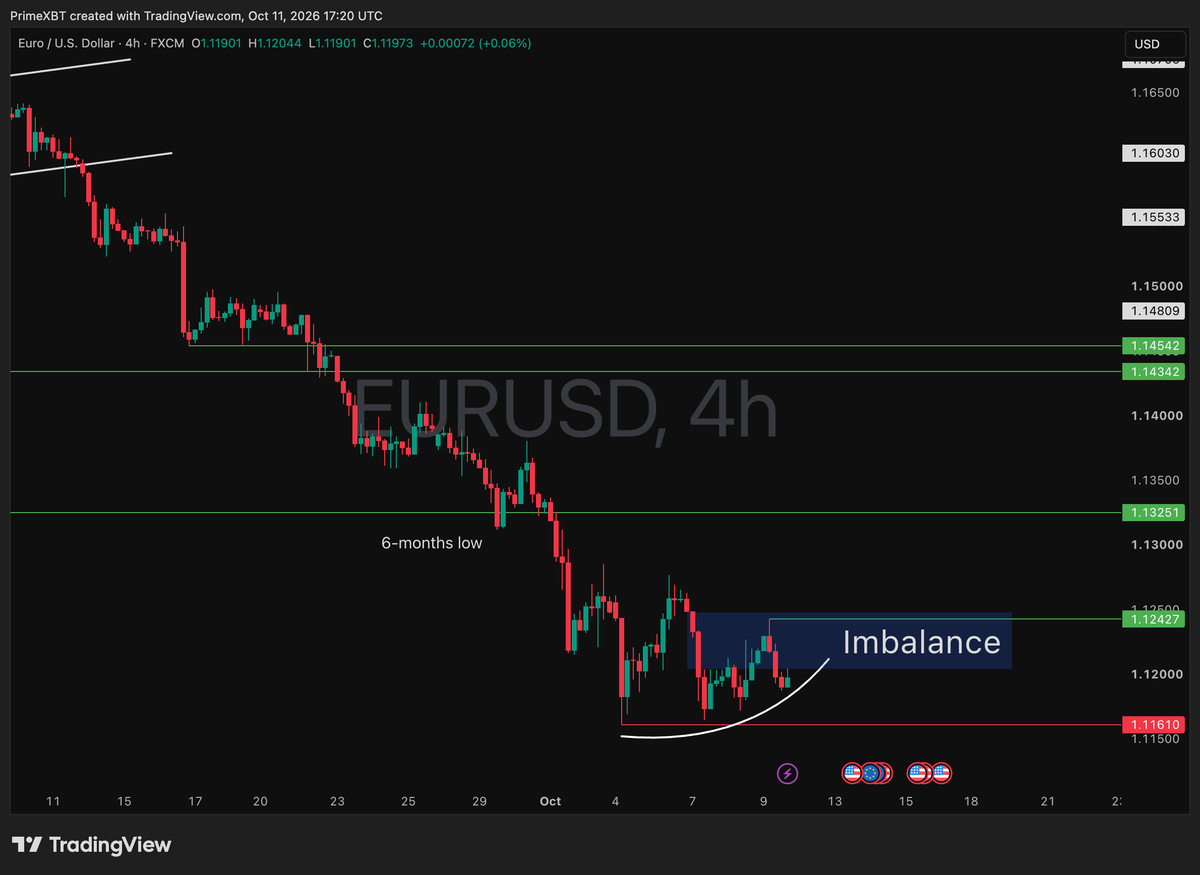
The dollar has already benefited from that backdrop. EUR/USD touched 1.1161 on October 5, its weakest since May 2025, as French debt stress added pressure. On the 4h chart, the pair sits below an imbalance zone capped at 1.12427, with liquidity resting under 1.1161. While 1.12427 holds, a hot CPI could extend the slide through that liquidity. A clean break above 1.12427 would neutralize the bearish setup.
Australia Unemployment Rate (Thursday)
Australia’s September jobs report lands on Thursday, October 15, at 00:30 GMT. August unemployment rose to 4.6%, the highest since late 2021, even as employment grew by 39,500. Westpac expects 4.6% again with 20,000 new jobs. The RBA lifted the cash rate to 4.60% in September, its fourth hike this year, and wants more slack in the labour market. A rise to 4.7% would weaken the case for further tightening.
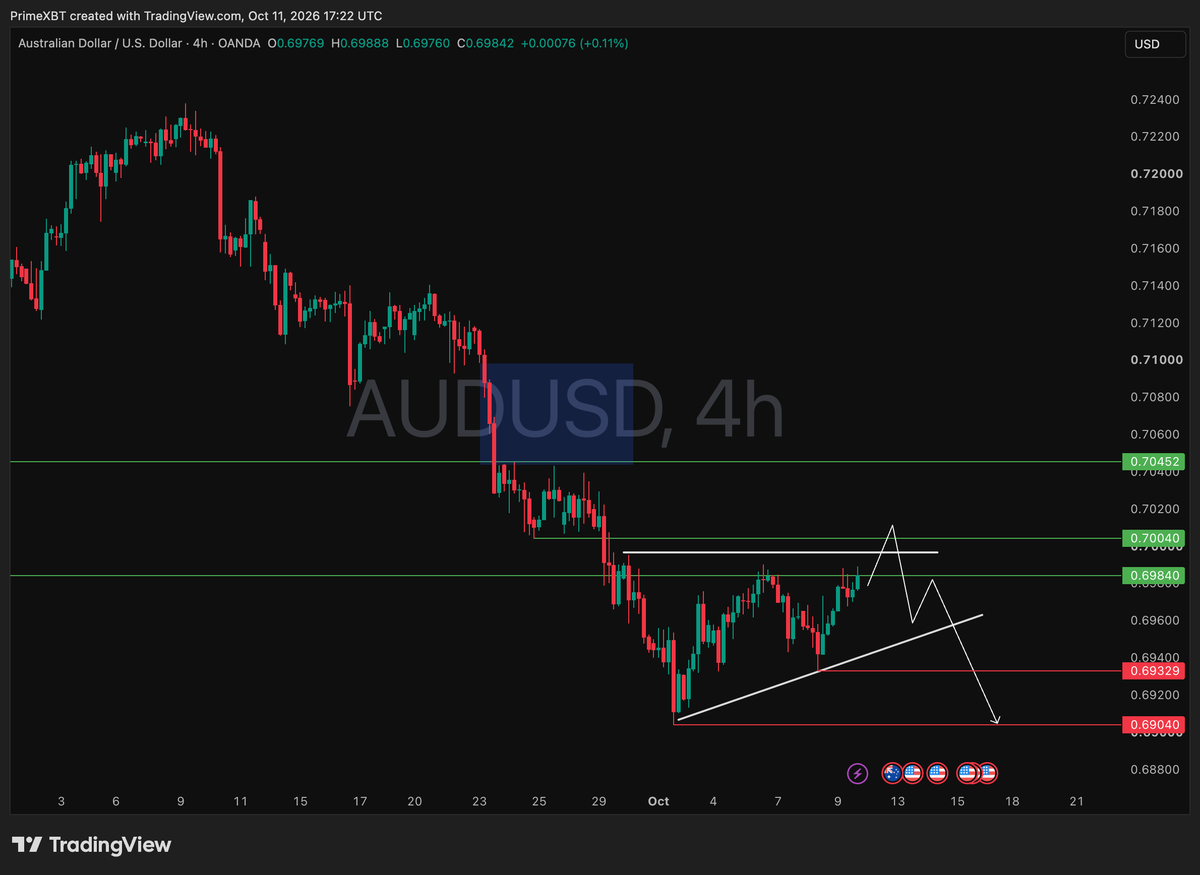
On the 4h chart, AUD/USD has built an ascending triangle with a flat top just under 0.7000. The pattern reads bullish, but inside a downtrend it often fails. If the Aussie spikes above 0.70040, meets selling and drops back inside the triangle, a trendline break would open the path toward 0.69329 and 0.69040. A firm hold above 0.70040 would shift focus to 0.70452 instead.
BoE Governor Bailey speaks (Friday)
Andrew Bailey speaks at the Institute of International Finance meeting in Bangkok on Friday, October 16, at 02:00 GMT. The Bank of England held Bank Rate at 3.75% in September, with three of nine members voting for 4%. UK CPI reached 3.1% in August, and Bailey warned in late September that high energy prices make holding rates harder. Markets will listen for any lean toward a hike on November 5.
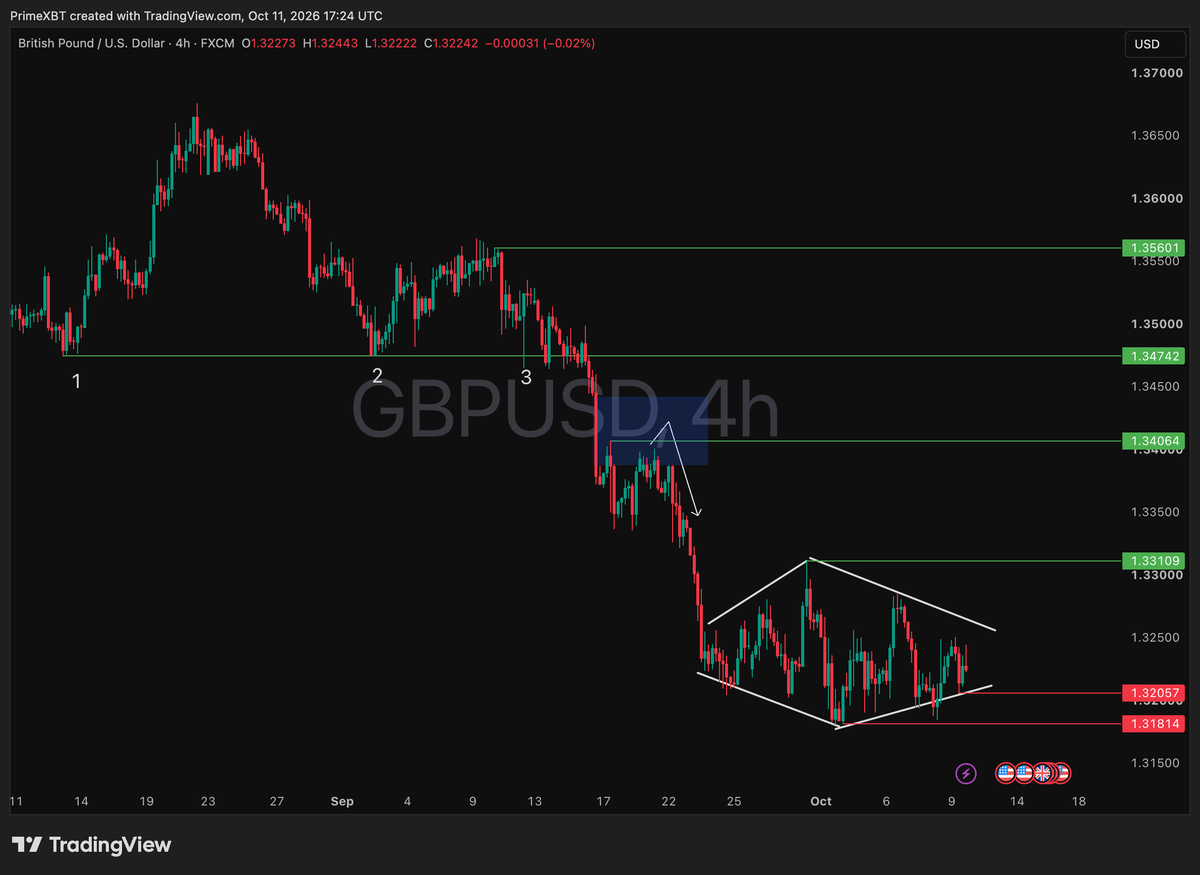
On the 4h chart, GBP/USD is chopping inside a contracting range between 1.33109 and 1.31814. There is no clean pattern, so the levels do the work. A 4h close above 1.33109 would open the path toward 1.34064, where the September breakdown was retested. A break below 1.31814 would resume the downtrend that began when the triple bottom at 1.34742 gave way.
Bottom line
The week runs through inflation. Wednesday’s CPI decides whether the 10-year yield retests its 24-year high or slips out of its range, setting the tone for an S&P 500 near records and for a dollar that has pushed EUR/USD to a 17-month low. Oil stays the wild card: Trump’s pre-midterm pledge and the diesel deal lean toward lower prices, but both can reverse quickly. Australian jobs and Bailey then test how hawkish the RBA and the BoE are willing to sound. The first signals to watch are 5.34% on the 10-year and 7,782 on the S&P 500.
Trading involves risk.
Author



 Risk Disclaimer
The content provided here is for informational purposes only. It is not intended as personal investment advice and does not constitute a solicitation or invitation to engage in any financial transactions, investments, or related activities. Past performance is not a reliable indicator of future results.
The financial products offered by the Company are complex and come with a high risk of losing money rapidly due to leverage. These products may not be suitable for all investors. Before engaging, you should consider whether you understand how these leveraged products work and whether you can afford the high risk of losing your money.
The Company does not accept clients from the Restricted Jurisdictions as indicated in our website/ T&C. Some services or products may not be available in your jurisdiction.
The applicable legal entity and its respective products and services depend on the client’s country of residence and the entity with which the client has established a contractual relationship during registration.