6 min read
 Japan’s benchmark index has just printed a fresh all-time high, only to ease back as the same geopolitical story that powered the move turned less certain overnight.
Here’s what’s driving it:
- The deal optimism. Over the weekend, President Trump said a deal with Iran, including reopening the Strait of Hormuz, had been “largely negotiated”, describing it as a memorandum of understanding on peace with final details to follow. Iran’s foreign ministry framed the memorandum as a first phase, ahead of broader talks within roughly 30 to 60 days. By Sunday the tone had cooled, with Trump saying he had told negotiators not to rush and that the Hormuz blockade would stay in place until any agreement was signed.
- Why it matters for Japan. Japan imports almost all of its energy, which has left its economy especially exposed to the oil spike driven by the conflict. The prospect of a Hormuz reopening and falling crude prices is therefore a direct tailwind for Japanese equities, and that is what the market ran with on Monday.
- Monday’s record run. The Nikkei surged past 65,000 for the first time, closing around 65,158 after touching an intraday high near 65,400. The roughly 9% gain over three sessions was its steepest such run in more than six years, led by semiconductor and technology heavyweights.
- The overnight reversal. In the Asian session, US Central Command carried out what it called “self-defence strikes” in southern Iran, targeting missile launch sites and boats attempting to lay mines, while stressing it was using restraint during the ceasefire. The strikes landed just hours after Iranian negotiators had met Qatari mediators in Doha, and they took some of the air out of the deal optimism. The Nikkei has eased back below 65,000 as a result.
The index has broken out to a record but is now sitting just beneath that level, so the question is whether it can hold the breakout or whether the Iran whipsaw pulls it back toward support. The charts below lay out the key levels to watch.
Daily chart
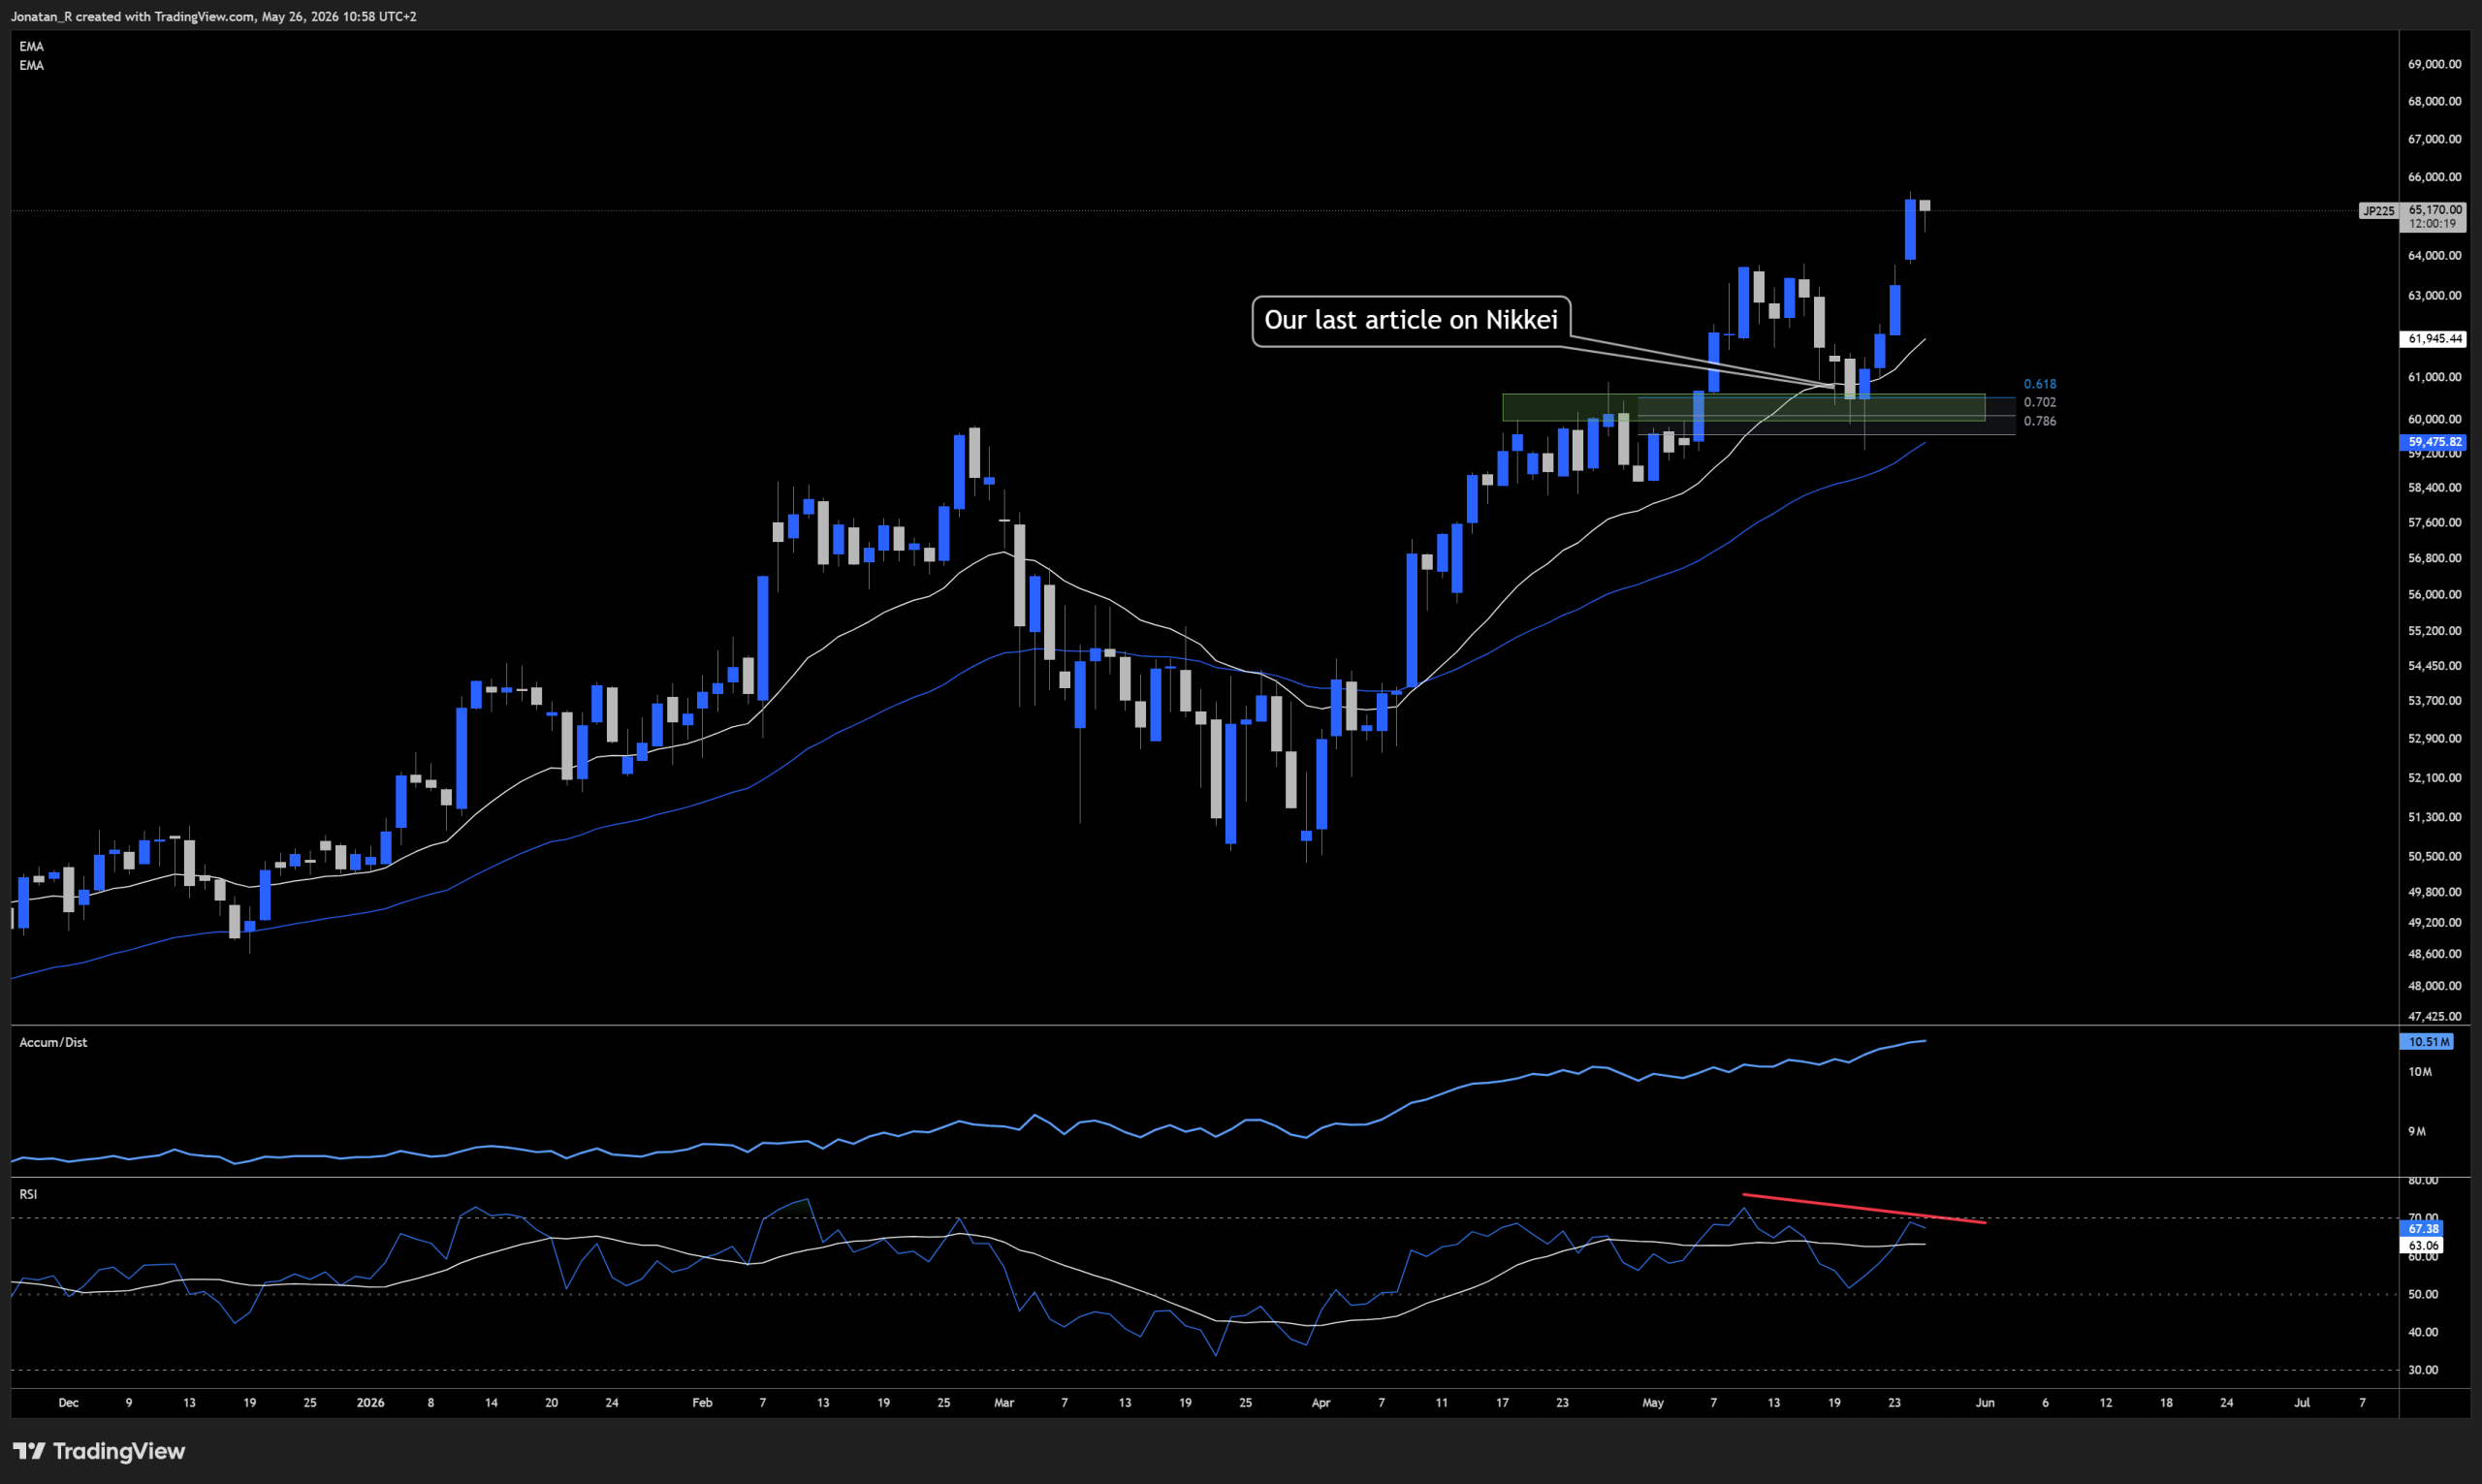
On the daily timeframe, the Nikkei bounced cleanly off the 60,000 level, the same support area highlighted in our analysis on 18 May. That zone lines up with a confluence of signals: the local reload area, the 0.618 to 0.786 retracement band, and the space between the daily 20 and 50 EMAs. Price held that support, then pushed on to a fresh record above 65,000.
A couple of things stand out beneath the surface:
- The accumulation/distribution line has broken higher and is trending up, which suggests buying pressure has been building behind the move rather than fading.
- At the same time, there is a potential bearish divergence forming on the RSI, with price making higher highs while the indicator has not followed to the same degree. This is not confirmed, and momentum still looks strong for now, but it is worth keeping in mind given the more uncertain geopolitical backdrop if the US-Iran deal were to falter.
For now the trend remains constructive while price holds above the 60,000 support zone, with the record high near 65,400 as the level to beat on the upside.
4-hour chart
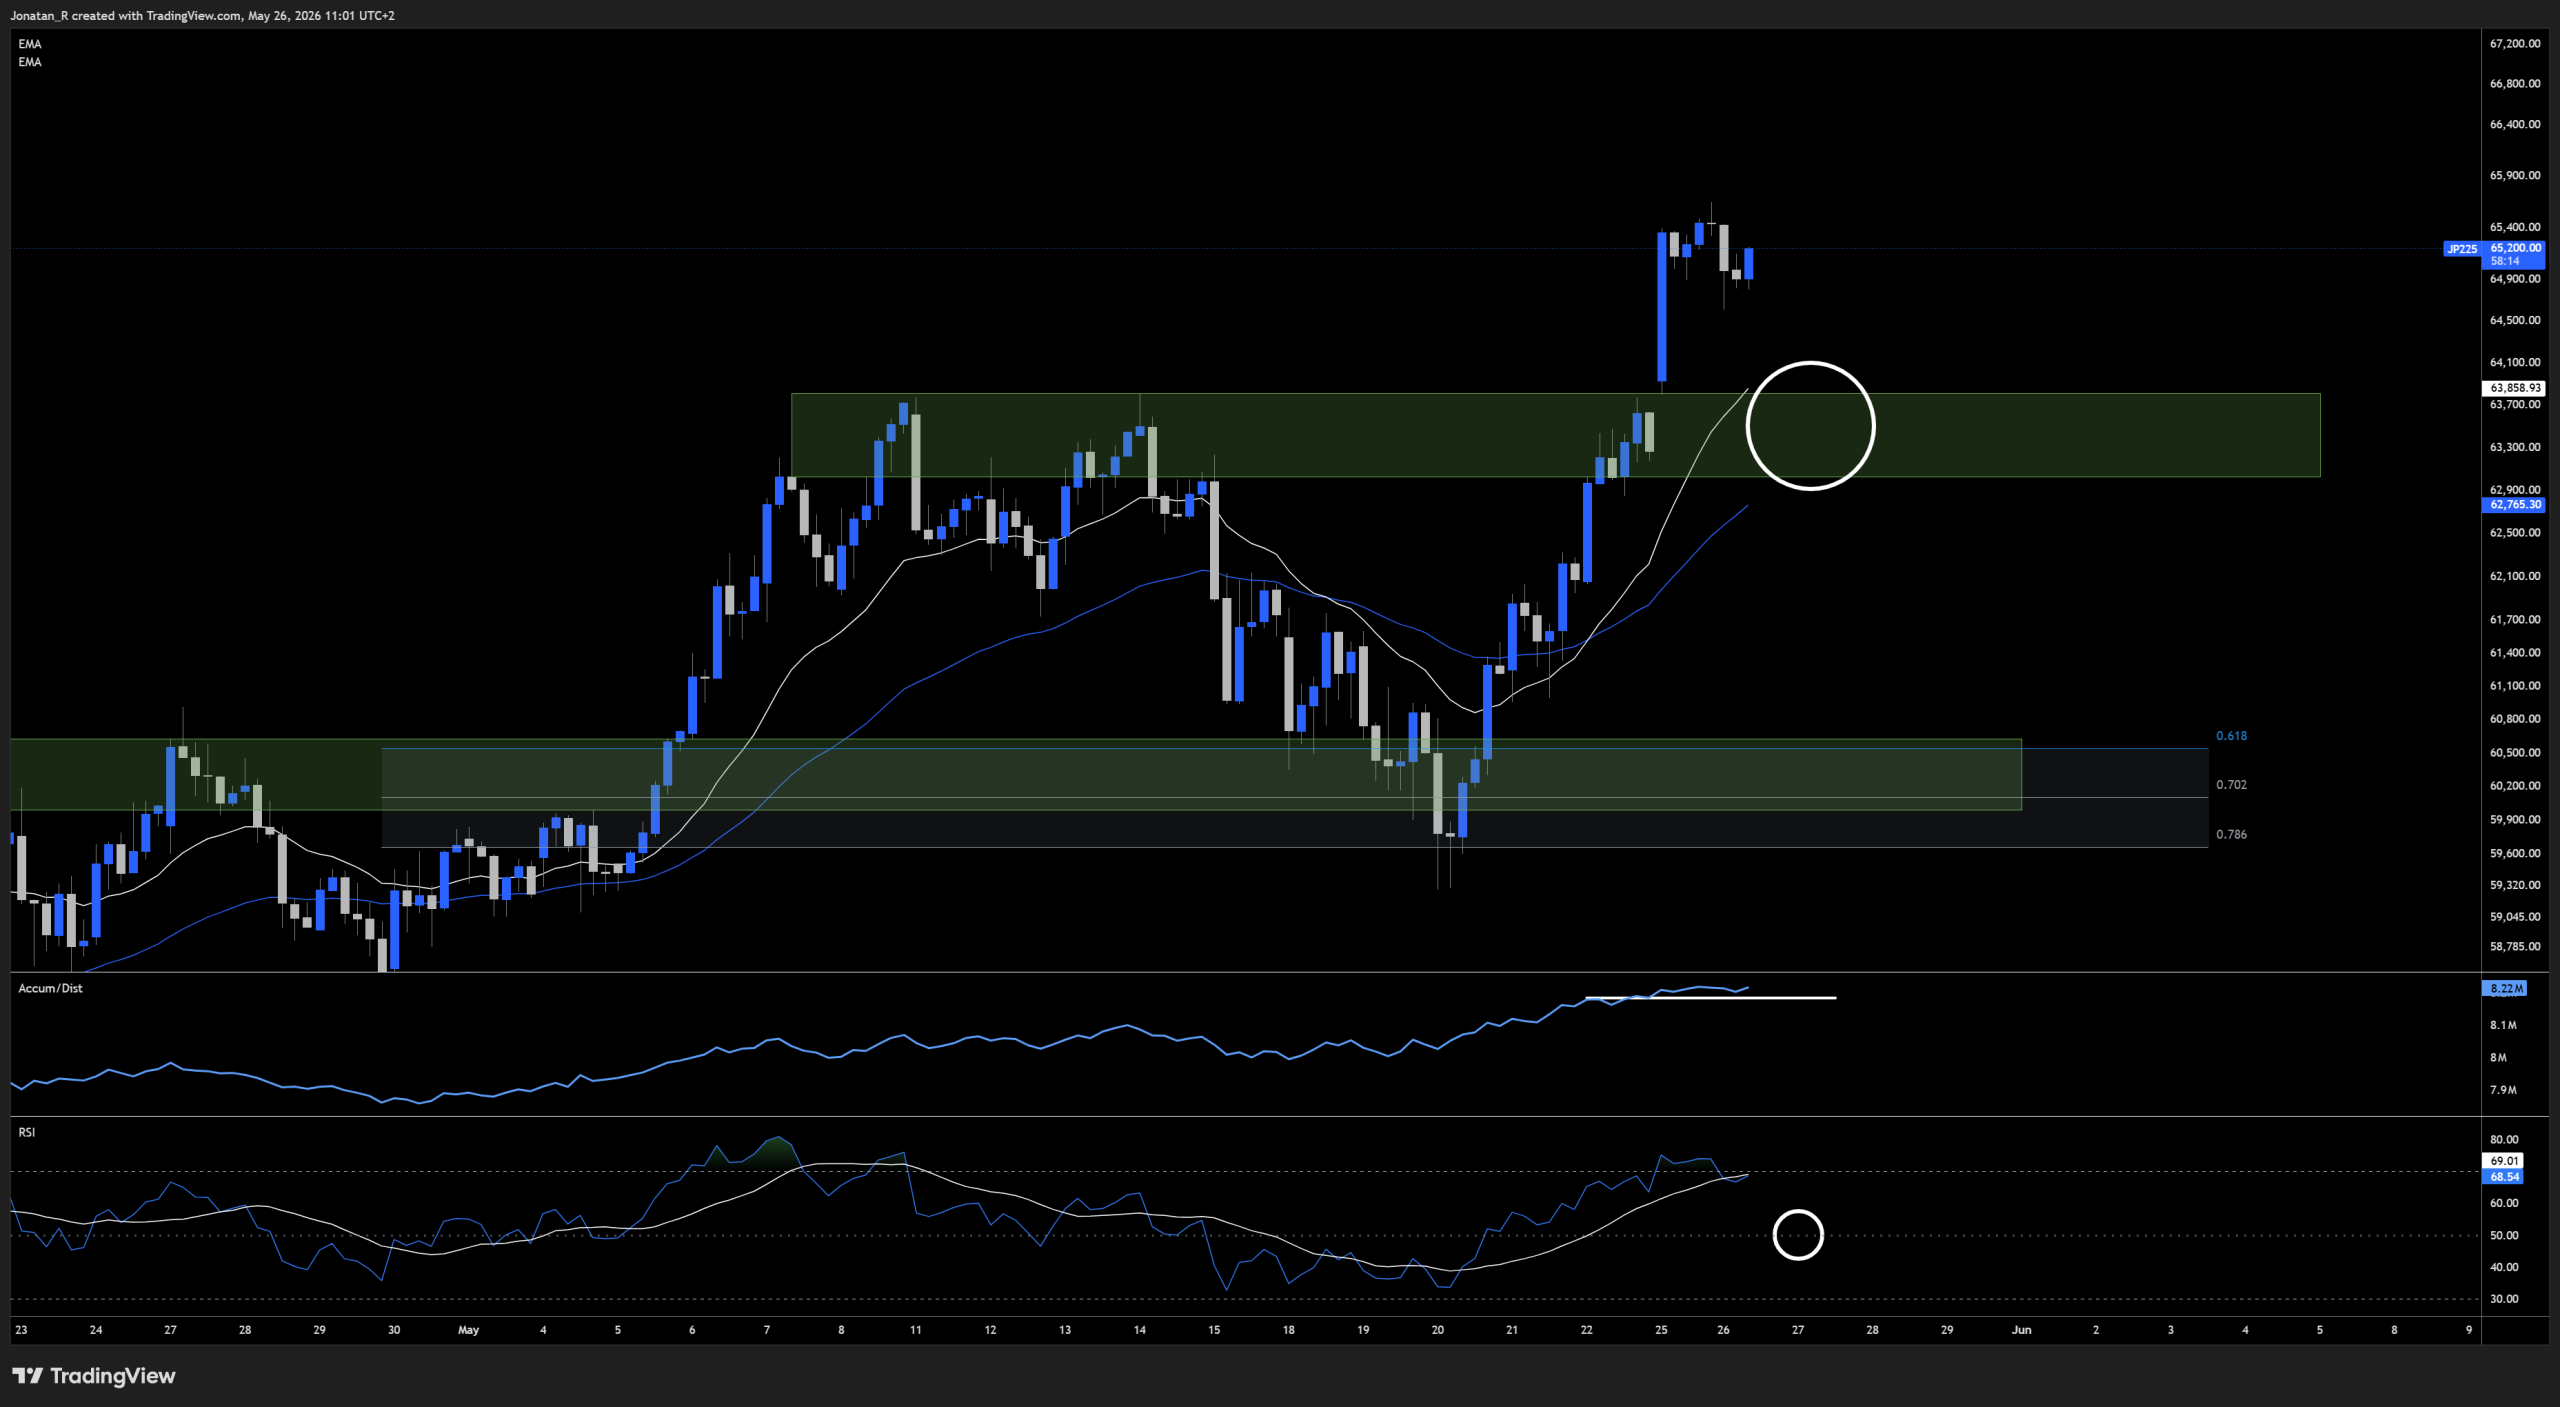
On the 4-hour timeframe, the Nikkei has pulled back from the highs but appears to be regaining some momentum. If the move lower were to continue, there is a well-defined support area below around 63,500, which marks the last breakout zone and also left a gap in price. That same area lines up with the 20 and 50 EMAs on the 4-hour.
The indicators offer a two-sided picture:
- The accumulation/distribution line is still in an uptrend, but it could potentially break down. A move lower in price could be the trigger for that breakdown in the accumulation range.
- A bounce inside the 63,500 support area could see the RSI stabilise around the middle line, and if bullish volume comes back into the market, that could help confirm a potential bounce.
Key levels to watch
- 65,400 as the record high and the immediate resistance to reclaim
- 65,000 as the breakout level price is now hovering around
- 63,500 as the first major support on the 4-hour, reinforced by the gap and the 20 and 50 EMAs
- 60,000 as the higher-timeframe support zone that launched the latest leg, reinforced by the retracement band and the daily 20 and 50 EMAs
What to watch
- The US-Iran deal headlines, particularly whether the overnight strikes derail the memorandum of understanding or talks resume
- The Strait of Hormuz, where any move toward a reopening could ease the energy pressure on Japan
- Oil prices, given the direct read-through to Japanese equities
- Any follow-through on the potential bearish divergence on the daily, which could gain weight if price stalls near the record high
Trading involves risk.
Author



 Risk Disclaimer
The content provided here is for informational purposes only. It is not intended as personal investment advice and does not constitute a solicitation or invitation to engage in any financial transactions, investments, or related activities. Past performance is not a reliable indicator of future results.
The financial products offered by the Company are complex and come with a high risk of losing money rapidly due to leverage. These products may not be suitable for all investors. Before engaging, you should consider whether you understand how these leveraged products work and whether you can afford the high risk of losing your money.
The Company does not accept clients from the Restricted Jurisdictions as indicated in our website/ T&C. Some services or products may not be available in your jurisdiction.
The applicable legal entity and its respective products and services depend on the client’s country of residence and the entity with which the client has established a contractual relationship during registration.