
 8 min read
 Technical picture
Bitcoin printed a fresh multi-week low at $57,748 in late June before bouncing back to $62,664 on the latest close. The recovery has taken price into a converging wedge pinned between the descending trendline from the June top and the rising trendline off the recent low, with a decision point in the $63-65K zone. Above that, the next resistance layer sits near $65,762 (the 20-day EMA and the FVG at $65-70K), followed by $70,447 and the red 200-day EMA at $75,610.
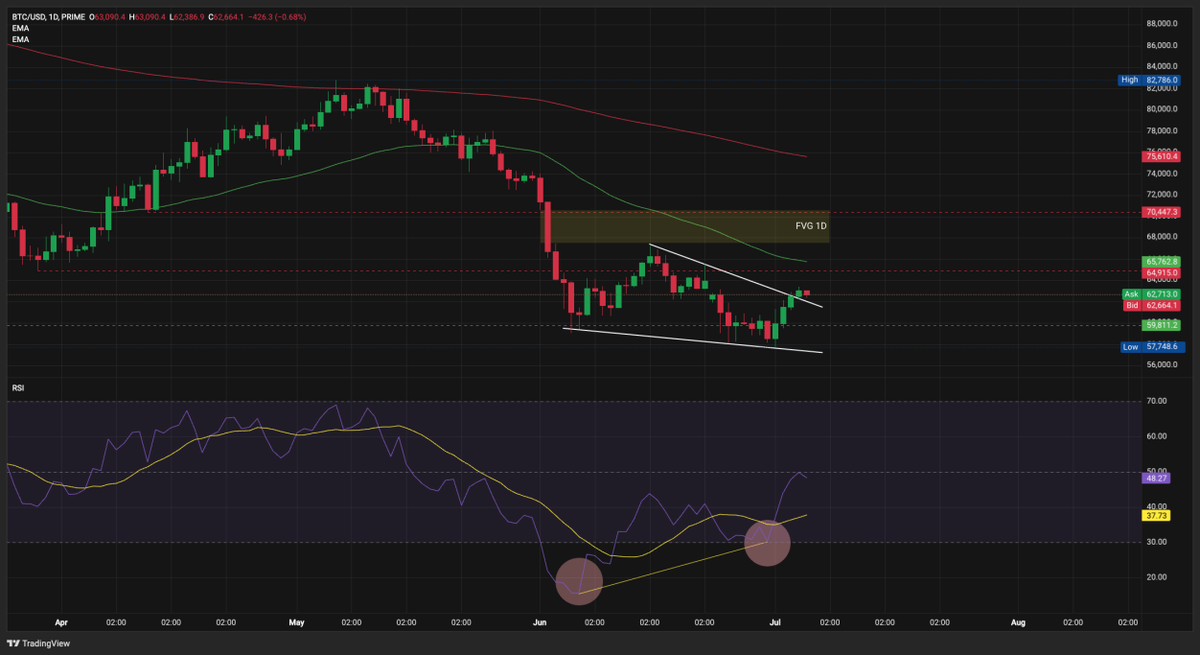
The daily RSI has recovered to 48, above the yellow signal at 37, off the two oversold zones marked in early and late June. That is consistent with a technical bounce off support, but the reflexive move higher does not resolve the wedge. A clean break above the FVG opens the way toward $70K, while a rejection back below $59,811 puts the recent low of $57,748 in play again.
Crypto heatmap
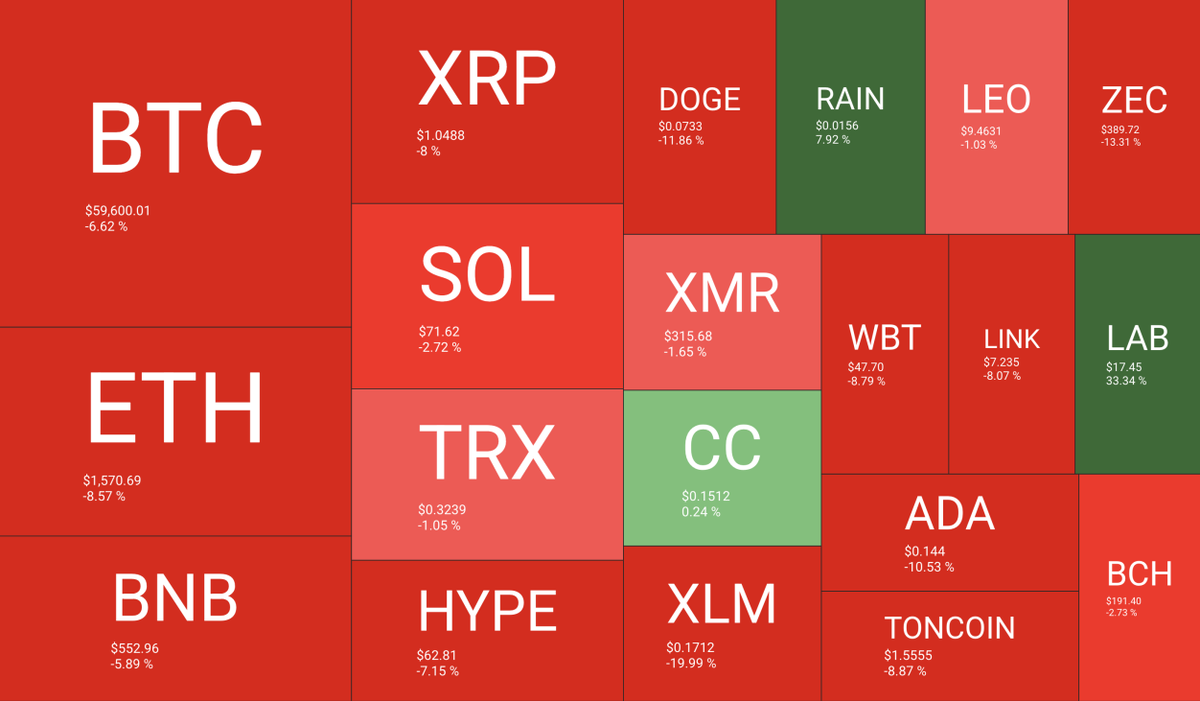
The heatmap captures the mid-week reference tape before the bounce, when the market was still deep in the risk-off leg that carried BTC toward $58K.
Source: https://quantifycrypto.com/heatmaps
At that snapshot Bitcoin was down 6.62% and the top 20 was almost entirely red, led by XLM at minus 19.99%, ZEC at minus 13.31%, and DOGE at minus 11.86%. The only meaningful green name was LAB at plus 33.34%. Since the snapshot, price has recovered about 6% off the low, but the breadth on the tape is a reminder of how sharp the selloff was before the whale bid discussed below absorbed the flow.
Altcoin Season Index
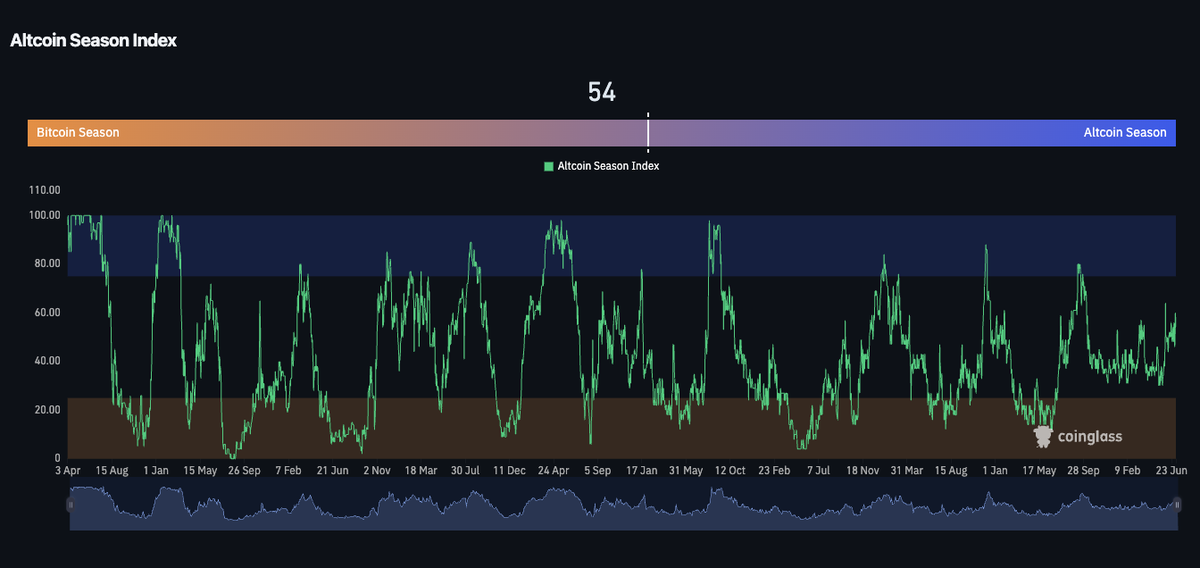
The Altcoin Season Index ticked down to 54 from 56 last week, still just above the 50 midpoint and inside Bitcoin Season territory.
Source: https://www.coinglass.com/pro/i/alt-coin-season
The modest decline mirrors weakness in altcoins during the recent leg lower and confirms the rotation into alts is still tepid. Anything below 75 says the market is not in a broad-based alt rally, and today’s reading is far from that threshold.
Fear and Greed climbs out of Extreme Fear
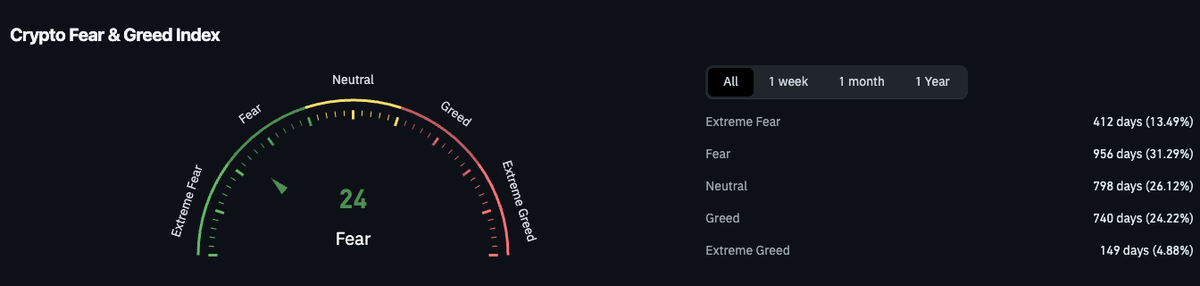
The Crypto Fear and Greed Index rose to 24 from 17 last week, exiting the Extreme Fear zone that has historically marked accumulation windows. The dial now sits inside ordinary Fear.
Source: https://www.coinglass.com/pro/i/FearGreedIndex
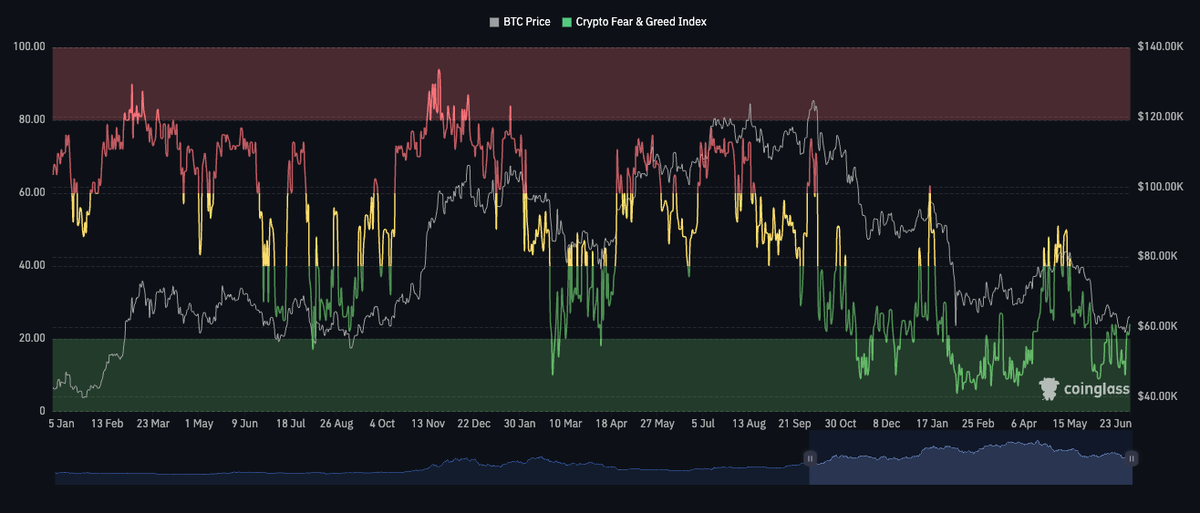
Extreme Fear historically covers only about 13.5% of days on record, so the market spent an extended stretch in the tail. The move to 24 tracks the technical bounce and is consistent with sentiment normalising rather than a full pivot. On the long-term overlay, the gauge is stepping out of the green band that has historically preceded multi-month recoveries, which is broadly what the whale accumulation section below quantifies.
Macro: NFP misses as the labour market cools
June nonfarm payrolls printed 57K on July 2, well below the 115K Dow Jones consensus and a sharp step down from the downwardly revised 129K in May. Unemployment fell to 4.2%, but the drop came from a labour force participation rate slipping to 61.5%, the lowest since March 2021, rather than from stronger hiring.
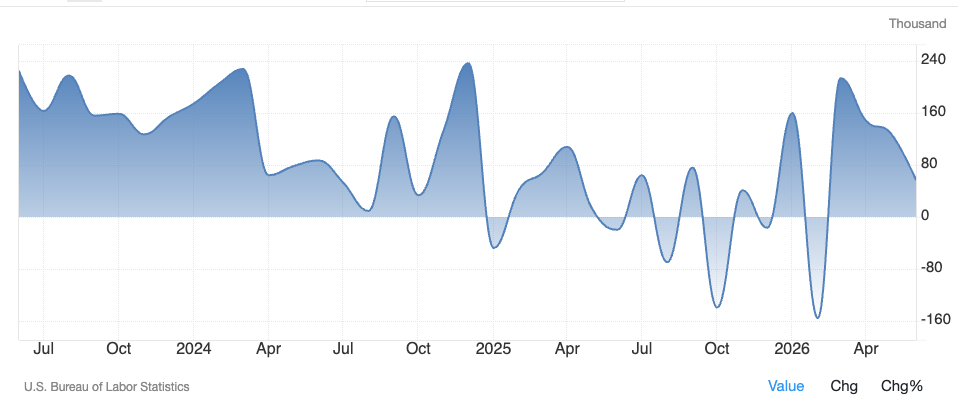
Markets read the report as dovish at the margin, with the 2-year Treasury yield dropping 3.5bps to 4.13% and traders easing back on rate-hike odds for September. For BTC this matters because the hawkish Fed pivot after Warsh’s June FOMC has been the dominant macro overhang. A cooler labour market makes the hawkish tilt harder to sustain, which is worth watching closely alongside the on-chain picture that follows.
Whale movements: record accumulation
CryptoQuant flagged a rare vertical spike in whale-address balance over the past 30 days, and the on-chain data behind it is the biggest single accumulation event on record. Whale addresses added roughly 270,000 BTC over the two weeks ending in early July, concentrated around the $59K level, worth about $16.7B.
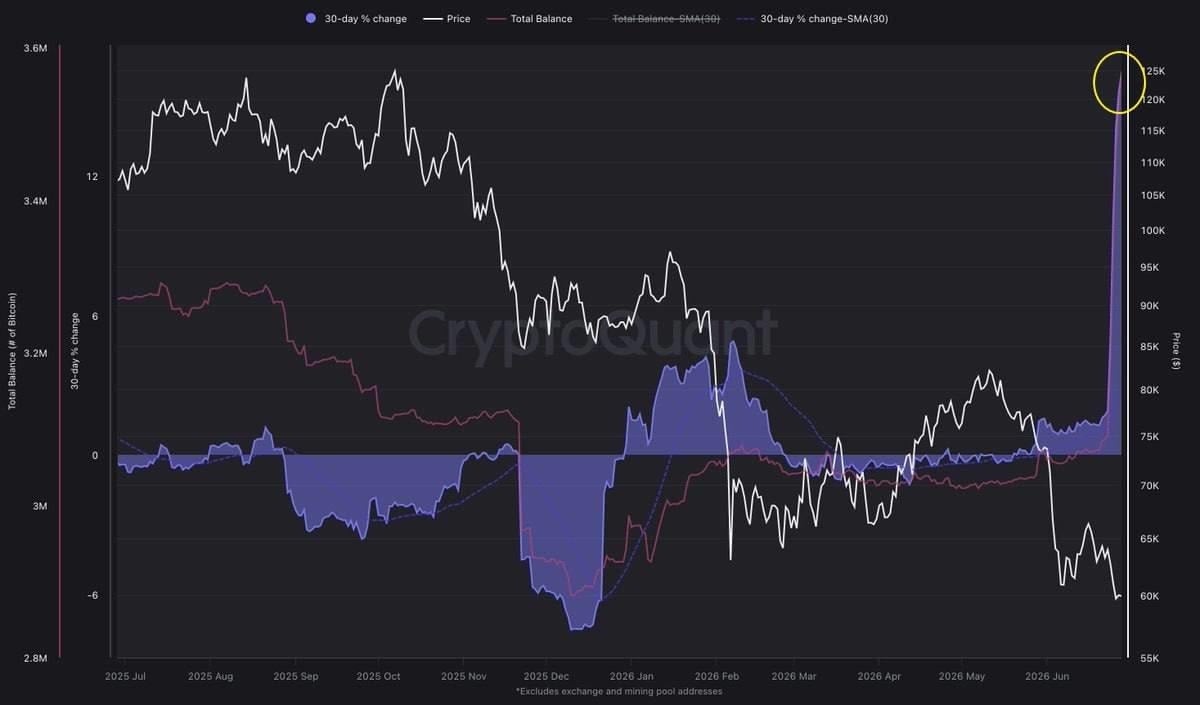
Waves of that size have historically preceded meaningful upside on a 1 to 3 month horizon, though they can also coexist with lower prices in the short term while the market absorbs paper supply. The takeaway is that large holders were the dominant marginal buyer at $58-60K, a direct counter to the ETF picture that follows.
Bitcoin ETF outflows hit a monthly record
US spot BTC ETFs recorded roughly $4.06B in net outflows during June 2026, the deepest monthly outflow since the products launched in January 2024.
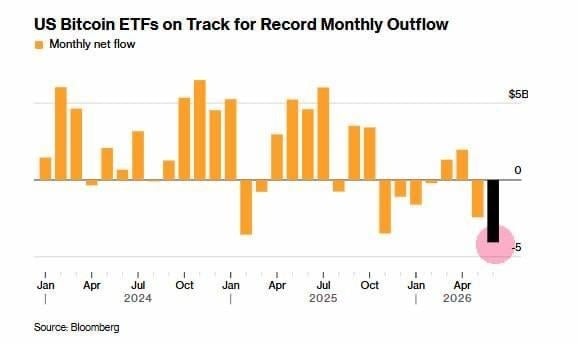
That surpassed the prior monthly record of $3.56B set in February 2025 and pushed cumulative 2026 ETF flows negative for the first time. Read together with the whale section above, this is the cleanest recent example of the great split: institutional US flows exiting into the same tape where the largest whale accumulation on record was absorbing supply. It typically signals institutions locking in losses or losing faith in the near-term upside case, or both. It also fits the classic bear-market pattern where retail and institutions capitulate in the same zone that patient large holders use as an entry.
Bitcoin dominance
On the weekly, Bitcoin dominance is consolidating inside the range between 57.17% and 61.41% after the top structure rolled from bull to bear.
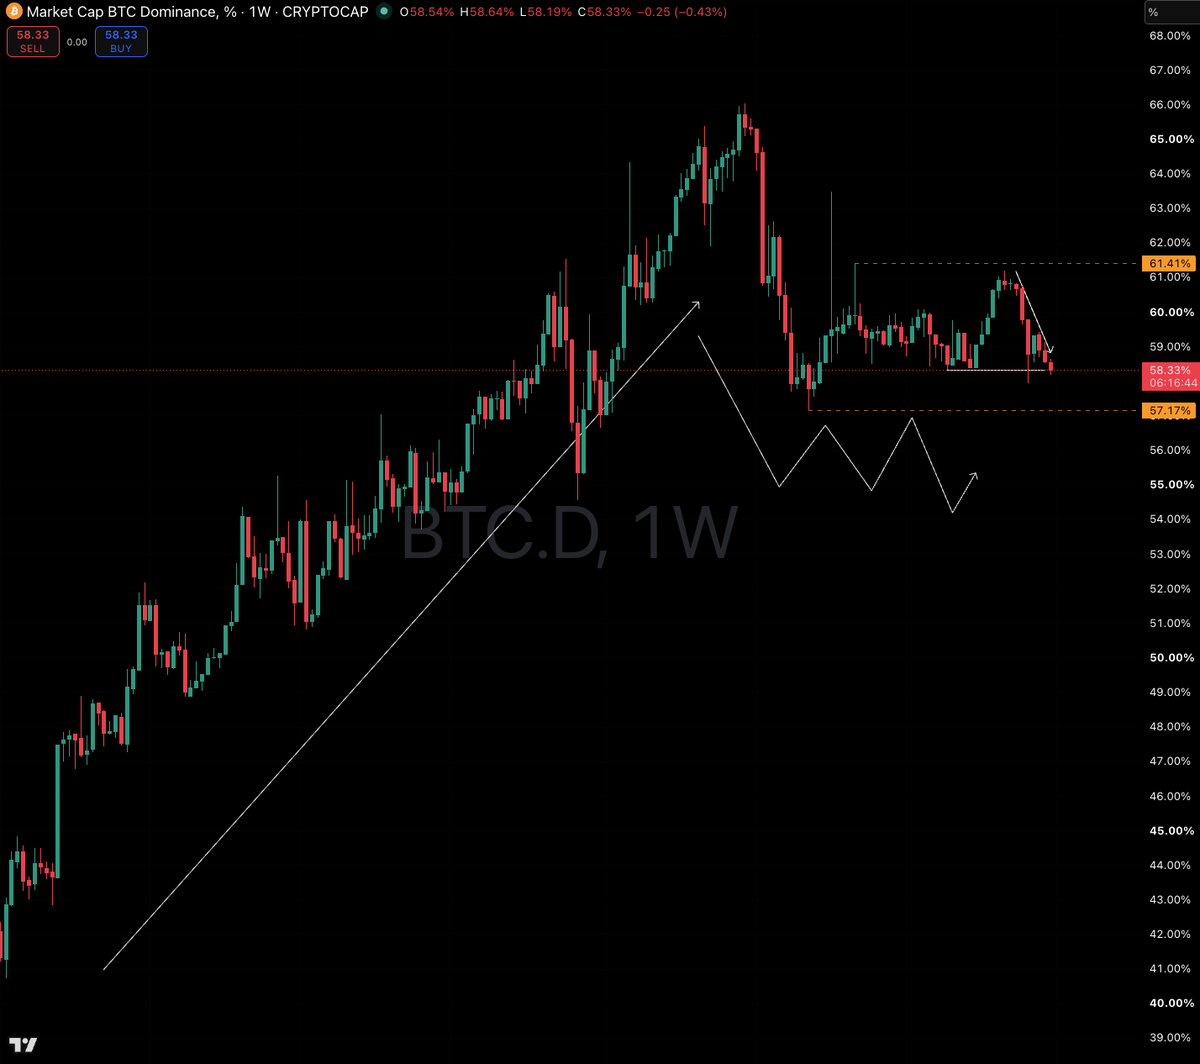
The latest weekly print at 58.33% sits in the lower half of the range. A clean break below 57.17% would open the door to further liquidity rotation from Bitcoin into altcoins. Until that happens, dominance is likely to keep chopping inside the range, which fits the tepid Altcoin Season reading above and the mixed cross-coin tape from the heatmap.
Conclusion
The tape shows a rare split. Retail and institutions are still hitting the exit, ETF outflows just posted their worst month on record, and NFP came in soft. On the other side, whales absorbed 270K BTC on-chain during the same window (the largest recorded), and price has bounced from $57.7K to $62.6K on a technical wedge. Fear has softened but the market has not turned. Altcoins are still not leading.
Base case: this bounce may be the technical relief before the market reprices bull hopes back to zero. Long-term investors have received a first quality signal from the on-chain data, but confirmation of a trend change needs the macro tape to catch up. Until that happens, any rally is a chance to lighten longs, and any deeper leg toward $53K is a chance for patient buyers to add on the whale-follow trade.
Trading involves risk.
Author



 Risk Disclaimer
The content provided here is for informational purposes only. It is not intended as personal investment advice and does not constitute a solicitation or invitation to engage in any financial transactions, investments, or related activities. Past performance is not a reliable indicator of future results.
The financial products offered by the Company are complex and come with a high risk of losing money rapidly due to leverage. These products may not be suitable for all investors. Before engaging, you should consider whether you understand how these leveraged products work and whether you can afford the high risk of losing your money.
The Company does not accept clients from the Restricted Jurisdictions as indicated in our website/ T&C. Some services or products may not be available in your jurisdiction.
The applicable legal entity and its respective products and services depend on the client’s country of residence and the entity with which the client has established a contractual relationship during registration.








