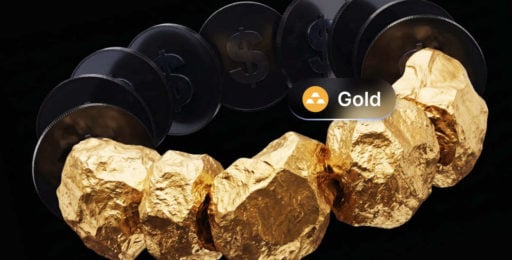

Gold has cleared $4,605 to trade near $4,650 an ounce, its highest level since mid-May, after the US Treasury said it would double long-dated bond buybacks. The rally is running despite weak physical demand, with traders now watching Wednesday's inflation data and Friday's Jackson Hole speech for confirmation.
Gold trades near $4,650 an ounce after clearing the $4,605 resistance that had capped its advance late last week. Bullion has gained close to 14% in August alone.
But the driver behind the move is unusual. The rally has not been led by physical demand — global gold demand in Q2 fell to 942 tonnes, the lowest since Q3 2021, on weaker jewellery buying and ETF outflows. Instead, a US Treasury operation reset the dollar and revived what markets have labelled the debasement trade.
The Treasury operation behind the move
On 19 August, the US Treasury announced it would double its long-term bond buyback operations, with the programme running from 9 September to 4 November. The announcement followed a bond-market disturbance: the 30-year Treasury yield had spiked to a 19-year high of 5.337%, a move that unsettled markets and prompted the response.
The buyback worked on yields but not on the dollar. Long-dated yields pulled back to around 5.198%, while the dollar index sank to 98.723, its lowest level since 14 May. Analysts including ING's Chris Turner and Capital Economics' Ariane Curtis pointed to the buyback expansion as the trigger, since it shifts more government borrowing toward short-term bills — a trade-off markets read as dollar-negative.
When the market questions the dollar's purchasing power rather than simply its yield, a non-yielding store of value gains appeal for a different reason than usual. Bitcoin has traded near $78,000 on the same narrative, and spot silver has followed.
Weak demand complicates the rally
Physical demand tells a different story. Global gold demand in Q2 2026 fell to 942 tonnes, the lowest reading since Q3 2021, as softer jewellery demand and a near-halving of investment demand drove outflows from gold ETFs. Central-bank buying has continued, but official-sector data arrives with a lag and does not explain a 14% move within a single month.
The source frames two legitimate but hedged readings: a rally that does not depend on jewellery flows may be less vulnerable to those flows reversing, but a move built on a policy narrative rather than physical absorption could unwind as quickly as the narrative shifts, since there is no demand floor beneath it the way a consumption-led advance would provide. Gold is at a three-month high, yet it remains roughly 17% below its January 2026 record of about $5,602.
Levels and catalysts to watch
Gold rallied roughly 10% from the 30 June swing low near $3,942 to $4,335 by 18 August, then added 4.35% in a single session on 19 August to close at $4,523, its largest one-day gain since February 2026. Saxo Bank's Ole Hansen identified $4,770 as the next resistance level after the move above the 200-day moving average triggered fresh momentum buying.
Resistance sits at $4,700, then $4,770, then $4,855 to $4,894. Support runs from $4,605 down through $4,520, $4,400 and the $4,000 base. A close above $4,700 would signal the move is extending, while a return beneath $4,605 would signal the breakout has met supply.
US PCE inflation data lands Wednesday, and Warsh speaks at Jackson Hole Friday at 10:00 ET, alongside a preliminary payroll benchmark revision the same day.
Source: Investing.com
Trading involves risk.





 Risk Disclaimer