15 min read
 1inch (1INCH) trades near $0.084 in early August 2026, about 99% below the record high it set in 2021 and only a cent above the all-time low it printed in July 2026. 1INCH is the governance token of the 1inch Network, the largest decentralized-exchange (DEX) aggregator in decentralized finance — software that scans dozens of exchanges and liquidity sources to route a swap at the best available price. This page lays out PrimeXBT’s price outlook for 1INCH through 2030 and out to 2050, the technical levels traders are watching now, and the events that could move it. Where the evidence is thin — and for a token this small, it often is — the outlook says so rather than inventing precision.
1inch outlook at a glance
- Current price: $0.1060 per 1INCH.
- 2026 base case: $0.077–$0.104, a year of basing near current levels rather than a decisive recovery.
- Main bullish catalyst: a broad altcoin upcycle plus rising on-chain swap volume, which is what an aggregator’s fee revenue ultimately tracks.
- Biggest downside risk: a slide back through the July low around $0.065 if DeFi activity cools and Bitcoin dominance keeps climbing.
- Long-term view: a gradual grind higher is the base case, but with 1INCH this far below its peak, multi-year figures describe a direction, not a destination.
Live 1inch price chart
Today (4 October 2026) 1inch (1INCH/USD) is trading at $0.1060 per 1INCH, with a market cap of $150,087,709 USD. The 24-hour trading volume amounts to $10,259,303 USD. 1INCH price has changed by 5.05% in the last 24 hours. 1inch’s circulating supply is 1,414,034,460 1INCH.
Trading involves risk.
1inch price prediction 2026–2030 (yearly forecast)
The table below sets PrimeXBT’s expected range for each year from 2026 to 2030. The far-out institutional and algorithmic targets that scatter across the internet rest on wildly different assumptions and are kept in the analyst section rather than blended into these numbers.
| Year | Minimum | Average | Maximum |
|---|---|---|---|
| 2026 | $0.077 | $0.089 | $0.104 |
| 2027 | $0.091 | $0.127 | $0.168 |
| 2028 | $0.139 | $0.193 | $0.239 |
| 2029 | $0.130 | $0.174 | $0.224 |
| 2030 | $0.113 | $0.151 | $0.189 |
1inch price prediction 2026
The 2026 outlook keeps 1INCH close to its early-August level, an average near $0.09 across the remaining months, with the price basing above the July low rather than staging a recovery. For a small-cap token that has spent the year grinding sideways, a quiet second half is the more honest call than a breakout.
The month-by-month path holds 1INCH in a narrow, slightly rising band into year-end:
| Month (2026) | Minimum | Average | Maximum |
|---|---|---|---|
| August | $0.077 | $0.084 | $0.091 |
| September | $0.079 | $0.086 | $0.094 |
| October | $0.081 | $0.089 | $0.097 |
| November | $0.084 | $0.092 | $0.100 |
| December | $0.086 | $0.095 | $0.104 |
1inch price prediction 2027
2027 is the first real recovery leg in the outlook: an average near $0.13, with the price working higher as the broader altcoin market firms and on-chain trading picks up. The step depends on the sector, not on 1inch alone — aggregator tokens rise when swap volume rises, and swap volume rises when the whole of DeFi is busy.
| Month (2027) | Minimum | Average | Maximum |
|---|---|---|---|
| January | $0.091 | $0.100 | $0.110 |
| February | $0.096 | $0.106 | $0.116 |
| March | $0.100 | $0.111 | $0.122 |
| April | $0.105 | $0.117 | $0.128 |
| May | $0.109 | $0.122 | $0.135 |
| June | $0.114 | $0.127 | $0.141 |
| July | $0.117 | $0.132 | $0.146 |
| August | $0.120 | $0.135 | $0.151 |
| September | $0.123 | $0.139 | $0.155 |
| October | $0.126 | $0.143 | $0.160 |
| November | $0.129 | $0.146 | $0.164 |
| December | $0.132 | $0.150 | $0.168 |
1inch price prediction 2028
2028 holds the cycle high in this forecast, an average near $0.19 with the path peaking mid-year before easing. That top sits just under the $0.22 level that has capped every attempted 1INCH rally for two years — the outlook approaches it without assuming a clean break, which is the difference between a recovery and a regime change.
| Month (2028) | Minimum | Average | Maximum |
|---|---|---|---|
| January | $0.139 | $0.159 | $0.179 |
| February | $0.147 | $0.168 | $0.190 |
| March | $0.154 | $0.178 | $0.201 |
| April | $0.162 | $0.187 | $0.212 |
| May | $0.169 | $0.196 | $0.223 |
| June | $0.177 | $0.205 | $0.234 |
| July | $0.179 | $0.209 | $0.239 |
| August | $0.177 | $0.207 | $0.237 |
| September | $0.174 | $0.205 | $0.235 |
| October | $0.172 | $0.202 | $0.233 |
| November | $0.170 | $0.200 | $0.231 |
| December | $0.167 | $0.198 | $0.229 |
1inch price prediction 2029
2029 cools off after the peak, an average near $0.17 as the price drifts lower through the year. Post-peak years in crypto tend to give back part of the advance rather than hold it, and 1INCH, with its long history of round-tripping rallies, has less reason than most to be an exception.
| Month (2029) | Minimum | Average | Maximum |
|---|---|---|---|
| January | $0.163 | $0.194 | $0.224 |
| February | $0.159 | $0.189 | $0.220 |
| March | $0.155 | $0.185 | $0.215 |
| April | $0.151 | $0.181 | $0.211 |
| May | $0.147 | $0.176 | $0.206 |
| June | $0.143 | $0.172 | $0.202 |
| July | $0.140 | $0.169 | $0.199 |
| August | $0.138 | $0.167 | $0.197 |
| September | $0.136 | $0.165 | $0.195 |
| October | $0.134 | $0.164 | $0.193 |
| November | $0.132 | $0.162 | $0.192 |
| December | $0.130 | $0.160 | $0.190 |
1inch price prediction 2030
The 2030 view settles around an average near $0.15, a stabilization rather than a fresh trend. Five years out, the month-to-month numbers below are a shape, not a schedule — treat them as the slope of the outlook, not dated targets.
| Month (2030) | Minimum | Average | Maximum |
|---|---|---|---|
| January | $0.128 | $0.158 | $0.189 |
| February | $0.127 | $0.157 | $0.187 |
| March | $0.125 | $0.155 | $0.186 |
| April | $0.123 | $0.154 | $0.184 |
| May | $0.122 | $0.152 | $0.183 |
| June | $0.120 | $0.151 | $0.182 |
| July | $0.119 | $0.150 | $0.180 |
| August | $0.118 | $0.149 | $0.180 |
| September | $0.116 | $0.148 | $0.179 |
| October | $0.115 | $0.147 | $0.178 |
| November | $0.114 | $0.146 | $0.178 |
| December | $0.113 | $0.145 | $0.177 |
1inch long-term price prediction: 2035, 2040–2050
Put a decade between a forecast and the present and the number stops being analysis and starts being a bet on regimes that don’t exist yet — swap-volume trends, DeFi regulation, whether the token ever captures the revenue the protocol generates. Nobody can price that, so the figures below are a slow upward drift rather than a projection anyone should lean on, and the error bars swallow the precision a little more with each year out. On that understanding, the long-range path trends gently higher and stays far below the 2021 peak:
| Year | Minimum | Average | Maximum |
|---|---|---|---|
| 2035 | $0.163 | $0.220 | $0.277 |
| 2040 | $0.204 | $0.300 | $0.396 |
| 2050 | $0.270 | $0.450 | $0.630 |
What analysts and models say (compared)
Forecasts for 1INCH sit further apart than for almost any major token, because the coin is small enough that a single model’s assumption swings the answer by an order of magnitude. Algorithmic aggregators range from near-flat to a full recovery within the same five-year window. Rather than average methods that don’t belong in the same table, here they are side by side.
| Source | Method | 1INCH view |
|---|---|---|
| Binance (community model) | Algorithmic | ~$0.084 in 2026 rising to ~$0.10 by 2030 (near-flat) |
| CoinDataFlow | Algorithmic | 2026 ~$0.04–$0.09; 2030 ~$0.11–$0.52 |
| Changelly | Algorithmic | 2026 avg ~$0.39; 2030 avg ~$1.79 |
| Coinpedia | Algorithmic | 2026 $0.09–$0.70; 2030 avg ~$4.90 |
The gap between these is the useful information. Binance’s model barely moves 1INCH over five years; Coinpedia’s has it multiplying more than fiftyfold. Both are built from momentum extrapolation, and both are guessing at a market cap that today sits near $118 million. Coinpedia at least ties its bull case to a concrete condition — a decisive close above $0.22 resistance — which is the same level our own peak-year outlook stops short of clearing. Anyone looking for consensus on 1INCH will not find it here, and that scatter is a fair warning about how little the market has settled on this token.
Track record of this forecast
This is the first 1INCH forecast PrimeXBT has published, so there is no prior call to grade yet. Each monthly update from here will put the last forecast next to the actual price on the update date and explain any gap in plain terms, including the misses.
1inch technical analysis
1INCH sits between its two most-watched moving averages, a picture of a token that has stopped falling but has not turned. As of early August 2026 it trades above the 50-day simple moving average near $0.076, which shows it has lifted off the July low, but just under the 200-day average near $0.089, so the longer trend is still pointed down. The RSI reads around 58 — neutral, with no overbought or oversold extreme to lean on.
The support and resistance levels that matter now are close together: support at $0.078, then $0.075 near the 50-day average, with the July all-time low around $0.065 as the floor that must hold. On the way up, the first resistance is the recent swing high near $0.088, which lines up with the 200-day average; clearing it would be the first sign the longer downtrend has cracked. The level that actually matters for the bigger picture is $0.22 — the ceiling on every rally attempt since 2024, and the line a genuine trend reversal would have to break. Broader sentiment leans cautious, with the crypto Fear & Greed Index near 40. For how to read these signals, see PrimeXBT’s guide to crypto technical analysis.
Correlation with other assets
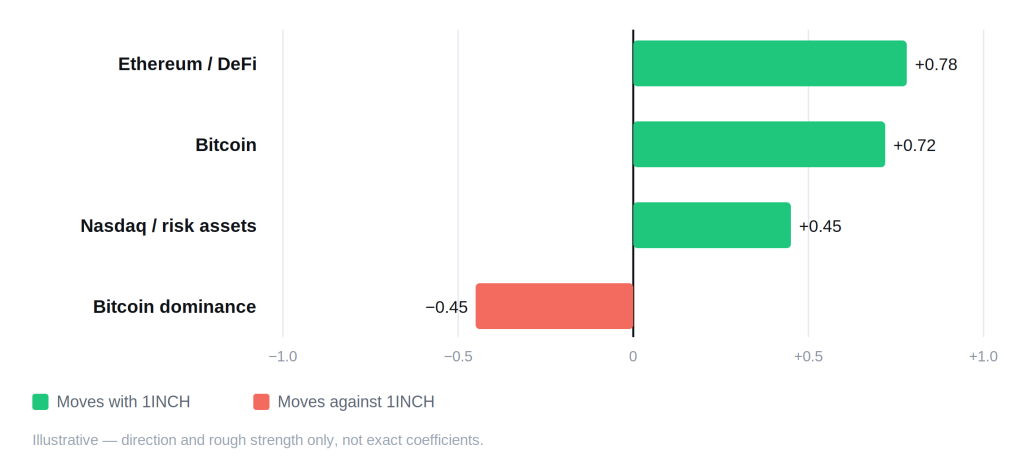
1INCH behaves like a high-beta bet on Ethereum and the DeFi sector as a whole. It is an ERC-20 token that also lives on other chains, so it rises and falls with Ethereum first and Bitcoin second, amplifying both moves on the way up and the way down. Its own fundamental pulse is on-chain trading activity: 1inch earns its keep by routing swaps, so when total DEX volume swells the aggregator’s relevance grows, and when volume dries up 1INCH tends to lead the sector lower. The single most reliable headwind is Bitcoin dominance — capital rotating toward Bitcoin drains altcoins first, and thin governance tokens like 1INCH are near the front of that queue. Since institutions crowded into crypto, the token also drifts with risk assets like the Nasdaq, which is why Federal Reserve policy now reaches it indirectly. What 1INCH does not have is a gold or dollar story: it is not a safe haven, and it carries no meaningful inverse link to the US dollar index the way harder assets do.
Fundamental factors
1inch is the leading DEX aggregator, and the distinction from an exchange matters. Uniswap and its peers hold the liquidity; 1inch is the routing layer on top, splitting a single trade across many pools through its Pathfinder algorithm to find a better price than any one venue offers. On PrimeXBT you can compare the underlying model in the explainer on Uniswap. The network has pushed steadily past simple aggregation: Fusion, launched in December 2022, lets users place intent-based, gasless swaps settled by a competitive network of resolvers through a Dutch-auction mechanism, and Fusion+ extends that to cross-chain swaps, with the 1inch wallet tying the pieces together for retail users.
The project’s history is worth knowing because it explains the token, not just the tech. Sergej Kunz and Anton Bukov built the first version at an ETHGlobal hackathon in New York in May 2019; the 1INCH token and the 1inch DAO both launched in December 2020. Holders stake 1INCH to take part in governance and the resolver system that powers Fusion, which locks up a slice of supply. The persistent question hanging over the token — the reason it trades where it does — is value capture: 1inch the protocol routes enormous volume, but 1INCH the token has never captured that revenue cleanly, so usage and price have drifted apart for years. On supply, the token is close to fully diluted: circulating supply is about 1.41 billion against a maximum of 1.5 billion, so roughly 94% is already in the market and the remaining emissions overhang is modest compared with earlier-stage tokens.
Upcoming catalysts
Only confirmed, dated events belong here. 1inch has no publicly scheduled network upgrade, token unlock cliff, or governance vote with a fixed date at the time of writing, so the calendar is macro — and given how 1INCH now tracks risk appetite, macro is the clearest near-term driver anyway.
| Date | Event | Potential impact |
|---|---|---|
| September 15–16, 2026 | FOMC meeting (with economic projections) | Bull if the Fed signals cuts and risk appetite returns to altcoins; bear if rates stay higher for longer |
| October 27–28, 2026 | FOMC meeting | The rate path steers capital between Bitcoin and the altcoin sector 1INCH sits in |
| December 8–9, 2026 | FOMC meeting (with economic projections) | Year-end policy signal that frames 2027 positioning |
The FOMC dates follow the Federal Reserve’s published 2026 schedule. No 1inch-specific dated catalyst is listed because none has been confirmed — putting a guessed date in the table would be fabrication, not forecasting.
Bull case vs bear case
Bull case:
- A broad altcoin upcycle lifts DeFi tokens, and rotation out of Bitcoin sends capital down the risk curve toward names like 1INCH.
- Total DEX trading volume climbs, and the aggregator’s routing relevance grows with it.
- Governance closes the value-capture gap, giving 1INCH a claim on the fee revenue the protocol already earns.
- Fusion and cross-chain routing win share, keeping 1inch the default aggregator as new chains launch.
Bear case:
- Rates stay higher for longer, keeping speculative altcoins under pressure and starving the sector of inflows.
- Bitcoin dominance keeps rising, and thin governance tokens bleed the most.
- The value-capture question stays unanswered, and usage keeps growing while the token does not.
- Aggregator margins compress as rivals and native wallet routers undercut the model.
Invalidation levels. The bull case loses its footing if 1INCH closes back below the July low near $0.065, which would put the token at fresh record lows with no support beneath it. The bear case is the one to question only on a sustained break above $0.088 — the swing high and 200-day average together — and it is properly overturned only if the price reclaims $0.22, the ceiling that has defined the downtrend. That upper trigger sits more than 150% above the current price, a gap that measures just how much repair the chart still needs.
Historical performance
1INCH is a case study in a token that peaked early and never came back. It launched in December 2020, ran to a record high in 2021, and has spent the years since carving lower highs and lower lows, shedding roughly 99% from top to the July 2026 bottom. The pattern is not a steady decline but a series of failed rallies, each capped lower than the last. Percentages tell the story better than any single price: a token down two orders of magnitude from its peak needs a different kind of recovery than one merely off its highs, and that reality anchors every range in this outlook.
Is 1inch a good investment in 2026?
Whether 1INCH fits a portfolio comes down to how much cyclical risk a trader wants and how long they are willing to wait. The outlook here sees the token basing near $0.09 through 2026 rather than recovering, with the real move — if it comes — pushed into a 2027–2028 altcoin cycle. The bull argument is that 1inch runs the leading DEX aggregator and trades at a fraction of its former value; the bear argument is that it has traded cheaply for years precisely because the token has never captured what the protocol earns. That tension, not any single price target, is the decision. A trader who believes DeFi volume and token value capture both improve has a case; one who does not is looking at a small-cap that has disappointed holders for four straight years.
How to trade 1inch on PrimeXBT
On PrimeXBT you can take a position on 1inch in either direction. CFDs on 1INCH can be traded long or short, so a view that the token keeps sliding is as tradable as a view that it recovers — see the guide to short selling for how the downside side works. Leverage magnifies gains and losses in equal measure, and on a token as volatile and thinly traded as 1INCH, position sizing and a stop-loss carry more weight than usual. Trade on your own analysis and risk tolerance, and never stake more than you can afford to lose.
Trading involves risk.
How we build this forecast
This outlook is assembled by PrimeXBT’s analysts rather than copied from a single price feed. We start from where 1INCH trades today, read its position against the 50- and 200-day moving averages and the levels traders are watching, weigh the fundamentals that actually drive an aggregator token — DEX trading volume, the Fusion resolver network, staking, and the long-running value-capture question — and set all of it against the macro backdrop, chiefly the path of US interest rates and Bitcoin dominance. The yearly ranges fold that technical read into the fundamental and macro picture; the long-range figures lean on trajectory over precision.
None of this is a promise. 1INCH is a small-cap token, its liquidity is thin, and a single sector rotation can move it faster than any model expects. Every figure here is a considered estimate rather than a guarantee, and the outlook is revisited and updated each month as the data changes.
Author



 Risk Disclaimer
The content provided here is for informational purposes only. It is not intended as personal investment advice and does not constitute a solicitation or invitation to engage in any financial transactions, investments, or related activities. Past performance is not a reliable indicator of future results.
The financial products offered by the Company are complex and come with a high risk of losing money rapidly due to leverage. These products may not be suitable for all investors. Before engaging, you should consider whether you understand how these leveraged products work and whether you can afford the high risk of losing your money.
The Company does not accept clients from the Restricted Jurisdictions as indicated in our website/ T&C. Some services or products may not be available in your jurisdiction.
The applicable legal entity and its respective products and services depend on the client’s country of residence and the entity with which the client has established a contractual relationship during registration.