14 min read
 Aave (AAVE) trades near $90 in early August 2026, a long way below the $661 it reached in 2021 and roughly a tenth of the deposits its protocol now secures. AAVE is the governance token of Aave, the largest decentralized lending protocol in DeFi — a place to earn yield by lending crypto or to borrow against collateral, spread across Ethereum and around twenty other chains. This page lays out PrimeXBT’s price outlook for AAVE through 2030 and out to 2050, the technical levels traders are watching, and the events that could push the token either way. Where a number is a genuine guess, it is labelled as one.
Aave outlook at a glance
- Current price: $157.79 per AAVE.
- 2026 base case: $82.80–$152.71, averaging near $115 — a partial recovery off the summer lows rather than a return to old highs.
- Main bullish catalyst: the Aavenomics 3.0 automated buyback now routing protocol revenue into AAVE, plus growth in the GHO stablecoin and the pending V4 upgrade.
- Biggest downside risk: a DeFi-wide risk-off move and a sustained break below the $85 support, compounded by the Fed holding rates higher for longer.
- Long-term view: the model drifts higher into the late-2020s and beyond, but every figure past 2030 is a scenario, not a target.
Live Aave price chart
Today (13 October 2026) Aave (AAVE/USD) is trading at $157.79 per AAVE, with a market cap of $2,442,195,261 USD. The 24-hour trading volume amounts to $284,302,729 USD. AAVE price has changed by -4.86% in the last 24 hours. Aave’s circulating supply is 15,436,087 AAVE.
Trading involves risk.
Aave price prediction 2026–2030 (yearly forecast)
The table below is PrimeXBT’s expected range for AAVE in each year. The far-out institutional targets that reach four and five figures rest on assumptions we do not share, so they sit in the analyst section rather than getting blended into these ranges.
| Year | Minimum | Average | Maximum |
|---|---|---|---|
| 2026 | $82.80 | $113.80 | $152.71 |
| 2027 | $129.70 | $160.84 | $202.15 |
| 2028 | $162.07 | $212.38 | $271.52 |
| 2029 | $201.74 | $253.99 | $309.57 |
| 2030 | $175.50 | $235.73 | $294.85 |
Aave price prediction 2026
Our 2026 outlook lifts AAVE off its summer floor to an average near $115, a full-year range of $82.80–$152.71. That is roughly a quarter above the early-August price and stops well short of a new bull market — a recovery driven by the buyback bid rather than a fresh wave of speculation.
| Month (2026) | Minimum | Average | Maximum |
|---|---|---|---|
| August | $82.80 | $90.00 | $97.20 |
| September | $92.65 | $101.00 | $109.35 |
| October | $102.44 | $112.00 | $121.56 |
| November | $114.90 | $126.00 | $137.10 |
| December | $127.29 | $140.00 | $152.71 |
Aave price prediction 2027
2027 is where the recovery firms up, with the year averaging near $160 across a band of $129.70–$202.15. The step up leans on wider adoption of GHO and the first full year of automated buybacks pulling AAVE off the market, not on a single event.
| Month (2027) | Minimum | Average | Maximum |
|---|---|---|---|
| January | $129.70 | $143.08 | $156.45 |
| February | $132.10 | $146.15 | $160.21 |
| March | $134.48 | $149.23 | $163.98 |
| April | $136.84 | $152.31 | $167.77 |
| May | $139.19 | $155.38 | $171.58 |
| June | $141.52 | $158.46 | $175.40 |
| July | $144.08 | $161.82 | $179.56 |
| August | $146.87 | $165.45 | $184.04 |
| September | $149.65 | $169.09 | $188.54 |
| October | $152.40 | $172.73 | $193.06 |
| November | $155.13 | $176.36 | $197.60 |
| December | $157.85 | $180.00 | $202.15 |
Aave price prediction 2028
2028 carries AAVE higher again to an average near $215, ranging $162.07–$271.52. A Bitcoin halving lands in this window, and AAVE, as a high-beta DeFi asset, tends to ride the risk appetite that follows it.
| Month (2028) | Minimum | Average | Maximum |
|---|---|---|---|
| January | $162.07 | $185.38 | $208.70 |
| February | $166.26 | $190.77 | $215.28 |
| March | $170.43 | $196.15 | $221.88 |
| April | $174.56 | $201.54 | $228.51 |
| May | $178.67 | $206.92 | $235.18 |
| June | $182.75 | $212.31 | $241.87 |
| July | $186.05 | $216.82 | $247.59 |
| August | $188.57 | $220.45 | $252.34 |
| September | $191.08 | $224.09 | $257.10 |
| October | $193.57 | $227.73 | $261.89 |
| November | $196.04 | $231.36 | $266.69 |
| December | $198.48 | $235.00 | $271.52 |
Aave price prediction 2029
2029 is the peak year in our model, averaging near $255 with a range of $201.74–$309.57. It sits roughly twelve to eighteen months past the halving, the window in which past crypto cycles have topped, and marks the high point of this forecast before the market cools.
| Month (2029) | Minimum | Average | Maximum |
|---|---|---|---|
| January | $201.74 | $239.62 | $277.49 |
| February | $204.97 | $244.23 | $283.50 |
| March | $208.17 | $248.85 | $289.52 |
| April | $211.35 | $253.46 | $295.58 |
| May | $214.50 | $258.08 | $301.65 |
| June | $217.63 | $262.69 | $307.75 |
| July | $217.70 | $263.64 | $309.57 |
| August | $214.75 | $260.91 | $307.07 |
| September | $211.81 | $258.18 | $304.56 |
| October | $208.88 | $255.45 | $302.03 |
| November | $205.97 | $252.73 | $299.48 |
| December | $203.08 | $250.00 | $296.92 |
Aave price prediction 2030
Our 2030 view eases back to an average near $235, spanning $175.50–$294.85. Five years out the shape matters more than any dated figure, so read the monthly path below as a trajectory that rolls over from the 2029 high, not a calendar of exact prices.
| Month (2030) | Minimum | Average | Maximum |
|---|---|---|---|
| January | $200.54 | $247.69 | $294.85 |
| February | $198.01 | $245.38 | $292.76 |
| March | $195.49 | $243.08 | $290.66 |
| April | $192.99 | $240.77 | $288.55 |
| May | $190.49 | $238.46 | $286.43 |
| June | $188.01 | $236.15 | $284.29 |
| July | $185.74 | $234.09 | $282.44 |
| August | $183.67 | $232.27 | $280.87 |
| September | $181.62 | $230.45 | $279.29 |
| October | $179.57 | $228.64 | $277.71 |
| November | $177.53 | $226.82 | $276.11 |
| December | $175.50 | $225.00 | $274.50 |
Aave long-term price prediction: 2035, 2040–2050
Push a lending token out a decade and the error bars swallow the estimate. GHO could be a top-three stablecoin by then or a footnote; on-chain lending could sit inside every brokerage app or stay a crypto-native niche; the macro regime that sets risk appetite is anyone’s guess. Treat the numbers below as a slow upward drift with very low confidence, not a forecast anyone should trade on:
| Year | Minimum | Average | Maximum |
|---|---|---|---|
| 2035 | $222.00 | $300.00 | $378.00 |
| 2040 | $272.00 | $400.00 | $528.00 |
| 2050 | $360.00 | $600.00 | $840.00 |
Our long-range anchors put 2035 near a $300 average, 2040 near $400, and 2050 near $600. Those figures assume Aave stays the reference lending protocol and its buyback keeps shrinking the float — remove either assumption and the path flattens.
What analysts and models say (compared)
AAVE forecasts scatter more widely than most large-cap crypto. For 2026 alone, algorithmic models run from about $69 to $287 — a four-fold gap on a single year. Averaging numbers built on opposite assumptions would only bury the disagreement, so the leading models are laid out side by side instead.
| Source | Method | Aave view (2026 unless noted) |
|---|---|---|
| CoinCodex | Algorithmic | Avg ~$114 (range $89–$142); ~$154 by 2030 |
| Cryptopolitan | Algorithmic / editorial | Avg ~$113 (range $65–$141); ~$245 by 2030 |
| CoinDataFlow | Algorithmic | Avg ~$69 (range $44–$93); ~$302 by 2030 |
| Changelly | Algorithmic | Avg ~$287 (range $277–$330); ~$1,408 by 2030 |
The disagreement is the honest signal here. CoinCodex and Cryptopolitan cluster near $110–$115 for 2026, close to where AAVE trades now; CoinDataFlow sees it slipping first; Changelly starts high and compounds into a four-figure 2030 that no other model comes near. On decade-out figures the spread turns absurd — CoinDataFlow and Changelly both model AAVE in the tens of thousands by 2040, which says more about exponential extrapolation than about Aave. PrimeXBT’s own ranges sit with the conservative cluster, closer to protocol economics than to a moonshot.
Track record of this forecast
This is PrimeXBT’s first published price forecast for Aave, so there is no prior call to grade yet. Each monthly update from here will hold the last forecast against AAVE’s actual price and spell out where it went wrong, rather than quietly revising the target.
Aave technical analysis
AAVE sits pinned between its two key moving averages. It trades right on the 50-day simple moving average near $89.93 and below the 200-day average of $100.22 — a market that has stabilised after a sharp decline but has not reclaimed its longer trend. The 14-day RSI reads about 45, squarely neutral, and the Fear & Greed Index sits at 29, in “Fear” — the kind of muted backdrop that precedes a range rather than a trend.
The support and resistance levels in play now: support at $87.87, then $86.33, with the last line of defence at $85.12; resistance at $90.63, then $91.83, with $93.38 capping the near-term ceiling. Reclaiming the 200-day average at $100.22 is the level that would signal the longer downtrend has actually broken, not just paused. For the mechanics behind these signals, see PrimeXBT’s guide to crypto technical analysis.
Correlation with other assets
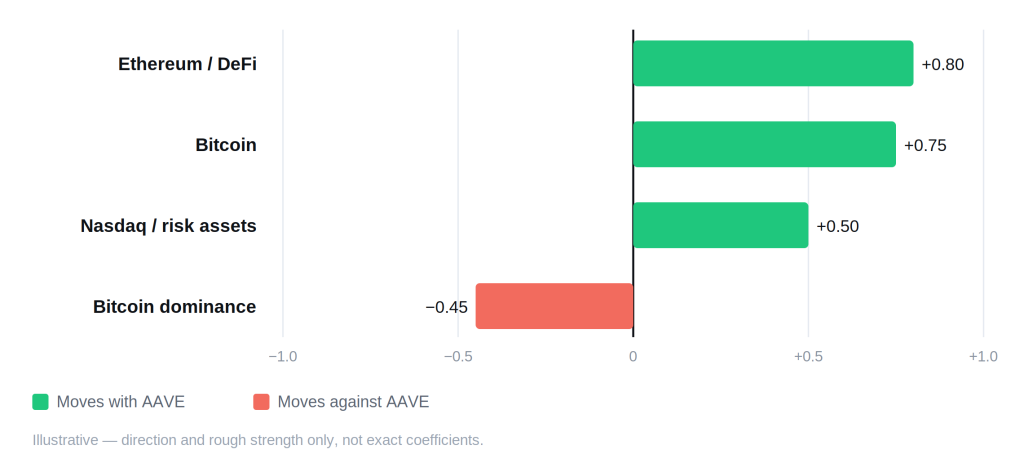
AAVE is an ERC-20 token, and its price rarely strays far from Ethereum, the chain that hosts most of Aave’s activity. Beyond that tether, what sets AAVE apart from a generic altcoin is that its demand tracks the health of DeFi itself: when total value locked across lending markets swells and borrowing picks up, the protocol earns more fees and the token catches a bid; when TVL drains, AAVE tends to fall faster than Bitcoin. It carries high beta to Bitcoin on the way up and down, and it loses ground whenever Bitcoin dominance climbs and capital rotates out of alts. Since crypto institutionalised, AAVE has also leaned on the Nasdaq’s risk-on days, which is why Fed policy reaches it quickly. There is no gold or dollar-index story worth telling for a governance token — the forces that matter are Ethereum, DeFi flows, and appetite for risk.
Fundamental factors
Aave is the largest decentralized lending protocol in crypto, with total value locked in the low tens of billions across roughly 21 chains — enough to have overtaken MakerDAO as DeFi’s biggest lender. Users deposit assets to earn yield or post collateral to borrow, and the protocol takes a cut of the interest. Stani Kulechov launched it as ETHLend in 2017, rebuilt it into a pooled-liquidity model, and rebranded to Aave in 2020.
Three pieces of the token’s economics matter for price. First, GHO, Aave’s own decentralized stablecoin, which has grown past a half-billion in supply and feeds its interest income straight back to the treasury. Second, Aavenomics 3.0, the automated buyback that went live on June 27, 2026: it routes protocol revenue into open-market AAVE purchases at roughly $30 million a year, a standing bid that removes tokens from circulation for as long as the protocol earns. Third, the Safety Module — staking AAVE to backstop the protocol, where staked tokens can be slashed to cover a shortfall in exchange for rewards, locking up supply the same way the buyback does. The long-planned V4 upgrade, with its unified liquidity layer, was still in development in mid-2026 with no confirmed mainnet date.
Upcoming catalysts
Only confirmed, dated events are listed. Because AAVE now tracks risk assets closely, U.S. monetary policy is the clearest near-term driver on the calendar.
| Date | Event | Potential impact |
|---|---|---|
| September 15–16, 2026 | FOMC meeting (with economic projections) | Bull if the Fed signals cuts; bear if it holds higher for longer |
| October 27–28, 2026 | FOMC meeting | Rate path steers risk appetite across DeFi and alts |
| December 8–9, 2026 | FOMC meeting (with economic projections) | Year-end policy signal that frames 2027 positioning |
| 2026 (date not confirmed) | Aave V4 mainnet | Unified liquidity and new risk modules; no launch date announced, so not treated as dated |
FOMC dates come from the Federal Reserve’s published 2026 schedule. Aave V4 is listed without a date because none has been set — pinning it to a guess would be inventing news.
Bull case vs bear case
Bull case:
- The automated buyback keeps absorbing AAVE while protocol revenue holds up, thinning the tradable float.
- GHO adoption climbs and lifts the treasury income that funds those buybacks.
- V4 ships and pulls more deposits and borrowing onto Aave, growing the fees that back the token.
- The Fed cuts, capital rotates back toward DeFi, and TVL across lending markets expands.
Bear case:
- A DeFi-wide risk-off drains TVL, and AAVE falls harder than Bitcoin as a high-beta asset.
- Tighter regulation of on-chain lending or stablecoins hits Aave and GHO directly.
- Bitcoin dominance keeps rising and capital stays out of alts.
- Buyback revenue thins in a bear market, and the standing bid under the price fades.
Invalidation levels. The bull case loses its footing if AAVE closes below $85.12, the deepest of the current supports, around 5% under spot. The bear case is invalidated on a sustained push above $93.38 and, more convincingly, a reclaim of the 200-day average at $100.22 — roughly 11% above the early-August price and the line that would confirm the longer downtrend is over. Both triggers are the levels from the technical read above, not new numbers.
Historical performance
AAVE’s chart is a story of violent cycles, not a steady climb. It ran to $661 in May 2021, gave most of it back in the 2022 bear market, and has spent the years since carving out lower peaks. Its price has tracked the fortunes of DeFi as a whole far more than any single product launch — when lending activity boomed, AAVE boomed; when it froze, the token bled. In August 2026 it again trades near a tenth of its record high and below its own 200-day average.
Is Aave a good investment in 2026?
Whether AAVE fits a portfolio comes down to how much DeFi risk a holder wants and over what horizon. Our numbers see a modest recovery this year — an average near $115 against a spot price around $90 — with the real support coming from mechanics rather than hype: a protocol that now buys its own token with real revenue, a growing stablecoin, and the largest deposit base in on-chain lending. Against that sit fearful sentiment, a price under its long-term average, and the fact that AAVE amplifies every DeFi drawdown. The token is a leveraged bet on decentralized lending winning — attractive if you believe that, punishing if the sector stalls.
How to trade Aave on PrimeXBT
On PrimeXBT you can take a position on Aave in either direction. CFDs on AAVE can be traded long or short, so a falling market is as tradable as a rising one — see the primer on short selling for how that works. Leverage cuts both ways, magnifying losses as readily as gains, so position sizing and a stop-loss matter on every trade. Trade on your own analysis and risk tolerance, and never stake more than you can afford to lose.
Trading involves risk.
How we build this forecast
PrimeXBT’s analysts assemble this outlook rather than copy it from a single feed. We begin with where AAVE trades today, read its position against the 50- and 200-day moving averages and the live support and resistance levels, then weigh what actually drives a lending token — protocol revenue and buybacks, GHO growth, total value locked, and the pending V4 upgrade — against the macro backdrop, chiefly the path of U.S. interest rates. The yearly ranges fold that technical read into the fundamental and macro picture; the decade-out figures lean on trajectory, not precision.
Nothing here is a guarantee. AAVE is volatile, its inputs move week to week, and one regulatory headline or DeFi exploit can override any forecast overnight. Read every figure as a considered estimate rather than a promise — we revisit and update this outlook monthly as the data changes.
How much will Aave be worth in 2026?
PrimeXBT's outlook puts AAVE at an average near $115 for 2026, recovering off its summer lows without reaching a new bull market.
How much will Aave be worth in 2030?
Our 2030 view averages near $235. On a five-year horizon that figure is a direction, not a target, and the plausible spread runs into the hundreds of dollars.
Will Aave reach $1,000?
Not on our numbers. The top of our modelled range peaks near the mid-$200s around 2029, so $1,000 would need a stronger cycle and far higher DeFi adoption than the current picture supports. Some algorithmic models do project it by 2030, but they sit far above the rest.
Is Aave a good investment in 2026?
It depends on appetite for DeFi risk. The case for it rests on real protocol revenue, an automated buyback, and the largest deposit base in on-chain lending; the case against it is fearful sentiment, a price below its long-term average, and AAVE's habit of falling harder than the market in a downturn.
What is driving the Aave price right now?
The standout factor in 2026 is Aavenomics 3.0, the automated buyback live since June that spends protocol revenue on AAVE, alongside growth in the GHO stablecoin and anticipation of the V4 upgrade.
Author



 Risk Disclaimer
The content provided here is for informational purposes only. It is not intended as personal investment advice and does not constitute a solicitation or invitation to engage in any financial transactions, investments, or related activities. Past performance is not a reliable indicator of future results.
The financial products offered by the Company are complex and come with a high risk of losing money rapidly due to leverage. These products may not be suitable for all investors. Before engaging, you should consider whether you understand how these leveraged products work and whether you can afford the high risk of losing your money.
The Company does not accept clients from the Restricted Jurisdictions as indicated in our website/ T&C. Some services or products may not be available in your jurisdiction.
The applicable legal entity and its respective products and services depend on the client’s country of residence and the entity with which the client has established a contractual relationship during registration.