8 min read
What happened last week
On October 29, hackers stole about $6.3 billion from Binance in the largest crypto theft on record. The exchange attributed the attack to North Korea, paused withdrawals and resumed them in phases from November 1. On November 12 it said every affected balance had been replaced from its own funds, using its SAFU reserve, part of the futures insurance fund and the corporate treasury.
Bitcoin has trended lower since. It lost the $70,000 level on November 13, fell below $65,000 on November 14 and touched $62,112 on Sunday, its weakest level since July 14. The measurable drivers are familiar. US spot Bitcoin ETFs lost $1.07 billion in the week to November 13, a second straight week above $1 billion. A hot October CPI moved markets to price a Fed hike in December. Roughly $2 billion of crypto positions were liquidated in 24 hours over the weekend. A louder theory on X blames Binance itself, and the sections below set that claim against the data.
Technical picture: trendline support gives way
Bitcoin fell from around $75,000 at the start of the week to a low near $62,000 on the 4-hour Bitstamp chart and traded at $64,497 at the time of the snapshot. The 14-period RSI dropped to 16.35, the lowest reading on a chart that starts in early October, before recovering to 28.39.
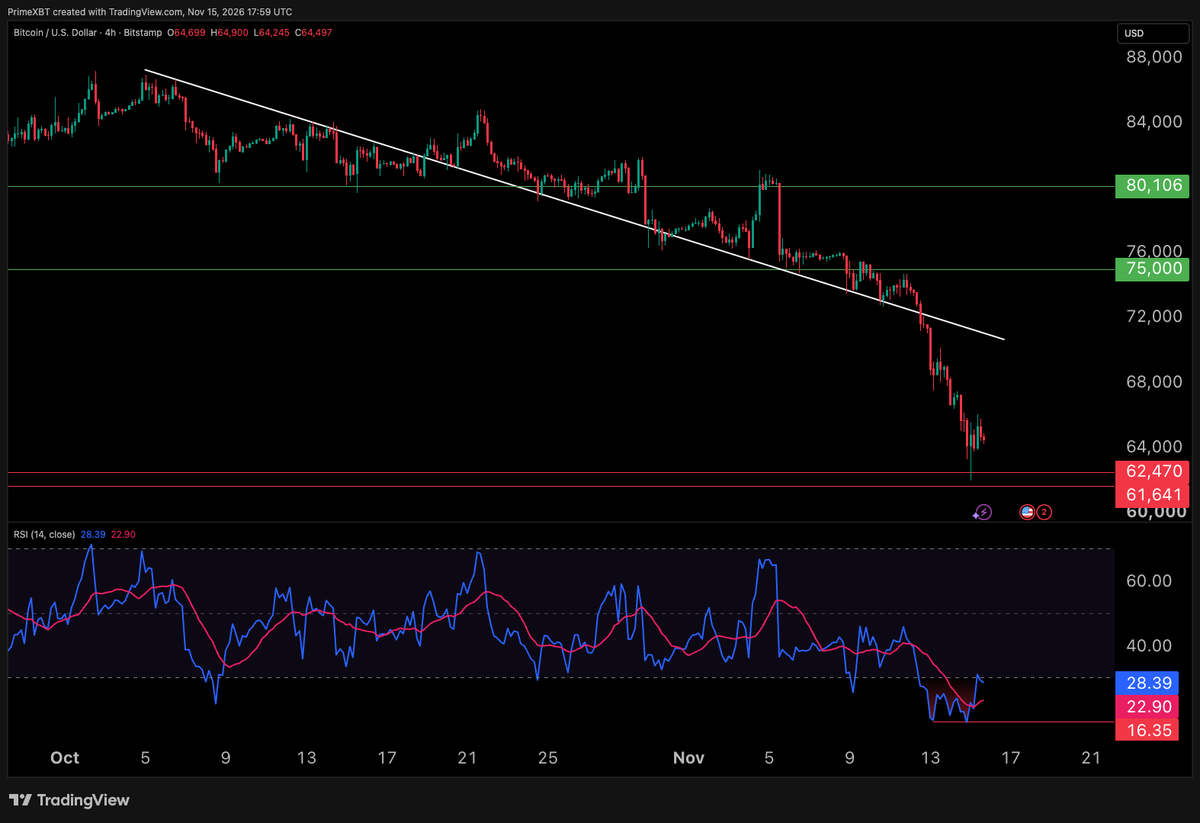
The white trendline drawn from the early October high near $87,000 had acted as a floor since late October: price returned to it several times and bounced. On November 12 to 13 the line gave way near $72,000 and the sell-off accelerated. The low stopped just short of the marked zone at $62,470 to $61,641. If that zone holds, the broken trendline and the $75,000 level are the first resistance areas above. A 4-hour close below $61,641 would leave the round $60,000 level as the next reference.
Crypto heatmap: no green anywhere
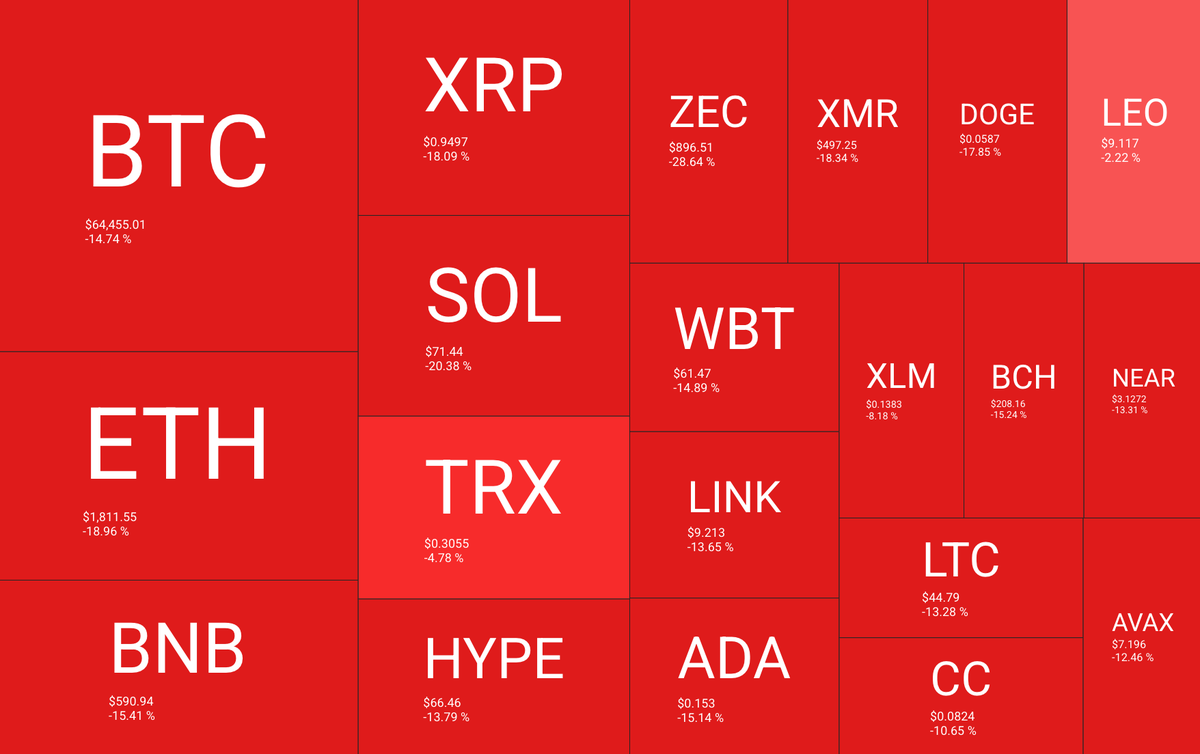
Every large-cap coin on the heatmap is red. Bitcoin is down 14.74% at $64,455, Ethereum 18.96% at $1,811.55 and BNB 15.41% at $590.94. The heaviest losses are in Zcash (down 28.64%), Solana (down 20.38%), Monero (down 18.34%) and XRP (down 18.09%), so privacy coins offered no shelter this time. LEO (down 2.22%) and TRX (down 4.78%) held up best. The snapshot does not show its timeframe.
Source: https://quantifycrypto.com/heatmaps
Altcoin Season Index holds at 48
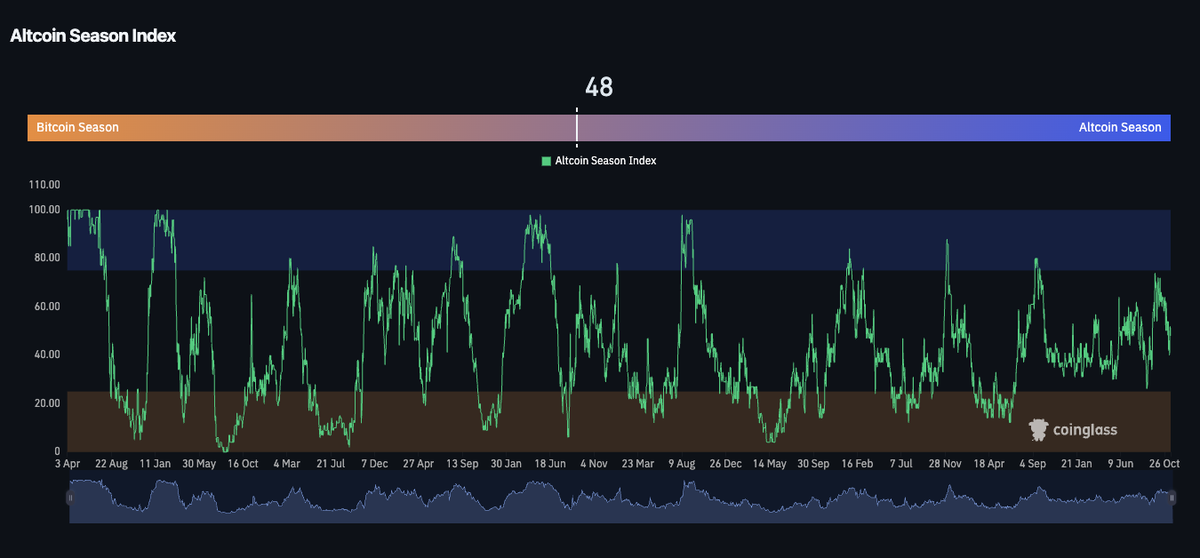
The Altcoin Season Index reads 48, close to the middle of its range and well above the 25 line that marks Bitcoin season. Altcoins fell with Bitcoin, in most cases by more, but not by enough to shift the index into either camp.
Source: https://www.coinglass.com/pro/i/alt-coin-season
On the chart the index has eased from a recent peak near 70. A reading this neutral says the sell-off is market-wide, not a rotation out of altcoins into Bitcoin.
Fear and Greed drops to Extreme Fear at 11
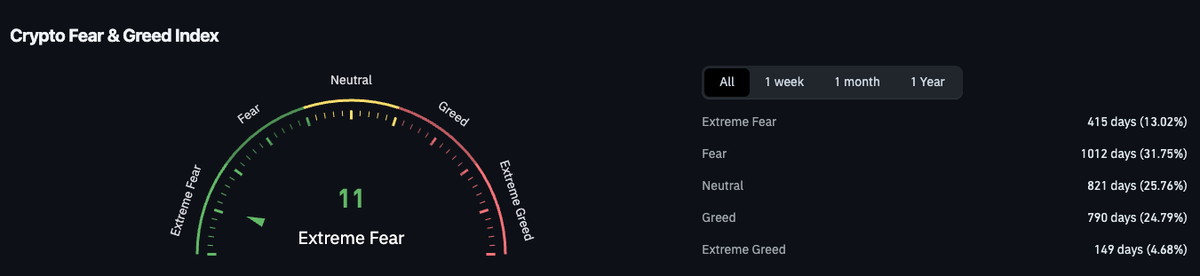
The Crypto Fear and Greed Index stands at 11, Extreme Fear. The alternative.me version of the index printed 13 on Saturday and 10 on Sunday, its lowest in about five months.
Source: https://www.coinglass.com/pro/i/FearGreedIndex
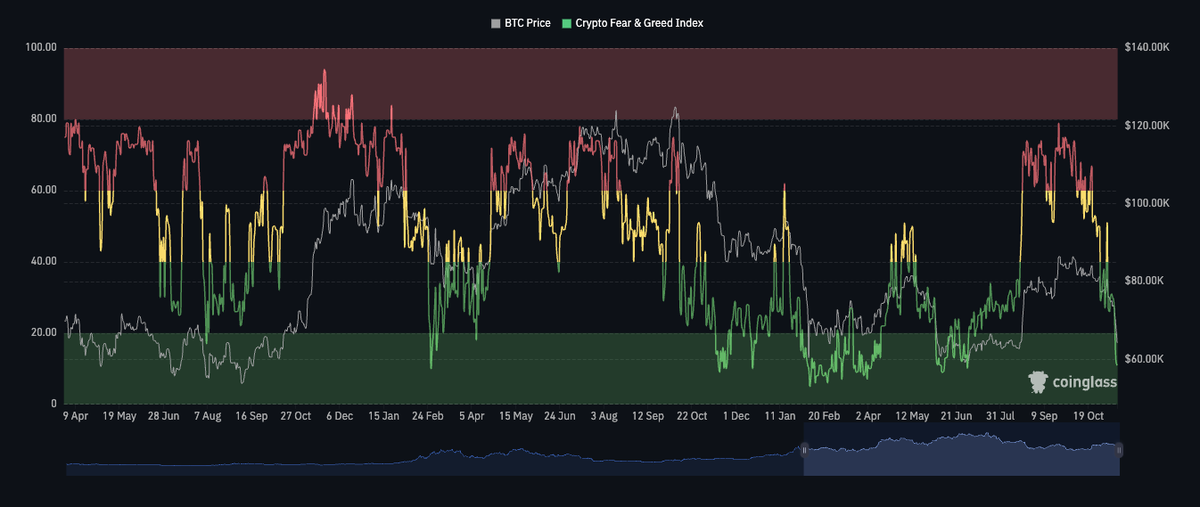
On the history chart the index was last this low during the summer sell-off, and it has fallen from Greed readings near 75 in September. The distribution table shows the market has spent 415 days, or 13.02% of the sample, in Extreme Fear. Such readings have often appeared near local lows, but the February to April stretch on the same chart shows the index can stay below 20 for weeks. A low reading alone is not a timing signal.
Is Binance trading against its users? The claim and the data
After Bitcoin broke $70,000 on November 13, a theory spread on X: Binance is said to be pressuring perpetual futures to hunt long liquidations and patch the hole left by the hack. Supporters point to aggressive selling on perps while spot held up better, and to a market that has looked weaker than equities since October 29.
The footprint chart shows the kind of move behind the claim. In a single one-minute bar on the Binance BTC perpetual, volume reached $698.2 million across about 103,000 trades, with a net delta of minus $211.4 million. Price dropped from about $68,200 to roughly $67,450 and returned to the $68,100 area within minutes.
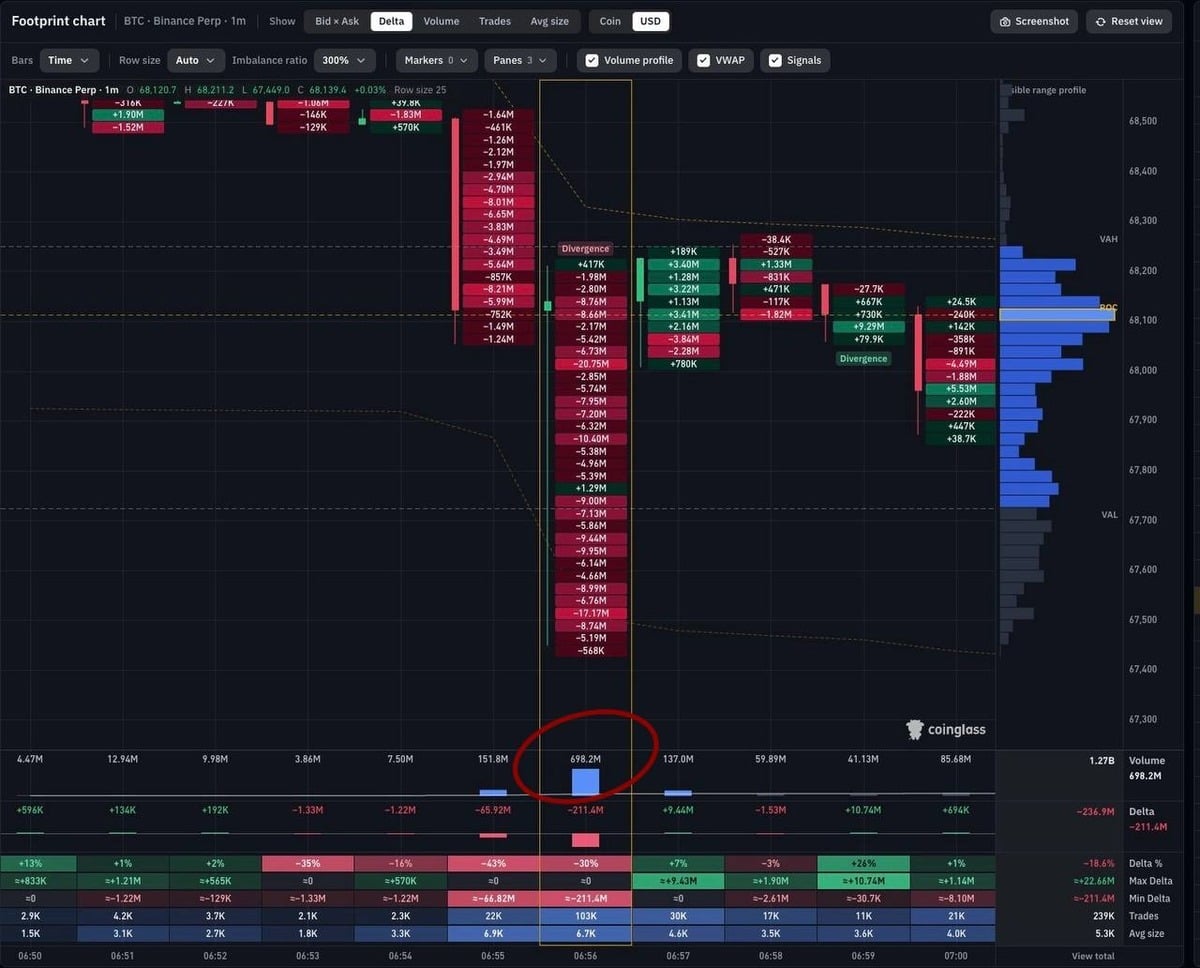
A flush and rebound of this kind is consistent with a large long position being liquidated, but the chart cannot show who was on the other side. The evidence against the theory is concrete. Binance says it covered the full $6.3 billion from its own reserves, founder Changpeng Zhao has denied that the exchange sold crypto, and one exchange-flow analysis put the heaviest net spot selling on Coinbase, at $1.08 billion. The claim remains unproven.
Profit and loss supply move toward convergence
Glassnode’s Profit vs Loss chart shows the two supply lines closing in on each other. Supply in profit has dropped to roughly 10.5 million BTC, while supply in loss has climbed to about 9.6 million BTC.
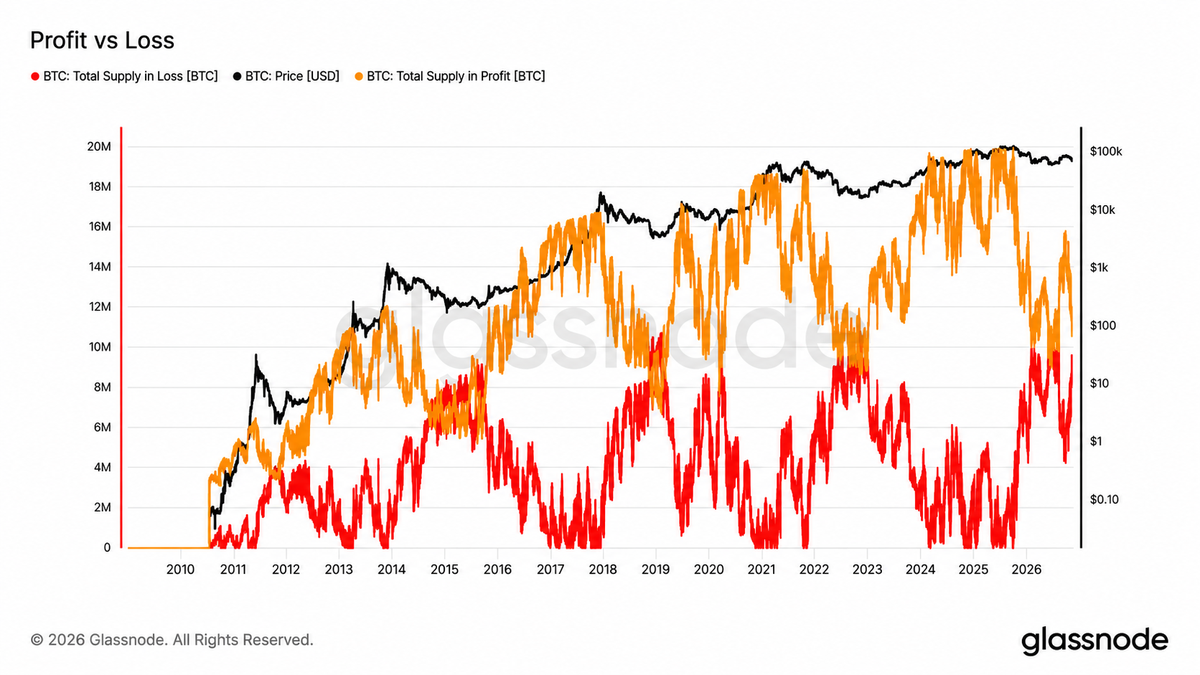
On the same chart the lines met or crossed in 2015, early 2019 and late 2022, each time close to a cycle low, which is why the signal is watched as a bottoming marker. They have not met in this cycle: they came close earlier in 2026 and then diverged again as price recovered. If price keeps falling, a crossover would put more coins in loss than in profit for the first time since 2022. Until that happens, the chart points to stress, not to a confirmed bottom.
Stablecoin supply shrinks by $17 billion
Glassnode data shows the total supply of the largest stablecoins fell by $17.1 billion over the past 30 days, the fastest contraction since June 2022, when the 30-day change reached about minus $29 billion. The firm’s weekly report on November 11 put the figure at $14.2 billion, so the outflow has accelerated.
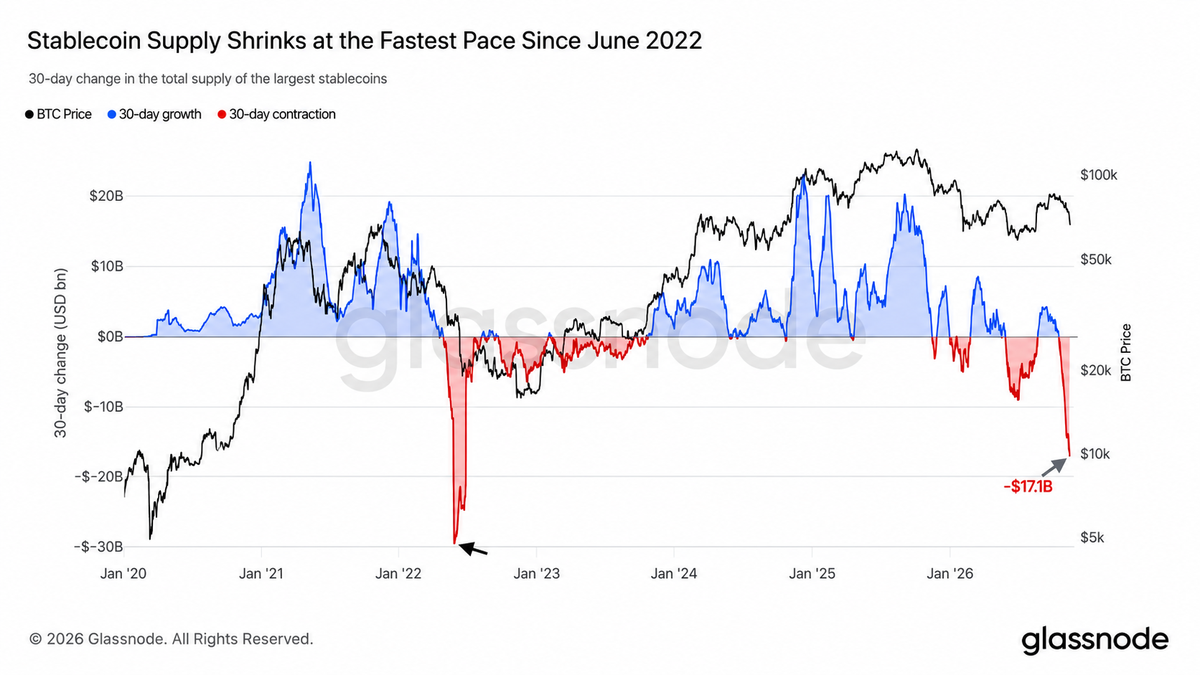
Stablecoins are the cash of the crypto market. When holders redeem them for fiat, less capital is left on the sidelines to absorb selling, and Bitcoin has fallen alongside the drain. The chart shows the pace of the outflow, not its end. A turn back toward zero in the 30-day change would be the first sign that the drain is slowing.
Liquidation map: short leverage stacks above price
The 30-day CoinGlass liquidation map, taken at $64,593, is heavily one-sided. Cumulative short liquidation leverage builds to roughly $8.9 billion up to $78,104, against about $1.2 billion of cumulative long leverage down to $55,055. The largest single cluster sits near $76,466, at about $400 million.
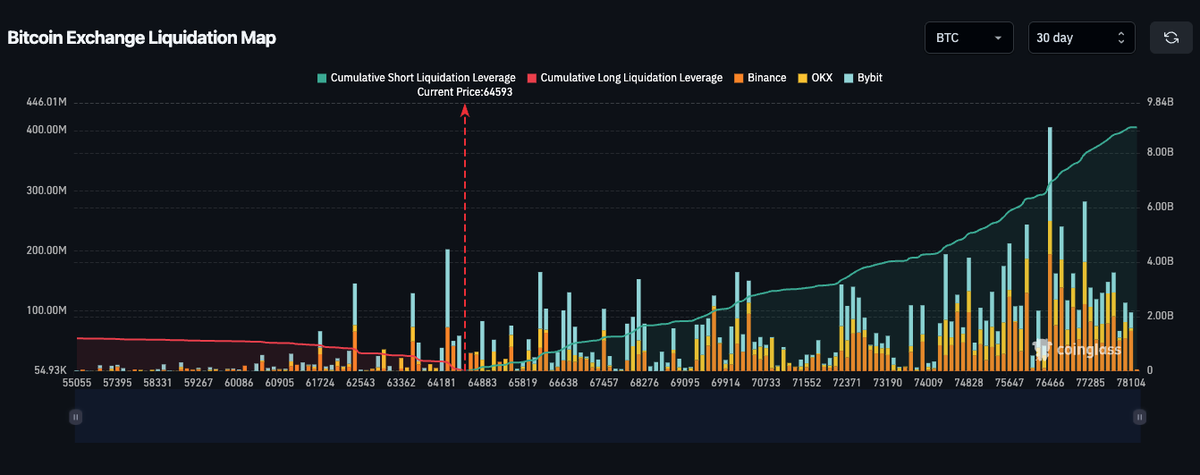
Source: https://www.coinglass.com/pro/futures/LiquidationMap
Most long leverage near price was cleared on the way down, which is why little remains below. A short-heavy map is not a floor: spot selling and ETF outflows can still push price lower. If Bitcoin rebounds, short liquidations between $66,000 and $70,000 could add fuel to the move. Below the market, the visible long clusters sit near $64,200 and $62,500.
Conclusion
Bitcoin ends the week near $64,500 after breaking its trendline support, with sentiment at Extreme Fear, ETF outflows above $1 billion for a second week and stablecoin supply shrinking at the fastest pace since 2022. The Binance theory is unproven, and the measurable pressure comes from capital leaving the market. The $62,470 to $61,641 zone is the level to watch. With leverage skewed and liquidity thin, position sizing and stops matter more than usual.
Trading involves risk.
Author



 Risk Disclaimer
The content provided here is for informational purposes only. It is not intended as personal investment advice and does not constitute a solicitation or invitation to engage in any financial transactions, investments, or related activities. Past performance is not a reliable indicator of future results.
The financial products offered by the Company are complex and come with a high risk of losing money rapidly due to leverage. These products may not be suitable for all investors. Before engaging, you should consider whether you understand how these leveraged products work and whether you can afford the high risk of losing your money.
The Company does not accept clients from the Restricted Jurisdictions as indicated in our website/ T&C. Some services or products may not be available in your jurisdiction.
The applicable legal entity and its respective products and services depend on the client’s country of residence and the entity with which the client has established a contractual relationship during registration.