8 min read
Stocks Post Their Best Week Since August
The S&P 500 closed at 7,561.67 on Friday, up 2.5% for the week, its first weekly gain in five and its largest since August. Chipmakers led the rebound even as Nvidia fell after its CEO resigned, and all eleven sectors finished higher despite a hot October CPI. Wednesday’s 7,619.38 was the high close before a two-day pullback in technology. Ahead are US retail sales on Tuesday, the Fed minutes on Wednesday and Nvidia earnings during the week.
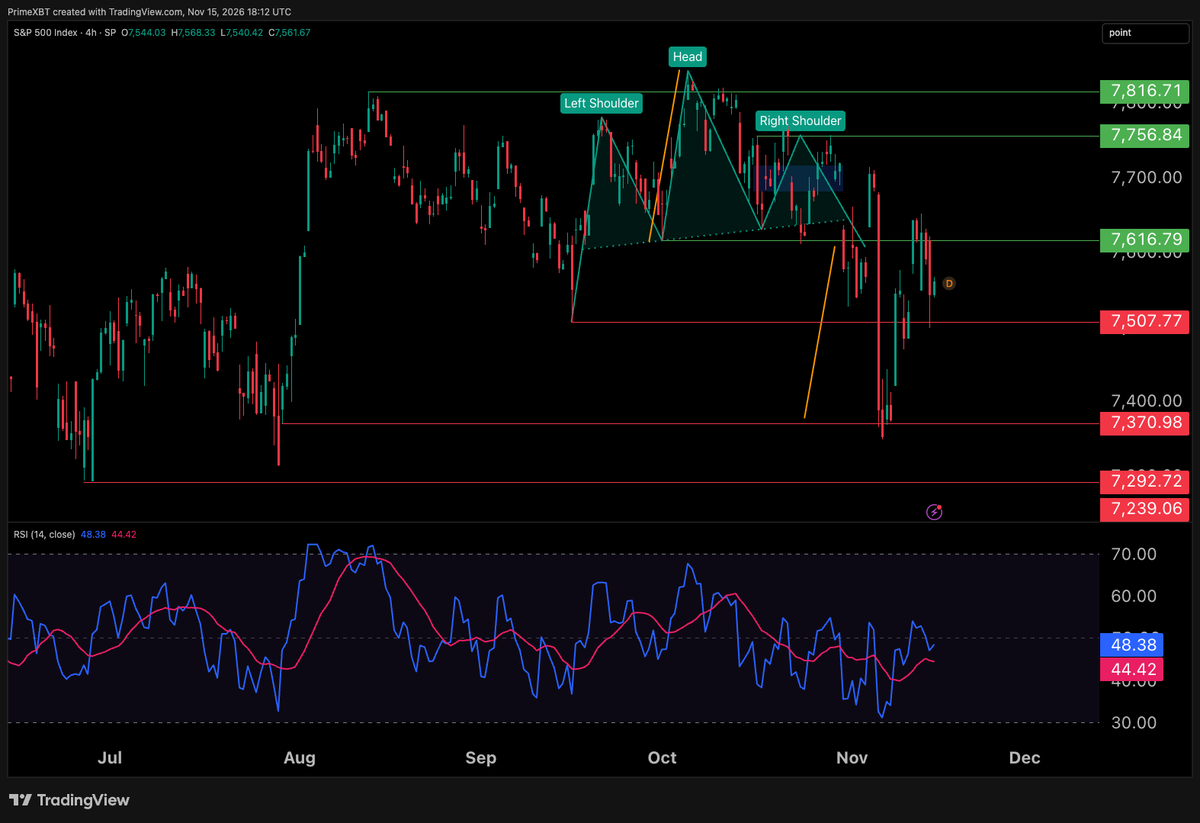
On the chart, the S&P 500 has completed the head and shoulders it broke at the start of November: the decline from the 7,616.79 neckline area reached 7,370.98, in line with the drawn projection, before the rebound. Friday’s dip was bought at 7,507.77 and the 4-hour RSI is neutral at 48.38. Holding 7,507.77 keeps a retest of 7,616.79 in view, and a close above it would open 7,756.84. A break below 7,507.77 would bring 7,370.98 back into focus.
Oil Falls for a Second Week on Surplus Signals
WTI crude settled at $88.56 on Friday, down 2.5% for the week after a 13% slide the week before. An IEA report pointing to a growing global surplus and a rise in US inventories weighed on prices, while Washington’s choice to keep its blockade on Iran instead of escalating trimmed the risk premium. Attacks on shipping remain a supply risk. The market now watches weekly US stock data and any shift in the Iran standoff.
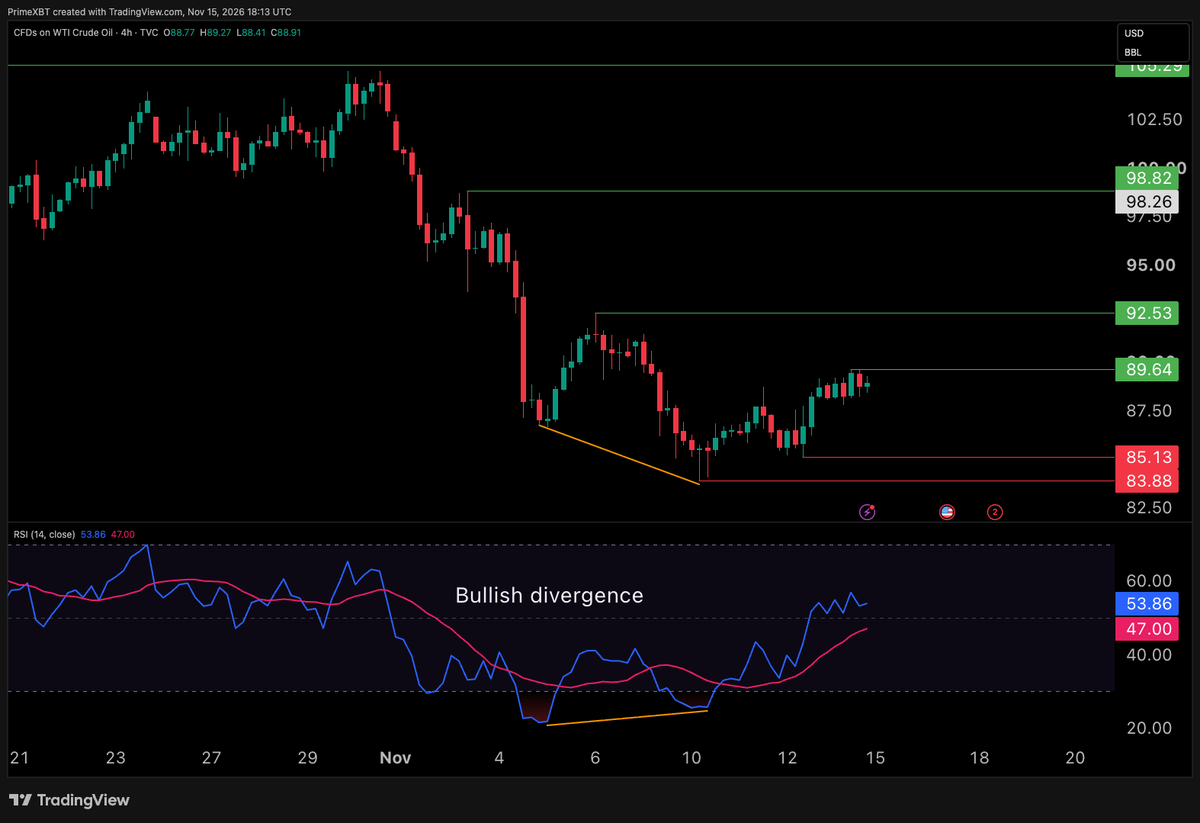
On the chart, the WTI crude CFD trades at $88.91, slightly above the futures settlement. Price made a lower low at $83.88 while the RSI made a higher low, a bullish divergence, and the rebound now tests $89.64. A close above it would open $92.53. If the level rejects, $85.13 and $83.88 are the supports, and a break of $83.88 would resume the downtrend.
Canadian CPI (Monday)
Canada reports October inflation on Monday at 13:30 GMT. September’s headline rose to 3.1% y/y from 3.0%, and the Bank of Canada raised rates by 25 bps in October. Consensus sees 3.2% y/y and 0.3% m/m, with Scotiabank at 3.3%. Money markets price about a 60% chance of another hike on December 9. A hotter print would firm up that pricing and could support the Canadian dollar, while a softer one could lift USD/CAD.
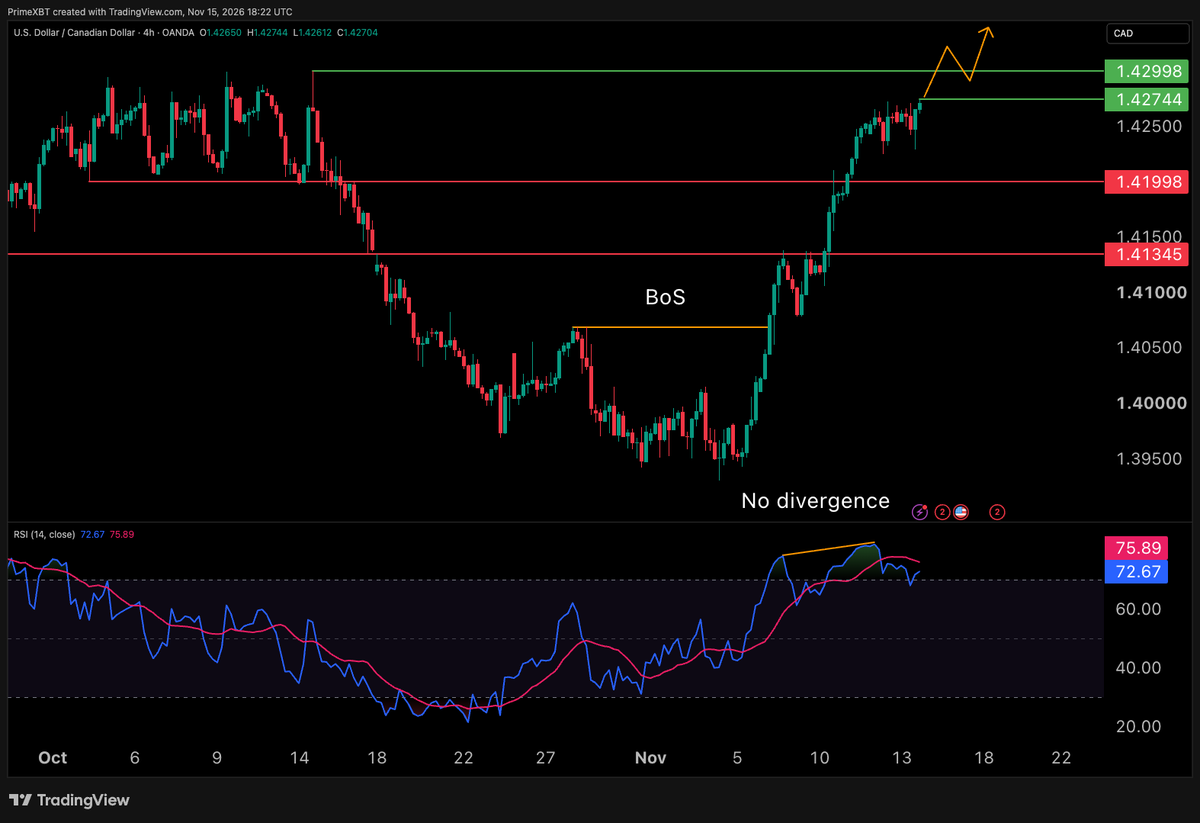
On the chart, USD/CAD has rallied from below 1.3950 to 1.4270 in under two weeks, with a break of structure near 1.4070 on the way. The RSI at 72.67 is overbought but has made higher highs with price, so there is no bearish divergence. Price sits at 1.42744, just under the October high at 1.42998. A close above 1.42998 would confirm the breakout drawn on the chart, while a pullback would find 1.41998 and 1.41345 as supports.
US Retail Sales (Tuesday)
US retail sales for October are due on Tuesday at 13:30 GMT. September sales jumped 0.8% m/m, helped by a 6.4% rise at gasoline stations, and the dollar has since climbed as markets priced a December Fed hike. Forecasts point to a slowdown to 0.2%, with the control group at 0.4% after 0.1%. A stronger number would back the hike case and could weigh on EUR/USD, while a miss could give the euro some relief.
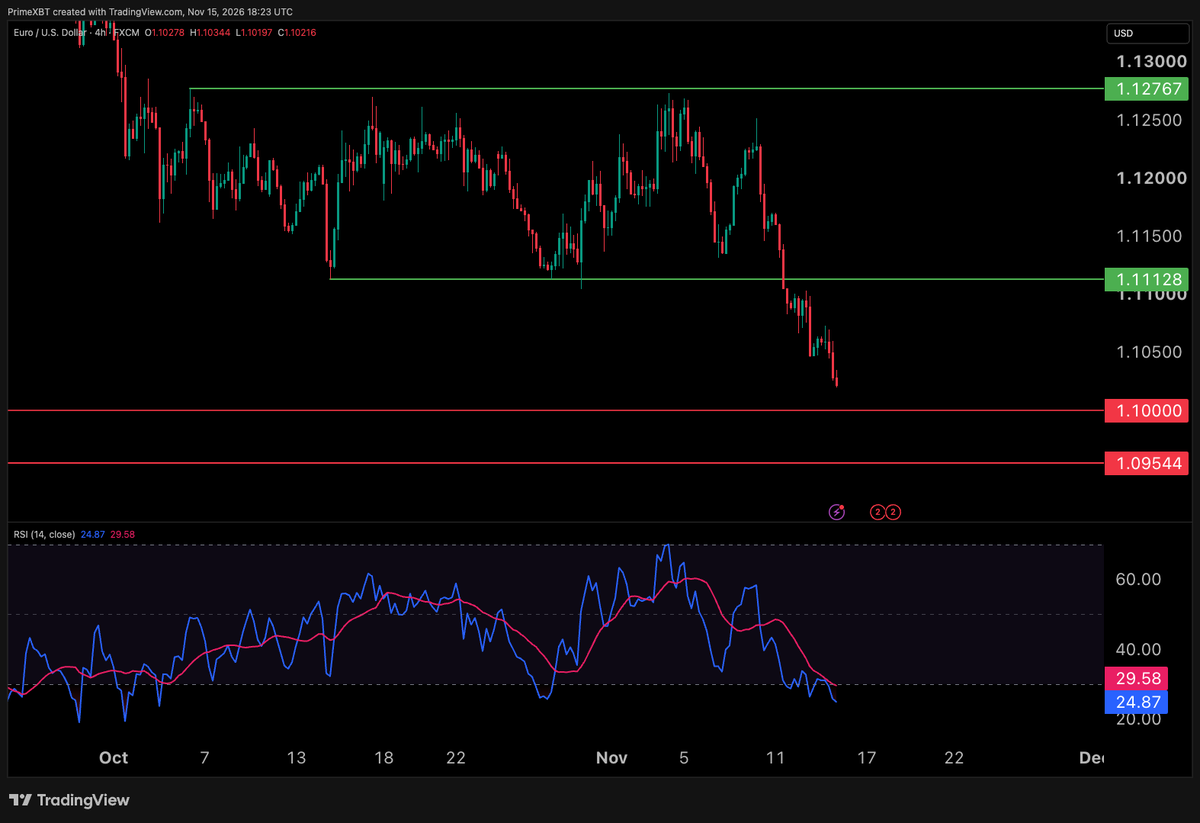
On the chart, EUR/USD has broken down from the 1.11128 to 1.12767 range that held since early October and trades at 1.1022. The next marked supports are the round 1.10000 level and 1.09544. The RSI at 24.87 is oversold, so a pause or a retest of 1.11128, now resistance, is possible. A close below 1.10000 would shift attention to 1.09544.
UK CPI (Wednesday)
UK inflation for October is released on Wednesday at 07:00 GMT. September’s 3.5% y/y beat the 3.4% forecast and fed expectations of a hike, which the Bank of England delivered on November 5, lifting its rate to 4.00%. No market consensus is published yet; the Bank projects 3.7%, with core at 2.9% and services at 3.9%. A reading above that path would strengthen the case for a December 17 move and could support GBP/USD, while a softer one could weigh on it.
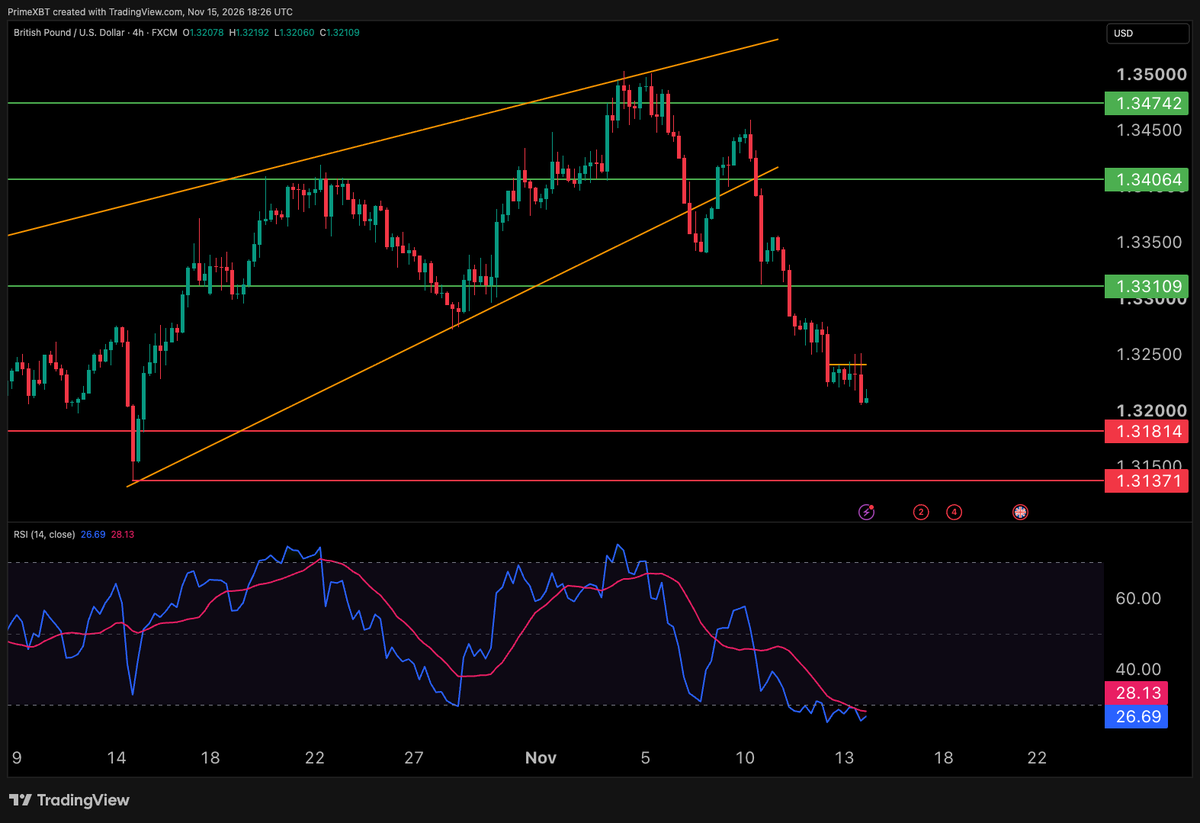
On the chart, GBP/USD broke below the lower line of its rising wedge early last week and has since lost 1.34064 and 1.33109. Price trades at 1.3211 after Friday’s range near 1.3240 gave way, and the RSI at 26.69 is oversold. The marked supports are 1.31814 and 1.31371, the base of the wedge. A recovery above 1.33109 would be needed to ease the pressure.
FOMC Minutes (Wednesday)
The minutes of the October 28 Fed meeting are published on Wednesday at 19:00 GMT. The Fed held rates at 3.75% to 4.00% in a 10 to 2 vote, with both dissenters favouring a hike, and October CPI has since come in hot. Gold lost more than 4% last week and hit a 13-month low near $3,852 as the dollar strengthened. Hawkish detail on how close the majority was to hiking could add pressure on gold, while a cautious tone could ease it.
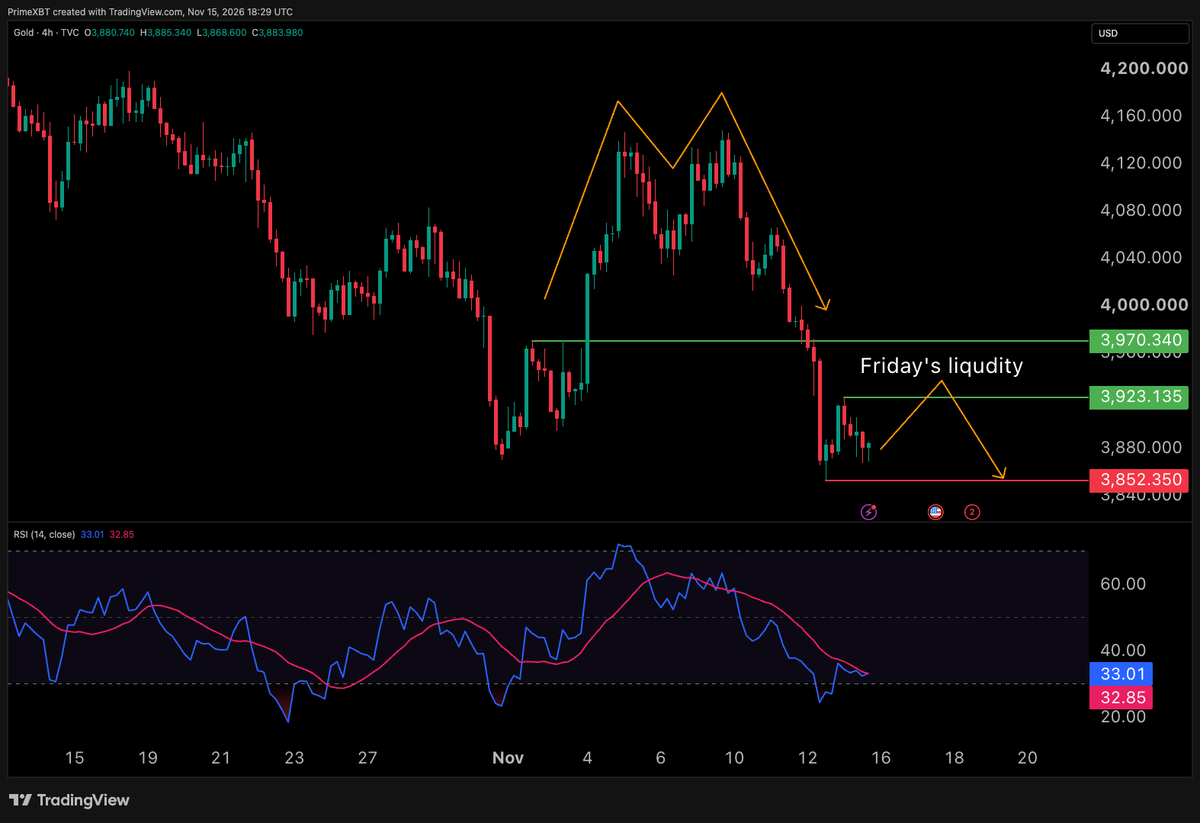
On the chart, Gold completed a double top near $4,140 and fell through $3,970.34 to a low of $3,852.35. Price trades at $3,883.98 with the RSI at 33.01. Friday’s high at $3,923.14 marks resting liquidity. If price sweeps that level and turns lower, a retest of $3,852.35 comes into view. A sustained move above $3,923.14 would open $3,970.34, the broken support.
Australian Employment (Thursday)
Australia’s October labour force report is due on Thursday at 00:30 GMT. September unemployment held at 4.7% against a 4.6% forecast, and the RBA has since raised its unemployment projections. Economists expect the rate to stay at 4.7%, with NAB looking for more than 20,000 new jobs. Stronger hiring would keep another RBA hike in play and could support AUD/USD, while a rise in unemployment would cool those expectations and could weigh on the pair.
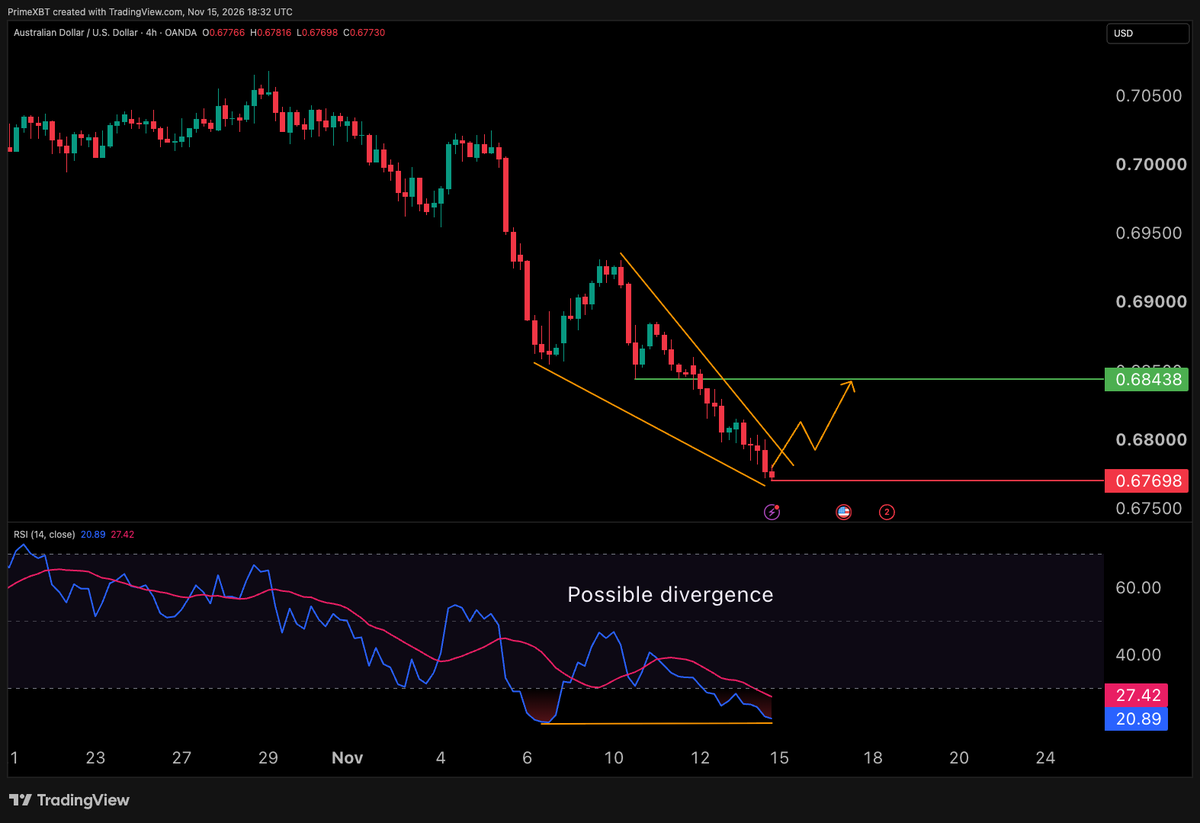
On the chart, AUD/USD is compressing inside a falling wedge and trades at 0.6773, just above the 0.67698 low. The RSI at 20.89 is deeply oversold and sits level with its early November low while price is much lower, a possible bullish divergence that is not yet confirmed. A break above the wedge’s upper line would point to the marked 0.68438 level. A close below 0.67698 would invalidate the setup.
Bottom line
Two inflation reports, US retail sales and the Fed minutes land on a market where the dollar is stretched: EUR/USD, GBP/USD and AUD/USD are oversold on the 4-hour chart, while USD/CAD is overbought. Oversold readings can persist when data supports the trend, so the marked levels matter more than the indicator. Keep position sizes modest around the releases and define the exit before each print.
Trading involves risk.
Author



 Risk Disclaimer
The content provided here is for informational purposes only. It is not intended as personal investment advice and does not constitute a solicitation or invitation to engage in any financial transactions, investments, or related activities. Past performance is not a reliable indicator of future results.
The financial products offered by the Company are complex and come with a high risk of losing money rapidly due to leverage. These products may not be suitable for all investors. Before engaging, you should consider whether you understand how these leveraged products work and whether you can afford the high risk of losing your money.
The Company does not accept clients from the Restricted Jurisdictions as indicated in our website/ T&C. Some services or products may not be available in your jurisdiction.
The applicable legal entity and its respective products and services depend on the client’s country of residence and the entity with which the client has established a contractual relationship during registration.