8 min read
 Technical picture: holding above $82,833
Bitcoin printed $87,374 on September 21, its highest level since January, after a six-day run from below $75,000. Spot ETF inflows of more than $2 billion across a few sessions and a squeeze in short positions did the heavy lifting. Price then pulled back and found support at $82,833, the old range high, and now trades at $84,468.
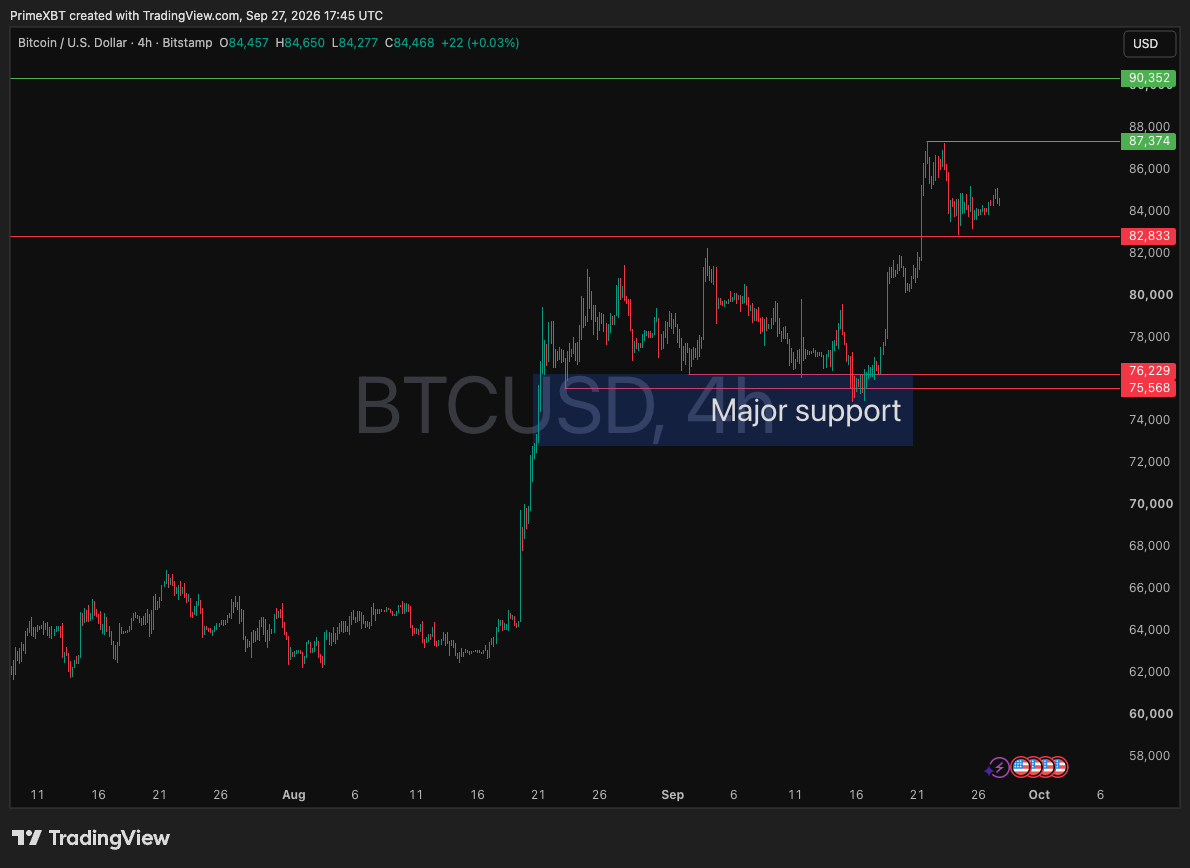
Two scenarios frame the week. A 4-hour close above $87,374 opens the path toward $90,352, the next marked resistance. Failure to reclaim that high keeps Bitcoin in a correction, and a loss of $82,833 would bring the $75,568-76,229 major support zone back into view. So far the pullback reads as a healthy cool-down: price is holding the breakout level rather than slipping back into the old range.
Crypto heatmap: mid-caps take the lead
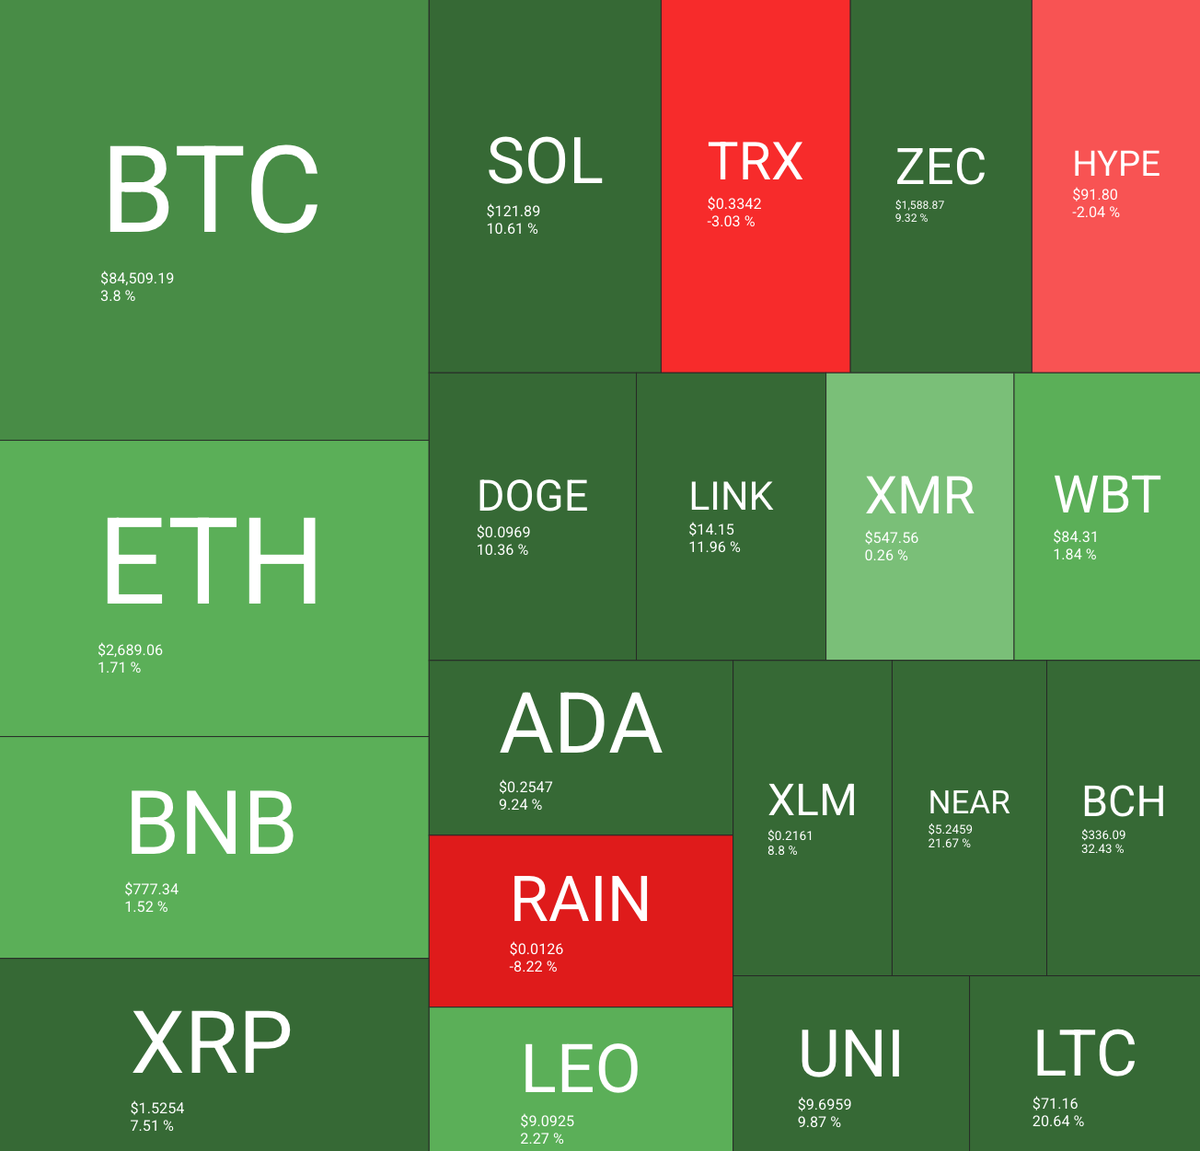
The weekly heatmap turned almost entirely green. Bitcoin added 3.8% to $84,509, while Ethereum (+1.71%) and BNB (+1.52%) lagged. Only three names on the map closed lower: TRX (-3.03%), HYPE (-2.04%) and RAIN (-8.22%).
Source: https://quantifycrypto.com/heatmaps
Leadership came from mid-caps. Bitcoin Cash led with +32.43% after CME announced BCH futures for October 19, pending regulatory review, on top of Grayscale’s filing to convert its BCH trust into an ETF. NEAR gained 21.67% and Litecoin 20.64% on rising network activity. Chainlink (+11.96%), Solana (+10.61%) and Dogecoin (+10.36%) also outpaced Bitcoin by a wide margin, the rotation the Altcoin Season Index picks up next.
Altcoin Season Index climbs to 72
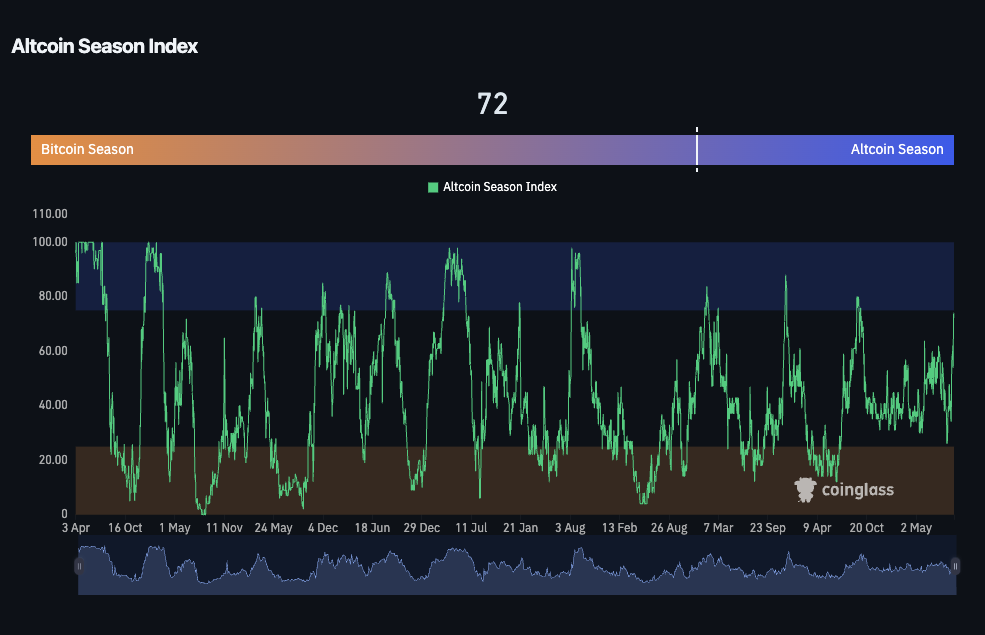
The Altcoin Season Index jumped to 72 from 58 a week earlier, its highest reading since the late-2025 spike toward 80. A reading of 75 or above marks a formal altcoin season, so the index sits three points from the threshold.
Source: https://www.coinglass.com/pro/i/alt-coin-season
Three forces pushed it up: CME listings that gave mid-caps an institutional narrative, the broad rotation visible in the heatmap above, and Bitcoin’s pause below $87,374, which freed capital to chase higher beta. If Bitcoin consolidates rather than breaks down, the index has room to cross 75. The caveat is that a sharp Bitcoin drop has historically hit altcoins harder, and the index can reverse as fast as it rose.
Fear and Greed Index holds in Greed
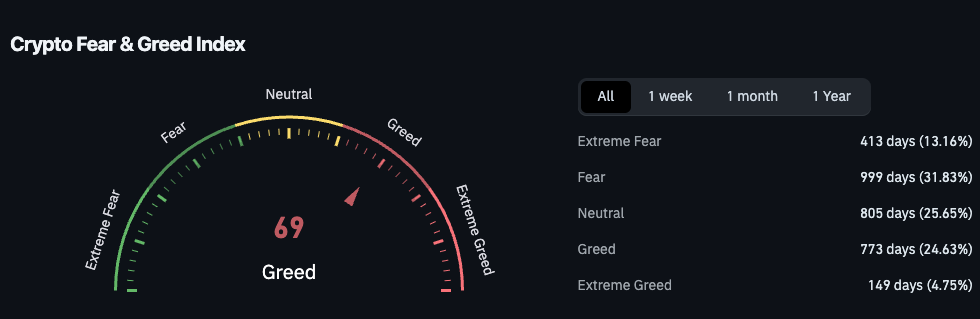
The Crypto Fear and Greed Index reads 69, in Greed, after peaking near 79 during the rally, just below the Extreme Greed line at 80.
Source: https://www.coinglass.com/pro/i/FearGreedIndex
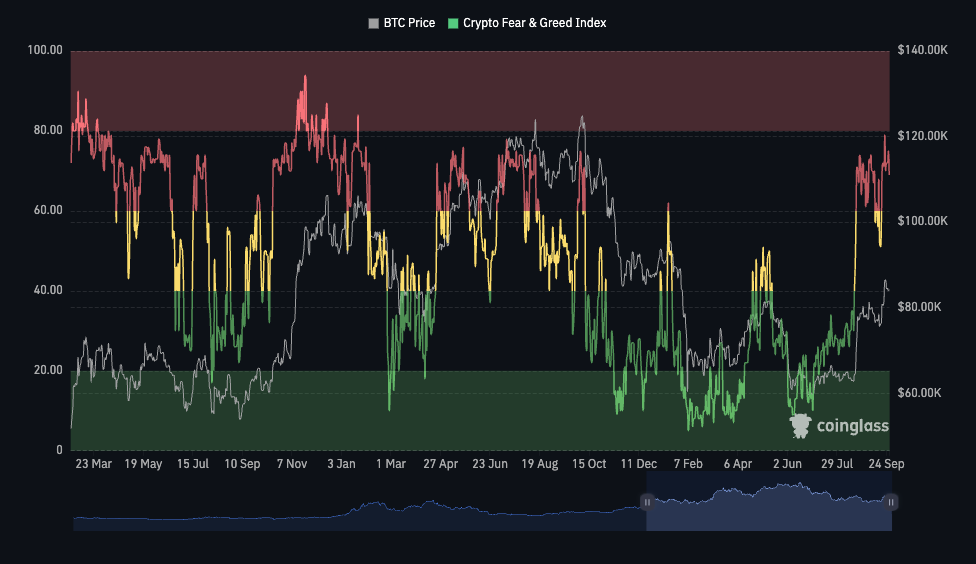
That resilience cuts both ways. Price has pulled back about 3.3% from the high, yet sentiment barely moved: the crowd is staying in the market rather than de-risking. Across the index’s full history, Greed or Extreme Greed readings appear on 29.4% of days, so 69 is elevated but not extreme. Durable lows usually form when fear flushes out late longs, and this pullback has not produced that flush yet. Until sentiment resets, the risk of another leg lower stays elevated.
10-year yields at a 19-year high
The 10-year Treasury yield peaked at 5.228% last week, its highest since 2007, the year before the global financial crisis. The drivers stack up: a Fed that hiked to 3.75%-4.00% on September 16 and signalled more, strong PMI data, weak demand at the five-year auction, oil-driven inflation and deficits that keep Treasury supply heavy.
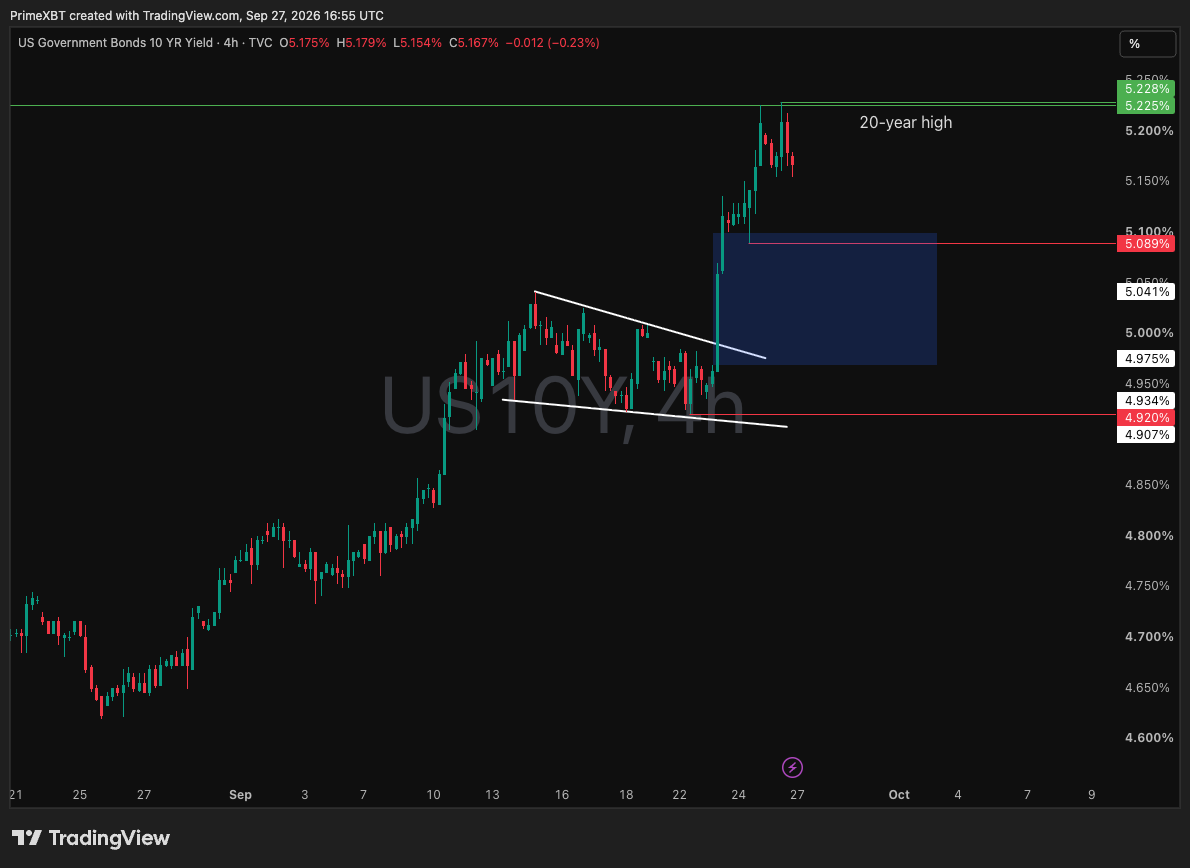
For risk assets, a 5%-plus risk-free return raises the bar for everything else. Bitcoin pays no yield, so every basis point makes holding it more expensive in relative terms, and Bitcoin’s slide to $82,833 came as yields made their final push to the high. A pullback toward the 4.975-5.10% imbalance on the chart would ease the pressure on Bitcoin and equities alike. A break above 5.228% would tighten financial conditions further and test the rally’s staying power.
Binance records its largest outflow since 2023
On September 25, more than 13,800 BTC left Binance in a single day, the largest net outflow since 2023. Over four days the exchange’s reserves fell by roughly 20,000 BTC, from about 705,000 to 685,000. CryptoQuant analyst Darkfost tied the move to late buyers: “Such a sudden development suggests a wave of FOMO among latecomer investors, particularly those who were expecting Bitcoin to drop further.”
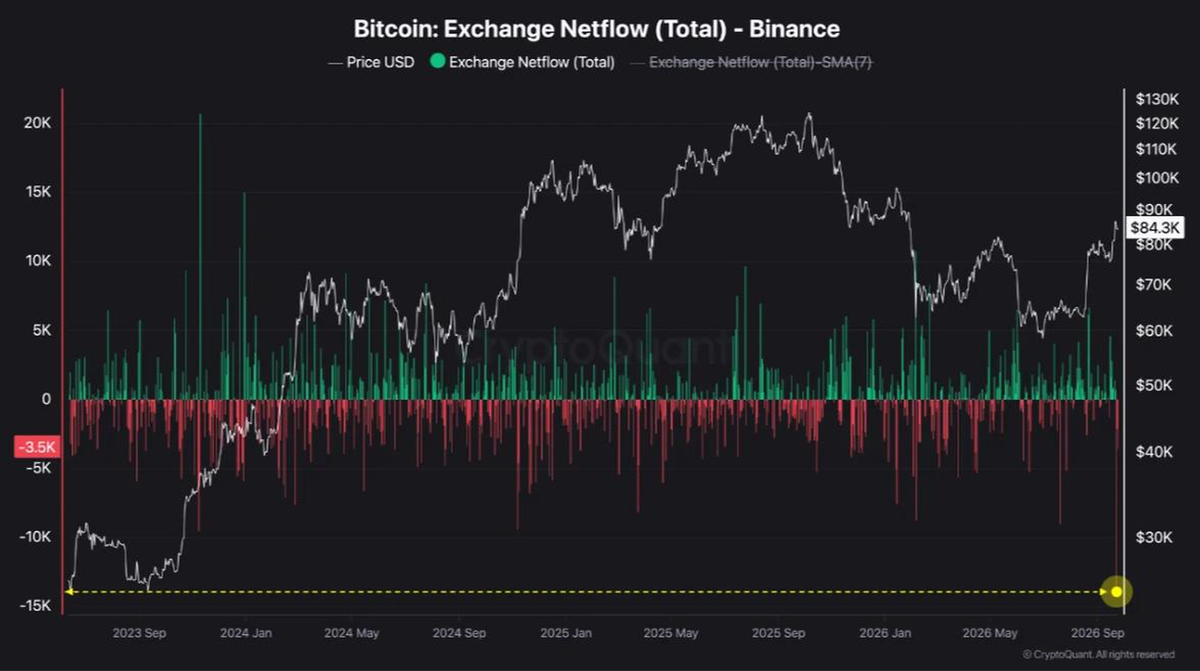
Coins leaving exchanges usually move to self-custody, which shrinks the supply immediately available for sale. That is constructive. The FOMO framing is the caveat: these are buyers who waited through the lows and chased the move above $84,000, the same late cohort the sentiment section above flags as reluctant to de-risk.
Spot demand recovers from the bottom
CryptoQuant’s 30-day demand gauge shows a split market. Perpetual futures demand is positive at around +54,000 BTC, while spot demand is still negative near -180,000 BTC, though it has started to climb off its low. CryptoQuant’s read: “The trend is shifting toward the positive. If the current momentum persists, spot demand will also flip to positive.”
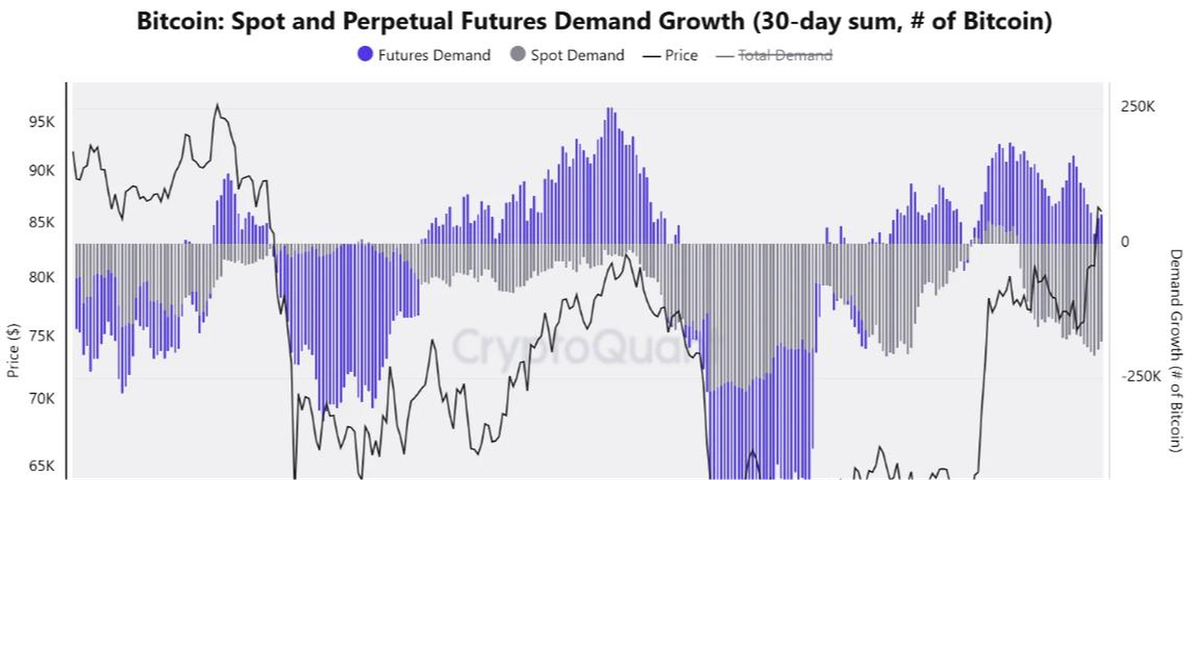
The split matters. A rally carried by futures is more fragile than one carried by spot, because leveraged positions unwind fast when price turns. The Binance outflows above are an early sign that spot buyers are returning. If spot demand crosses zero while futures stay positive, the rally would rest on a firmer base. If it stalls below zero, the liquidation map that follows shows where an unwind could run.
Bitcoin liquidation map
The 30-day liquidation map is lopsided. Cumulative long liquidation leverage below the current $84,526 builds to nearly $10 billion by $74,705, against roughly $3.6 billion of short leverage up to $93,961. The only meaningful short cluster sits just above price, near $85,000.
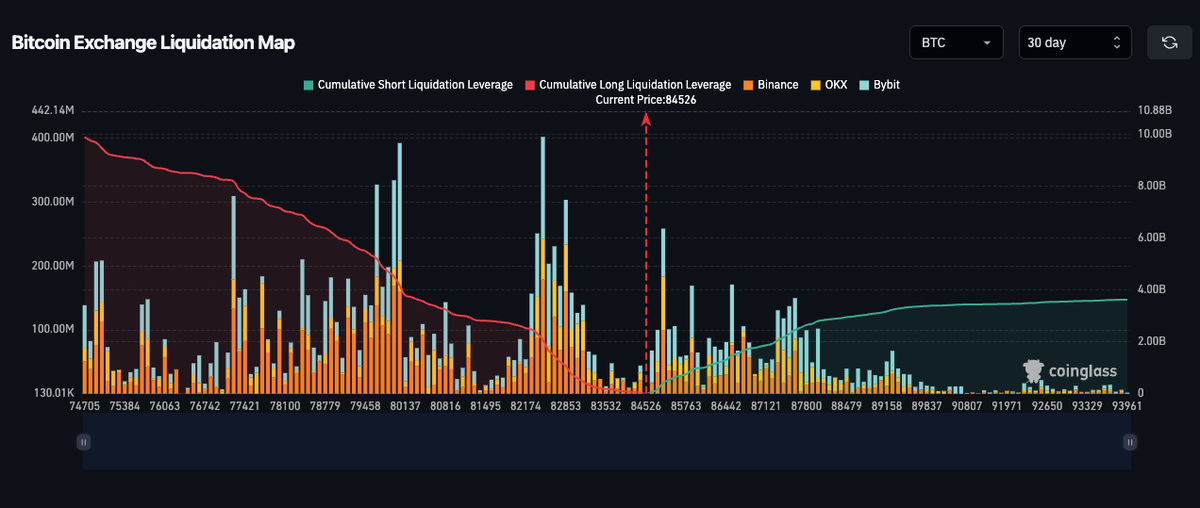
Source: https://www.coinglass.com/pro/futures/LiquidationMap
That is a classic setup for a stop run. If Bitcoin sweeps the shorts near $85,000 and then reverses sharply, the dense long clusters around $82,500 and $80,000 come into play, each holding bars close to $400 million.
Conclusion
Bitcoin enters the week holding its breakout above $82,833 but without a clean reset. Sentiment sits at 69, the liquidation map is heavy with longs below price, and 10-year yields near 5.2% weigh on every risk asset. On the other side, Binance outflows hit a three-year high, spot demand is recovering and altcoins are broadening the rally.
The healthiest path would be a flush into the $82,500-80,000 long clusters that shakes out late buyers and pulls sentiment back toward neutral. If that happens while spot demand keeps improving, a run into the November 3 midterm elections would rest on far firmer ground than it does at $84,000 today. A 4-hour close above $87,374 without that reset keeps the uptrend intact, but on thinner footing. Wednesday’s PCE and Friday’s payrolls set how much room yields leave for either path.
Trading involves risk.
Author



 Risk Disclaimer
The content provided here is for informational purposes only. It is not intended as personal investment advice and does not constitute a solicitation or invitation to engage in any financial transactions, investments, or related activities. Past performance is not a reliable indicator of future results.
The financial products offered by the Company are complex and come with a high risk of losing money rapidly due to leverage. These products may not be suitable for all investors. Before engaging, you should consider whether you understand how these leveraged products work and whether you can afford the high risk of losing your money.
The Company does not accept clients from the Restricted Jurisdictions as indicated in our website/ T&C. Some services or products may not be available in your jurisdiction.
The applicable legal entity and its respective products and services depend on the client’s country of residence and the entity with which the client has established a contractual relationship during registration.