5 min read
 Bitcoin has been rejected at a level it hasn’t traded above since May, easing back after a week that delivered its biggest gain in around three years and a sixth consecutive day of inflows into US spot Bitcoin funds. The next 48 hours are heavy, with July core Personal Consumption Expenditures (PCE) landing this morning, Nvidia’s results after the US close and the new Fed chair’s first Jackson Hole keynote on Friday.
The 4-hour chart
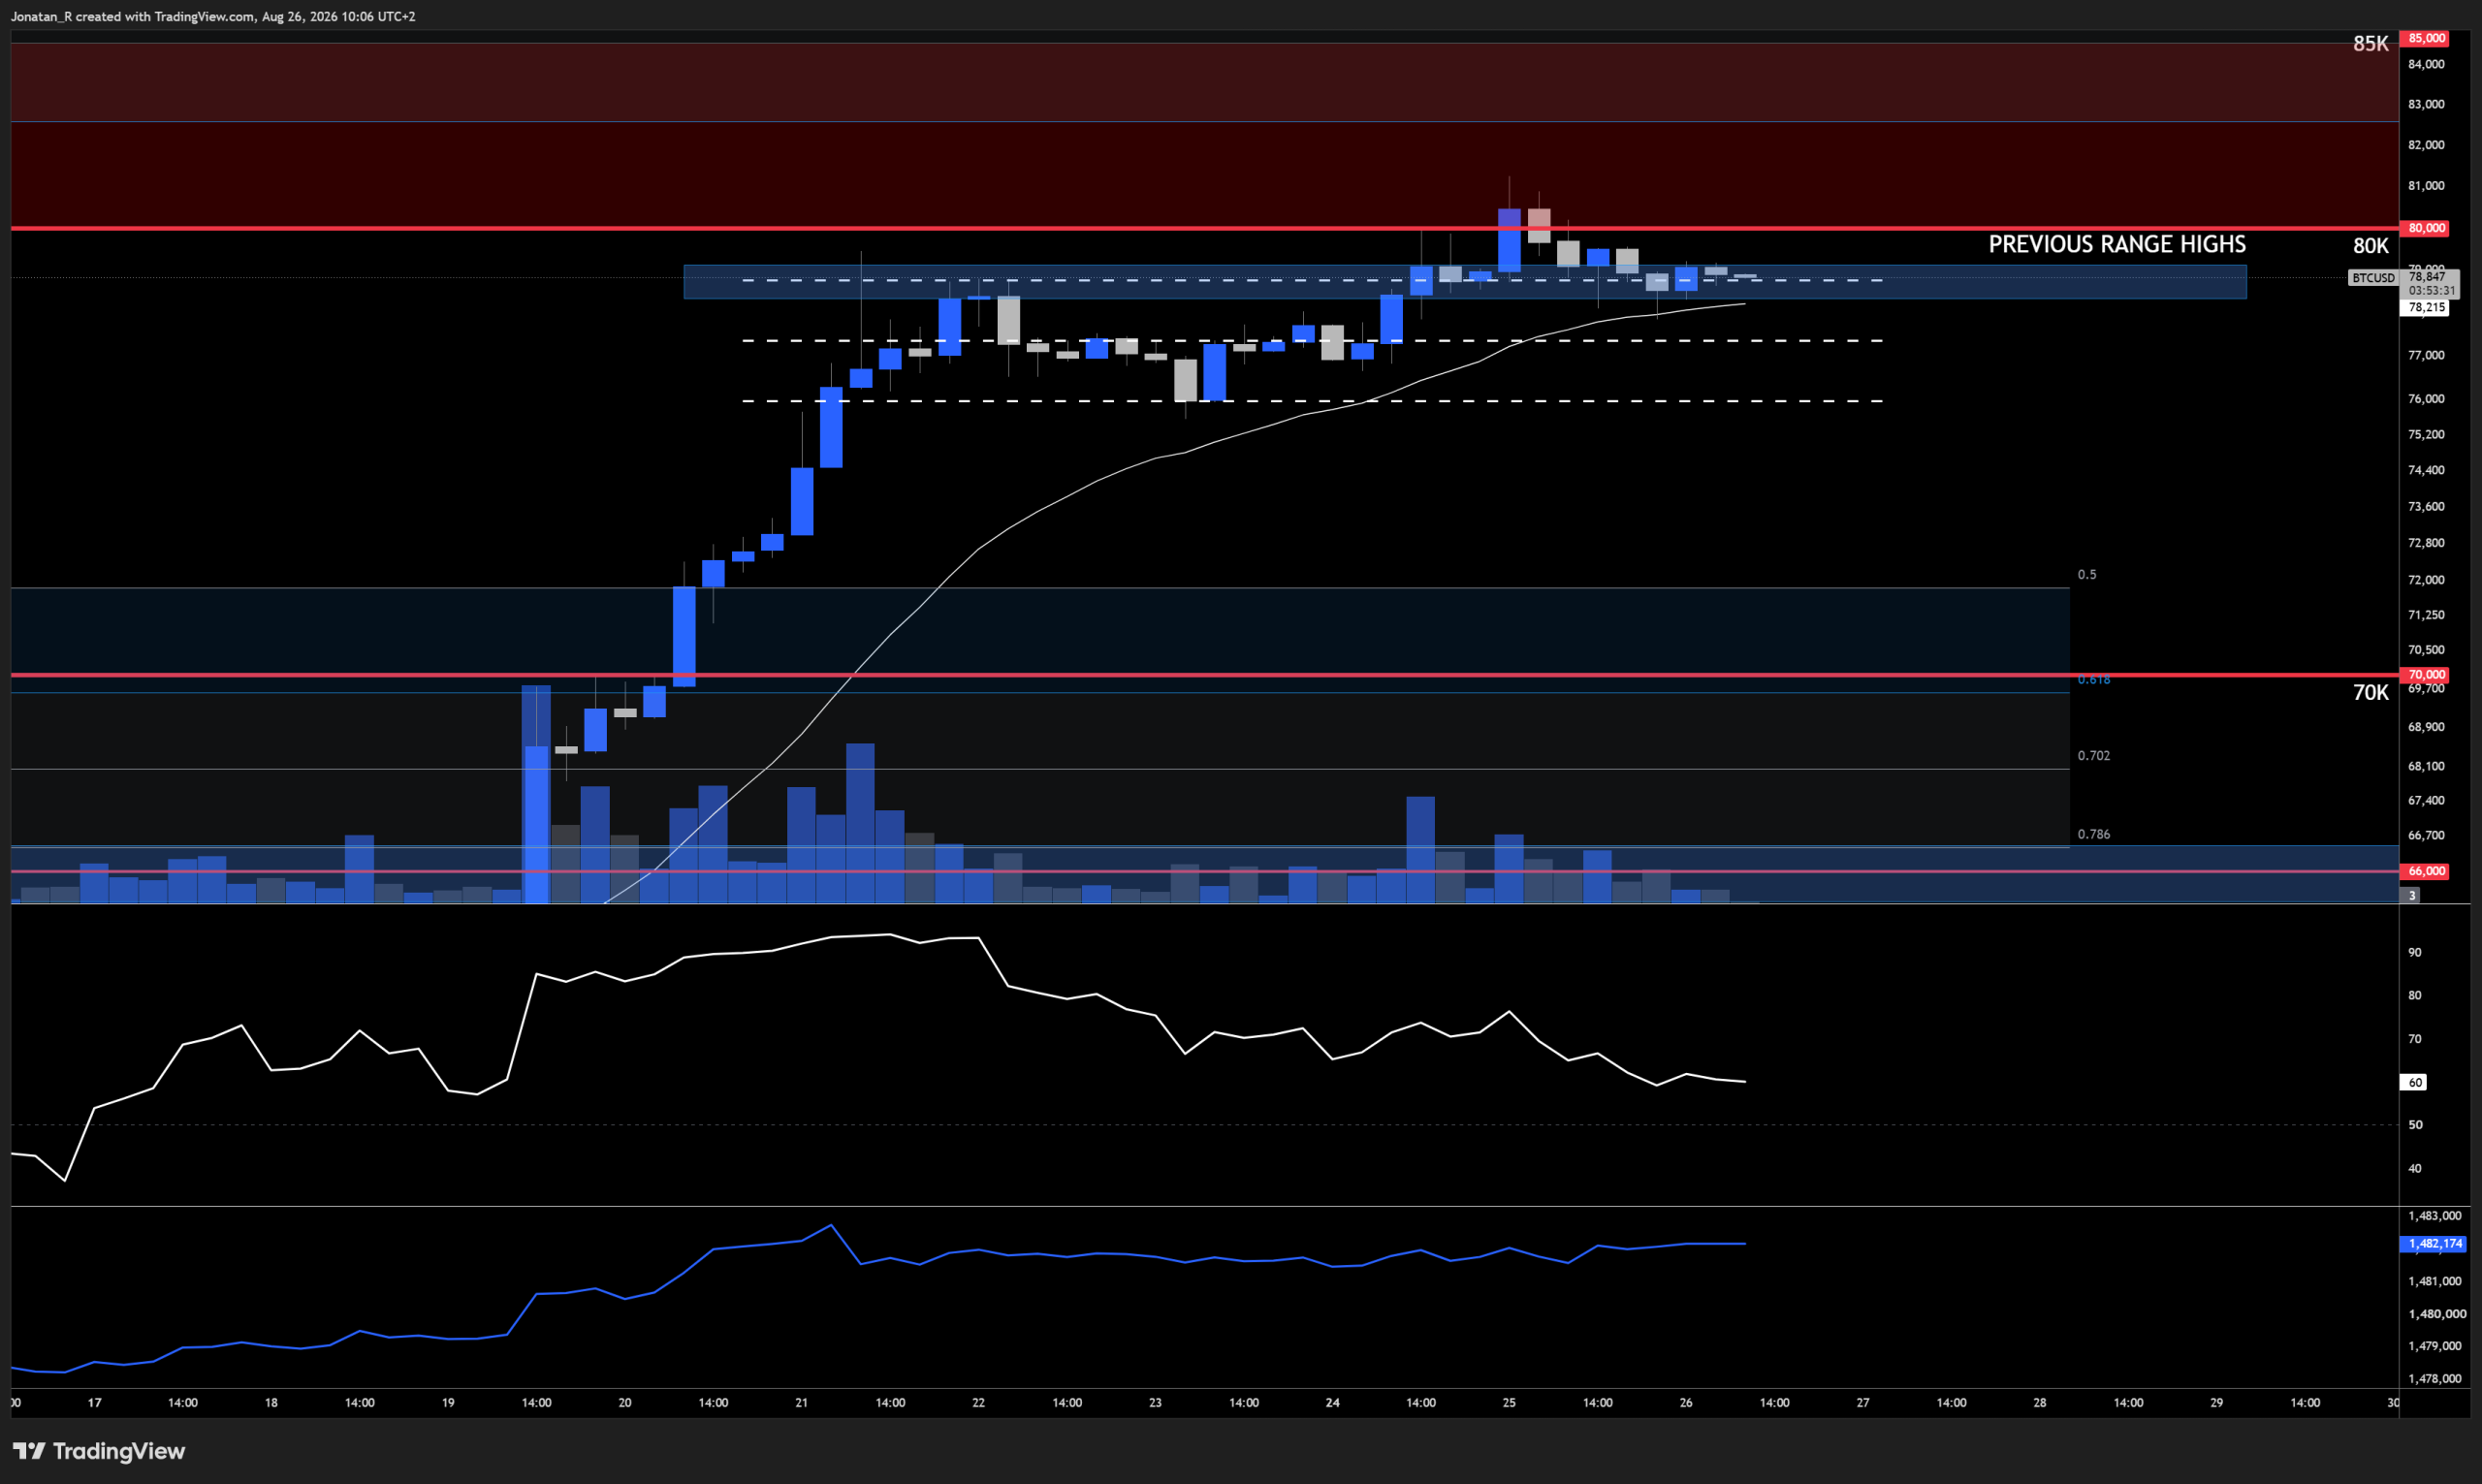
Bitcoin’s 4-hour chart, showing the rejection at 80,000 and the previous range highs now being tested as support.
In our previous coverage of Bitcoin, the 78,000 to 79,000 zone was the level that would decide whether the rally extended. Price cleared it, peaked above 80,000 yesterday and was rejected there, and that same zone is now back in play from above.
Bitcoin is now testing the previous range highs at around 78,900, sitting right below the 80,000 level it broke on yesterday’s push, and that break did come with an interesting increase in volume. The accumulation and distribution indicator at the bottom of the chart shows that volume is still relatively healthy, but the RSI is showing a relatively strong bearish rejection. That’s telling us momentum is slowing down compared with the rally that came before it, which isn’t surprising in a situation like this. We had a strong impulse move right into resistance, and momentum naturally stalls as price consolidates.
We’re still above the 20 EMA, the white line on the chart, and the fact that we’re holding above it, and holding this support at the previous range highs, could be seen as a sign of strength. Breaking below the 4-hour 20 EMA, which is sitting at around 78,200, could be the first sign of a potential break in the structure of this trend. So far it still looks relatively healthy.
The 1-hour chart
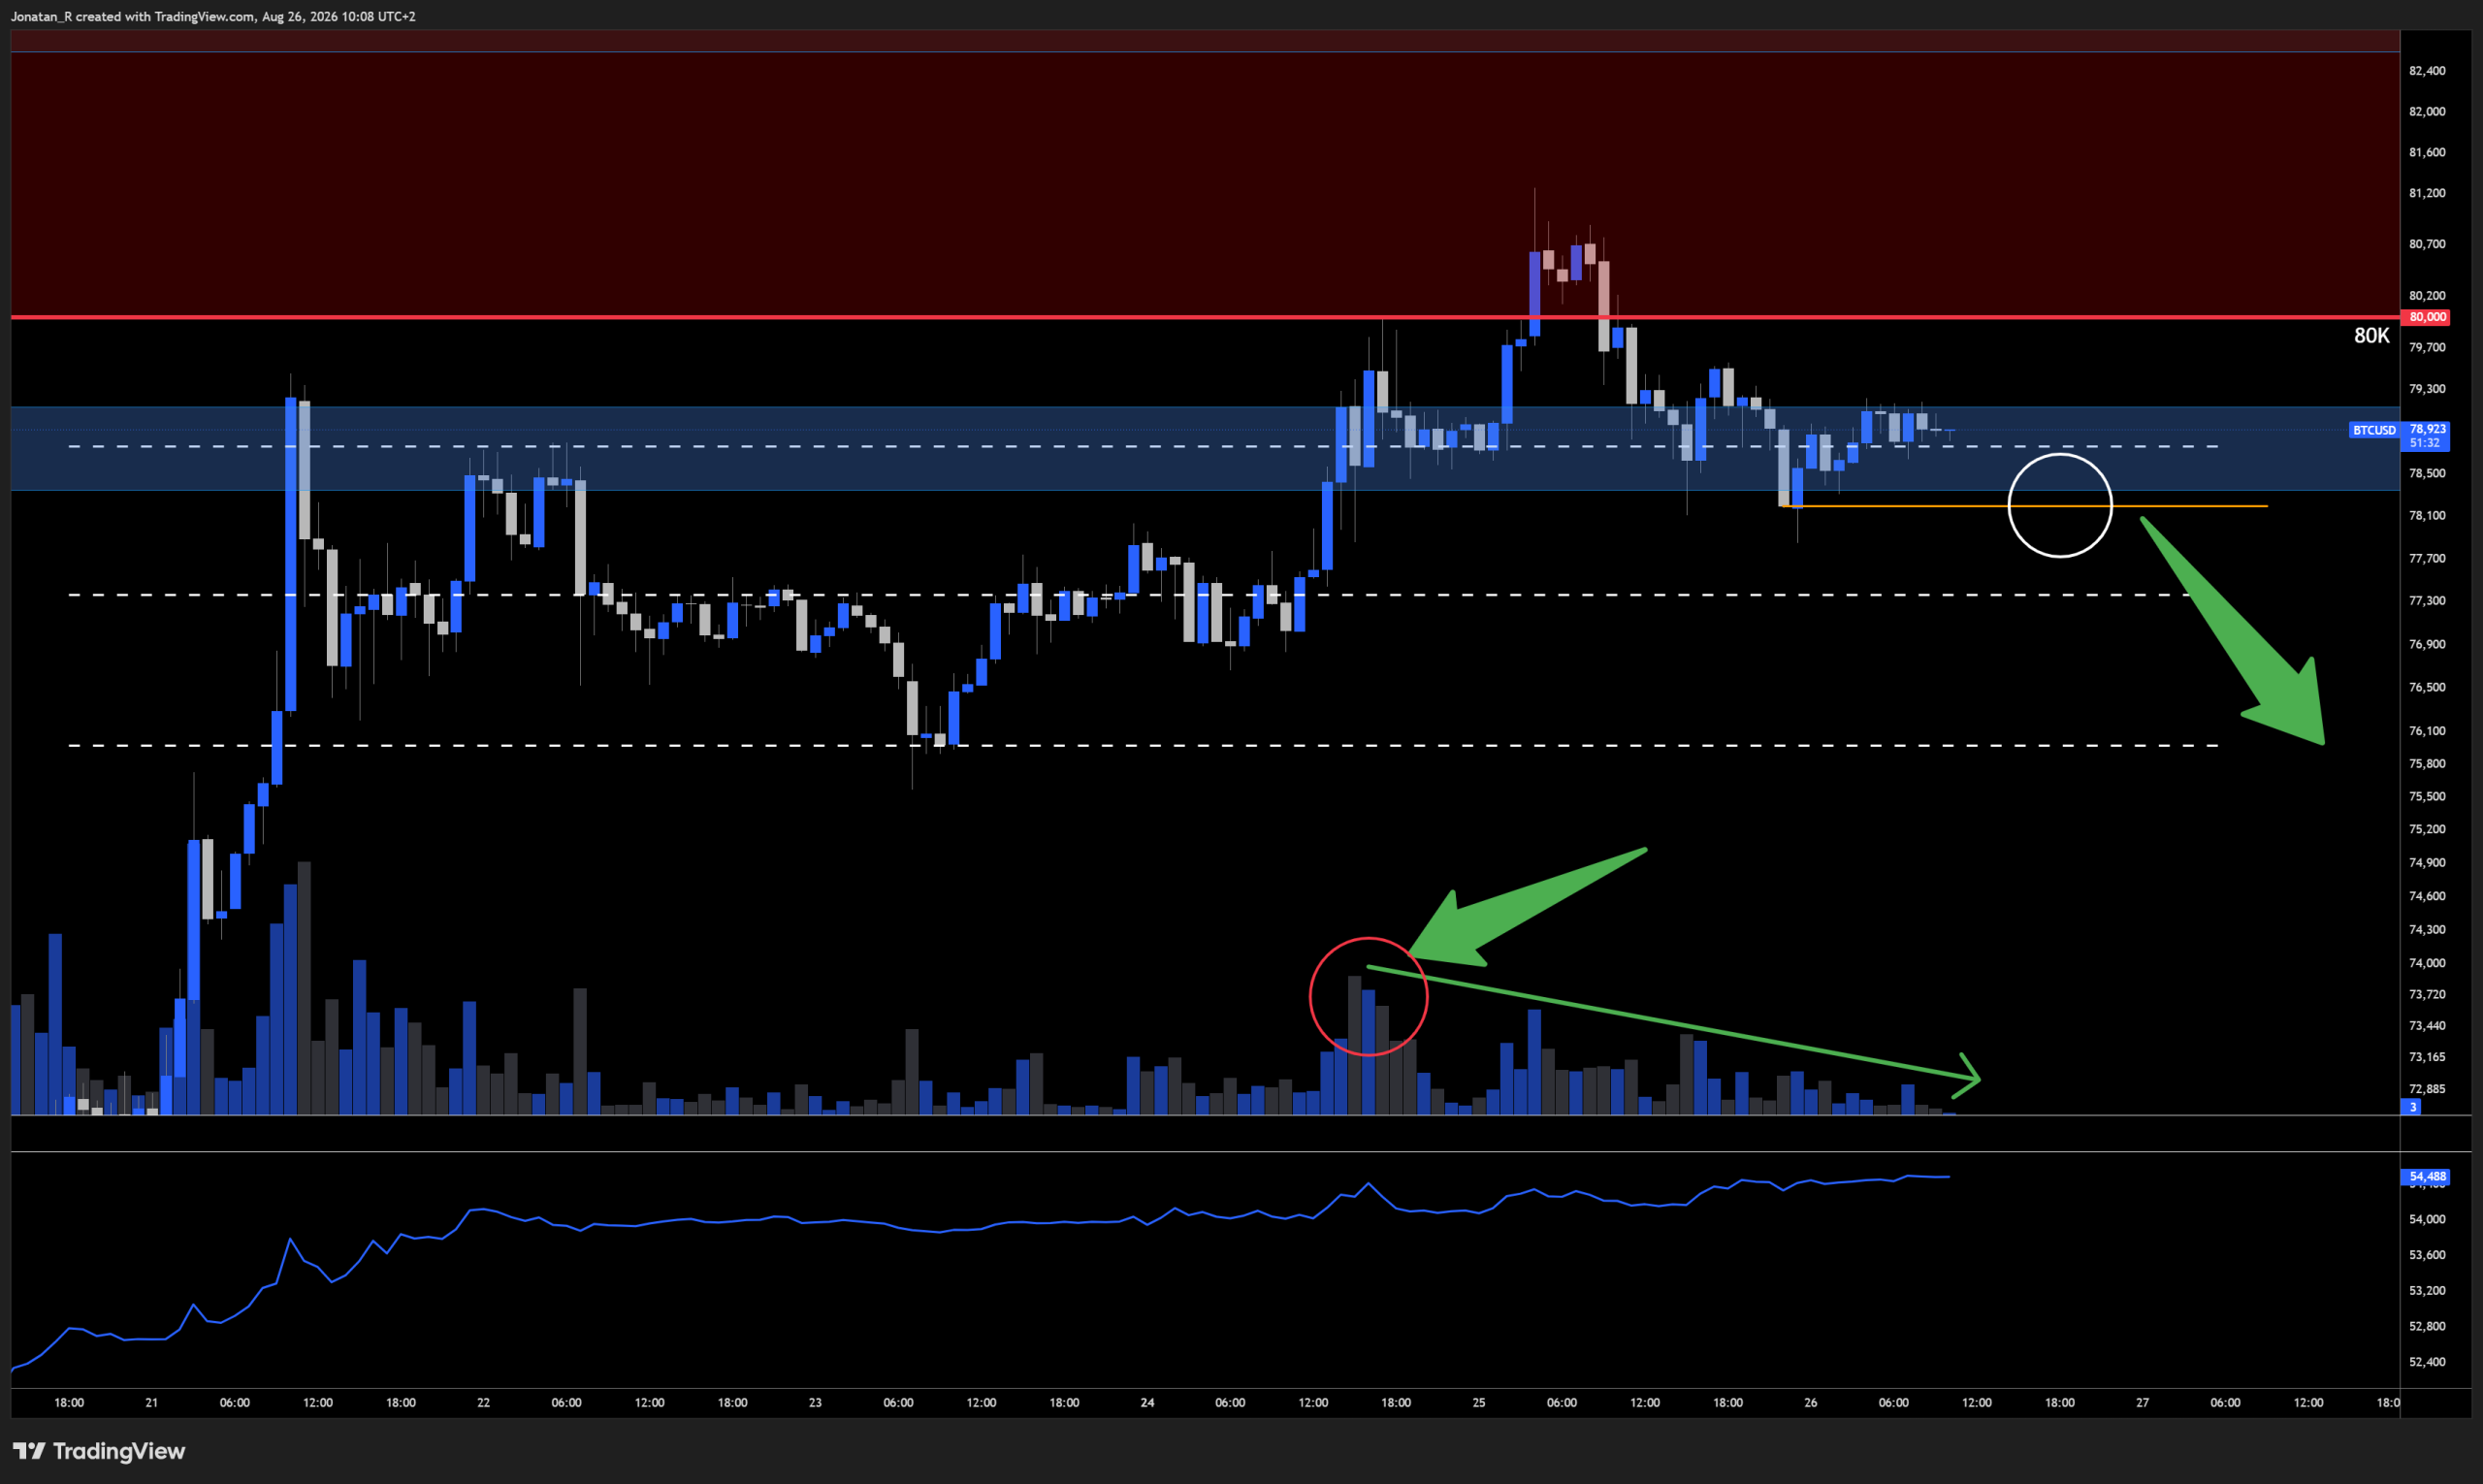
Bitcoin’s 1-hour chart, with the 4-hour 20 EMA marked by the orange line and volume trending lower through the pause.
On the 1-hour we do see that the accumulation and distribution indicator is in an uptrend, but volume is showing a clear downwards trending character here, and that’s something worth paying attention to. If we break above 80,000 again, it would be good to see volume surpass the volume that came in around the New York open on the 24th. If we get a new breakout with an increase in volume, and a continuation upwards on accumulation and distribution, that might mean the breakout has more legs.
A break below the 4-hour 20 EMA, marked out here with the orange horizontal line and the white circle at around 78,200, might mean there is at least an initial pause to this trend. From there we could potentially see a move back down to the range lows at around 76,000.
Trade Now
Trading involves risk.
Author



 Risk Disclaimer
The content provided here is for informational purposes only. It is not intended as personal investment advice and does not constitute a solicitation or invitation to engage in any financial transactions, investments, or related activities. Past performance is not a reliable indicator of future results.
The financial products offered by the Company are complex and come with a high risk of losing money rapidly due to leverage. These products may not be suitable for all investors. Before engaging, you should consider whether you understand how these leveraged products work and whether you can afford the high risk of losing your money.
The Company does not accept clients from the Restricted Jurisdictions as indicated in our website/ T&C. Some services or products may not be available in your jurisdiction.
The applicable legal entity and its respective products and services depend on the client’s country of residence and the entity with which the client has established a contractual relationship during registration.