
 13 min read
 Bitcoin (BTC) is the first and largest cryptocurrency, a decentralized digital asset with a fixed 21 million supply cap that trades around the clock and is increasingly held as a reserve asset by funds and companies. In early August 2026 it changes hands in the low-$60,000s, roughly half its October 2025 record above $126,000. This page lays out PrimeXBT’s outlook for BTC through 2030 and into the 2040s, the levels traders are watching right now, and the events that could push the price either way. Figures are given as ranges rather than false-precise targets, and where the honest answer is “nobody can know,” the page says so.
Bitcoin outlook at a glance
- Current price: $85,471.4 per BTC.
- 2026 base case: $59,500–$84,200, a recovery year off the post-record lows rather than a fresh run to new highs.
- Main bullish catalyst: Fed rate cuts and sustained spot-ETF inflows feeding into the run-up to the 2028 halving.
- Biggest downside risk: higher-for-longer rates and a sustained break below the $58,300 support.
- Long-term view: the four-year halving cycle points higher into 2028–2029, but anything past 2030 is a direction of travel, not a number to bank on.
Live Bitcoin price chart
Today (6 October 2026) Bitcoin (BTC/USD) is trading at $85,471.4 per BTC, with a market cap of $1,717,553,073,101 USD. The 24-hour trading volume amounts to $25,229,916,785 USD. BTC price has changed by -0.20% in the last 24 hours. Bitcoin’s circulating supply is 20,094,409 BTC.
Trading involves risk.
Bitcoin price prediction 2026–2030 (yearly forecast)
The table below sets our expected band for each year. The far-apart institutional targets, which rest on very different assumptions, are kept out of it and shown separately in the analyst section so nothing incompatible gets blended together.
| Year | Minimum | Average | Maximum |
|---|---|---|---|
| 2026 | $59,500 | $71,400 | $84,200 |
| 2027 | $72,100 | $82,200 | $95,500 |
| 2028 | $83,700 | $141,200 | $216,600 |
| 2029 | $171,900 | $233,300 | $295,200 |
| 2030 | $174,400 | $223,600 | $267,700 |
Bitcoin price prediction 2026
Our 2026 outlook keeps Bitcoin in recovery mode: an average near $72,000 across the remaining months of the year, spanning $59,500–$84,200, with the $60,000–$61,000 demand zone acting as a floor rather than a launchpad. This is a market repairing damage after a 50% drawdown, not one setting records.
For the rest of 2026, the month-by-month path lifts BTC off its early-August base in small steps rather than a single leg up:
| Month (2026) | Minimum | Average | Maximum |
|---|---|---|---|
| August | $59,520 | $64,000 | $68,480 |
| September | $63,070 | $68,000 | $72,930 |
| October | $66,600 | $72,000 | $77,400 |
| November | $69,188 | $75,000 | $80,813 |
| December | $71,760 | $78,000 | $84,240 |
Bitcoin price prediction 2027
2027 is the setup year before the next halving: our path climbs through the year to average near $82,000, a full-year range of $72,100–$95,500. The move rests on accumulation ahead of the supply cut, not on any one headline.
| Month (2027) | Minimum | Average | Maximum |
|---|---|---|---|
| January | $72,130 | $78,615 | $85,101 |
| February | $72,496 | $79,231 | $85,965 |
| March | $72,860 | $79,846 | $86,833 |
| April | $73,220 | $80,462 | $87,703 |
| May | $73,577 | $81,077 | $88,577 |
| June | $73,932 | $81,692 | $89,453 |
| July | $74,333 | $82,364 | $90,394 |
| August | $74,782 | $83,091 | $91,400 |
| September | $75,227 | $83,818 | $92,410 |
| October | $75,668 | $84,545 | $93,423 |
| November | $76,106 | $85,273 | $94,440 |
| December | $76,540 | $86,000 | $95,460 |
Bitcoin price prediction 2028
2028 is the halving year, and our outlook puts the breakout here: an average near $140,000 across a range of $83,700–$216,600. Cutting new issuance in half has preceded every prior Bitcoin bull run, and the model front-loads that effect into the back half of the year.
| Month (2028) | Minimum | Average | Maximum |
|---|---|---|---|
| January | $83,698 | $94,308 | $104,917 |
| February | $90,815 | $102,615 | $114,416 |
| March | $97,890 | $110,923 | $123,957 |
| April | $104,923 | $119,231 | $133,538 |
| May | $111,915 | $127,538 | $143,162 |
| June | $118,865 | $135,846 | $152,827 |
| July | $126,116 | $144,545 | $162,975 |
| August | $133,664 | $153,636 | $173,609 |
| September | $141,166 | $162,727 | $184,289 |
| October | $148,623 | $171,818 | $195,014 |
| November | $156,034 | $180,909 | $205,784 |
| December | $163,400 | $190,000 | $216,600 |
Bitcoin price prediction 2029
2029 carries the cycle peak in our view: an average near $235,000, ranging $171,900–$295,200, with the top of the modeled band reached mid-year at about $295,000. Post-halving years have historically hosted the blow-off top, and this is where our numbers place it.
| Month (2029) | Minimum | Average | Maximum |
|---|---|---|---|
| January | $171,896 | $200,462 | $229,027 |
| February | $180,339 | $210,923 | $241,507 |
| March | $188,730 | $221,385 | $254,039 |
| April | $197,069 | $231,846 | $266,623 |
| May | $205,356 | $242,308 | $279,260 |
| June | $213,590 | $252,769 | $291,948 |
| July | $214,838 | $255,000 | $295,162 |
| August | $209,160 | $249,000 | $288,840 |
| September | $203,512 | $243,000 | $282,488 |
| October | $197,895 | $237,000 | $276,105 |
| November | $192,308 | $231,000 | $269,692 |
| December | $186,750 | $225,000 | $263,250 |
Bitcoin price prediction 2030
2030 is the cool-down after the peak, not a crash: an average near $225,000 across $174,400–$267,700. Four years out the outlook leans on the shape of the cycle over any dated figure, so read the monthly path below as a trajectory rather than a calendar of targets.
| Month (2030) | Minimum | Average | Maximum |
|---|---|---|---|
| January | $186,315 | $225,154 | $263,993 |
| February | $185,879 | $225,308 | $264,737 |
| March | $185,442 | $225,462 | $265,481 |
| April | $185,005 | $225,615 | $266,226 |
| May | $184,566 | $225,769 | $266,972 |
| June | $184,127 | $225,923 | $267,719 |
| July | $183,034 | $225,273 | $267,511 |
| August | $181,293 | $223,818 | $266,344 |
| September | $179,559 | $222,364 | $265,169 |
| October | $177,832 | $220,909 | $263,986 |
| November | $176,112 | $219,455 | $262,797 |
| December | $174,400 | $218,000 | $261,600 |
Bitcoin long-term price prediction: 2035, 2040–2050
Anything past 2030 is arithmetic pretending to be insight. No model prices a decade of halvings, technology shifts, and interest-rate regimes that don’t exist yet, so treat the numbers below as a slope rather than a destination — the uncertainty compounds with every year added. On that basis, our long-range path keeps grinding higher without any single vertical leap:
| Year | Minimum | Average | Maximum |
|---|---|---|---|
| 2035 | $360,000 | $450,000 | $540,000 |
| 2040 | $606,800 | $820,000 | $1,033,200 |
| 2050 | $924,000 | $1,400,000 | $1,876,000 |
What analysts and models say (compared)
Bitcoin forecasts for 2026 span an order of magnitude. Algorithmic models cluster in the $60,000–$88,000 range for the year, while named desks have published 2026 targets from roughly $38,000 to $250,000 (CoinGecko compilation). Averaging figures built on opposing assumptions would mislead, so they sit side by side instead.
| Source | Method | Bitcoin view (2026 unless noted) |
|---|---|---|
| CoinCodex | Algorithmic | 2026 avg ~$75,200 (range ~$65,000–$87,300) |
| Changelly | Algorithmic | 2026 avg ~$75,100; 2030 avg ~$269,000 |
| Standard Chartered (Geoff Kendrick) | Institutional | ~$100,000 end-2026, trimmed from higher targets earlier in the cycle |
| Bernstein | Institutional | ~$150,000 end-2026 |
| ARK Invest (Cathie Wood) | Institutional, long-horizon | ~$1.2M by 2030 (bull case) |
The spread is the story. Fidelity’s Jurrien Timmer reads 2026 as a $65,000–$75,000 consolidation; NYDIG has floated a downside scenario near $38,000; Fundstrat’s Tom Lee still targets $200,000–$250,000 by year-end. Standard Chartered has cut hardest, walking a headline six-figure call back toward $100,000 as the market rolled over. Anyone hunting a single consensus number won’t find one here, and pretending otherwise would be dishonest.
Track record of this forecast
This is the first published PrimeXBT price forecast for Bitcoin. From the next monthly review onward, this section will hold the previous forecast up against BTC’s actual price on the update date and explain any miss plainly, rather than quietly moving the goalposts.
Bitcoin technical analysis
Bitcoin’s 2026 price prediction starts from a market trading below both of its major moving averages. BTC sits under the 50-day average near $65,143 and well beneath the 200-day near $74,705, which marks the longer trend as still down after the drop from the October 2025 record. The RSI has held near the neutral 48 mark through late July, with no overbought or oversold stretch, and the Fear & Greed Index reads in “Extreme Fear.”
The support and resistance levels in play now: support at $62,460, then the $60,000–$61,000 demand zone, with a deeper line at $58,300; resistance starts at the 50-day near $65,143, then $68,000 and $72,200, up to the 200-day near $74,705. Reclaiming that 200-day average would be the first hard evidence the downtrend has broken. For a primer on reading these signals, see PrimeXBT’s guide to crypto technical analysis.
Correlation with other assets
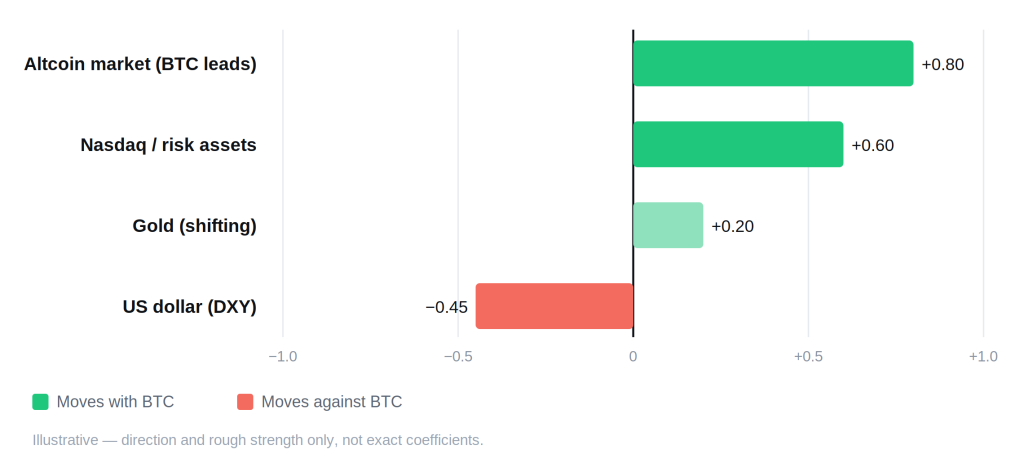
Bitcoin is the reference point the rest of the market trades against, so its correlations run in a different direction from any altcoin’s. When BTC moves, the total crypto market and the altcoins tend to follow, which is why traders treat it as the market’s beta anchor rather than a coin that tracks others. Its most distinctive relationship is with gold: Bitcoin’s “digital gold” store-of-value case means the two sometimes rise together as debasement hedges and sometimes compete for the same safe-haven flows, a link that tightens and loosens with the macro mood. Against the U.S. dollar index (DXY), Bitcoin has historically moved inversely, firming when the dollar softens and struggling when it strengthens. Since spot ETFs pulled institutions in, BTC has also tracked the Nasdaq and broad risk assets more closely than it once did, which is why Federal Reserve policy now shows up in the price within hours. These are directional tendencies, not fixed coefficients, and they drift over time.
Fundamental factors
Bitcoin’s supply is its defining feature. The protocol caps issuance at 21 million coins, of which more than 19.9 million have already been mined, and every roughly four years the reward paid to miners halves. The last Bitcoin halving in April 2024 cut the block subsidy to 3.125 BTC; the next, expected in 2028, will take it to 1.5625 BTC. That programmed scarcity is why supply cannot be inflated to meet demand, and it sits at the center of how the Bitcoin price is determined. For the mechanics of the cap, see how many bitcoins there are.
On the demand side, spot Bitcoin ETFs have given institutions a regulated way to hold BTC, and their daily flows now swing the price: early August saw over $170 million of net inflows in a single session even amid weak sentiment. Corporate and fund treasuries continue to carry Bitcoin on their balance sheets, deepening the pool of long-term holders. The market capitalization that results still moves with the macro backdrop, chiefly U.S. interest rates and the dollar, so fundamentals set the floor while policy sets the near-term mood.
Upcoming catalysts
Only confirmed, dated events make this list. Macro policy is the clearest near-term driver, given how closely BTC now tracks risk assets.
| Date | Event | Potential impact |
|---|---|---|
| September 15–16, 2026 | FOMC meeting (with economic projections) | Bull if the Fed signals cuts; bear if it holds rates higher for longer |
| October 27–28, 2026 | FOMC meeting | Rate path steers risk appetite across crypto |
| December 8–9, 2026 | FOMC meeting (with economic projections) | Year-end policy signal for 2027 positioning |
| 2028 (date not yet confirmed) | Fourth Bitcoin halving (subsidy 3.125 → 1.5625 BTC) | Halves new issuance; has preceded prior bull runs, but triggers on block height, not a calendar date |
FOMC dates follow the Federal Reserve’s published 2026 schedule. The halving is listed without a day because it fires at a block height rather than a date, and pinning it to a specific day now would be a guess, not information.
Bull case vs bear case
Bull case:
- The Fed pivots to rate cuts and capital rotates back into risk assets, Bitcoin first.
- Spot-ETF inflows stay positive, adding steady institutional bid under the price.
- The 2028 halving cuts new supply just as demand rebuilds, the classic cycle setup.
- Treasuries keep accumulating, thinning the float available to sell.
Bear case:
- Rates stay higher for longer and risk assets stay pressured.
- BTC keeps trading below its 200-day average with “Extreme Fear” sentiment.
- Security shocks and exchange incidents dent confidence and trigger outflows.
- Momentum stays weak and the $58,300 support gives way.
Invalidation levels. The bull case weakens if Bitcoin closes below $58,300, the deeper support. The bear case is invalidated on a sustained reclaim of the 200-day average near $74,705 — roughly 17% above the early-August price, and the line that would confirm the downtrend is broken. The nearer downside trigger, $58,300, sits about 8% below spot. These are the same levels named in the technical section, not new ones.
Historical performance
Bitcoin’s chart is a run of boom-and-bust cycles keyed to the four-year halving rhythm, not a smooth climb. It fell about 84% from the 2017 peak (near $19,800 down to $3,200), then about 77% in 2021–2022 (near $69,000 to $15,500), and each time recovered to a new record. Its slide from the October 2025 high above $126,000 to the low-$60,000s is roughly 50%, shallow by that history. No cycle owes it to the last one to repeat, but the pattern is why the halving still anchors this forecast.
Is Bitcoin a good investment in 2026?
That depends on horizon and stomach for drawdowns. Our outlook sees BTC recovering off the lows into year-end, averaging near $72,000 for 2026, with the cycle pointing higher into the 2028 halving. The facts underneath are plainer: Bitcoin trades below its long-term average, sentiment reads as extreme fear, and the near-term path runs through Fed policy. Whether that looks like a discount or a warning is the reader’s call to make. PrimeXBT’s explainer on whether Bitcoin is a good investment works through the case in full.
How to trade Bitcoin on PrimeXBT
On PrimeXBT you can take a position on Bitcoin in either direction. CFDs on BTC can be traded long or short, so a falling market is as tradable as a rising one — see the guides to trading Bitcoin and shorting Bitcoin. Leverage cuts both ways, magnifying losses as readily as gains, so position sizing and a stop-loss matter on every trade. Trade on your own analysis and risk tolerance, and never stake more than you can afford to lose.
Trading involves risk.
How we build this forecast
PrimeXBT’s analysts assemble this outlook rather than pull it from one price feed. We anchor on where BTC trades today, read it against the 50- and 200-day moving averages and the live support and resistance, weigh the fundamentals that actually move Bitcoin — the 21 million cap, the halving schedule, ETF flows, treasury demand — and set the whole picture against the macro backdrop, above all the path of U.S. rates. The yearly ranges fuse that technical read with the fundamental and macro view; the long-range figures lean on the shape of the halving cycle rather than any claim to precision.
None of this is a promise. Bitcoin is volatile, the inputs move, and a single macro or security shock can outrun any forecast. Read every number here as a considered estimate, not a guarantee, and expect it to change — we revisit and refresh the outlook each month as the data does.
How much will Bitcoin be worth in 2026?
Our outlook averages near $72,000 for 2026, within a full-year range of $59,500–$84,200. It is a recovery year off the post-record lows, not a run to new highs.
How much will Bitcoin be worth in 2030?
Our long-range view centers near $225,000 for 2030, after a cycle peak in 2029. Forecasts five years out are low-confidence by nature and should be read as a direction, not a target.
What will Bitcoin be worth in five years?
See 2030 above. On this horizon any single figure is a slope rather than a promise, and the plausible band spans well over a hundred thousand dollars.
Can Bitcoin reach $500,000?
Not within our 2026–2030 window: the top of the modeled range is about the mid-2029 peak, near the figure in our 2029 section. Half a million sits in long-range 2035-and-beyond territory, where the numbers are directional guesses, not targets.
Is Bitcoin a good investment in 2026?
Mixed. A recovering near-term outlook and a supportive halving cycle on one side; a price below its long-term average and extreme-fear sentiment on the other. The case runs both ways, and the answer depends on your horizon.
What will Bitcoin be worth tomorrow?
This page updates monthly and does not publish next-day targets — a single-day figure would be wrong within days and stay uncorrected until the next review. For the price right now, use the live chart above; for context, the nearby support sits around $62,460 and resistance near the 50-day at $65,143.
When is the next Bitcoin halving?
The last halving, in April 2024, cut the block reward to 3.125 BTC. The next is expected in 2028 and will halve it again to 1.5625 BTC, but it triggers on block height rather than a fixed calendar date, so no exact day is confirmed yet.
Author



 Risk Disclaimer
The content provided here is for informational purposes only. It is not intended as personal investment advice and does not constitute a solicitation or invitation to engage in any financial transactions, investments, or related activities. Past performance is not a reliable indicator of future results.
The financial products offered by the Company are complex and come with a high risk of losing money rapidly due to leverage. These products may not be suitable for all investors. Before engaging, you should consider whether you understand how these leveraged products work and whether you can afford the high risk of losing your money.
The Company does not accept clients from the Restricted Jurisdictions as indicated in our website/ T&C. Some services or products may not be available in your jurisdiction.
The applicable legal entity and its respective products and services depend on the client’s country of residence and the entity with which the client has established a contractual relationship during registration.








