8 min read
 Technical picture
BTC/USD closed the latest 4h candle at $63,339.8, up $282.7 or 0.45%, inside a $63,013.6 to $63,565.8 range. Spot sits below both exponential moving averages on the chart, the faster at $63,785.1 and the slower at $64,084.8. The short-term structure stays negative even after the bounce.
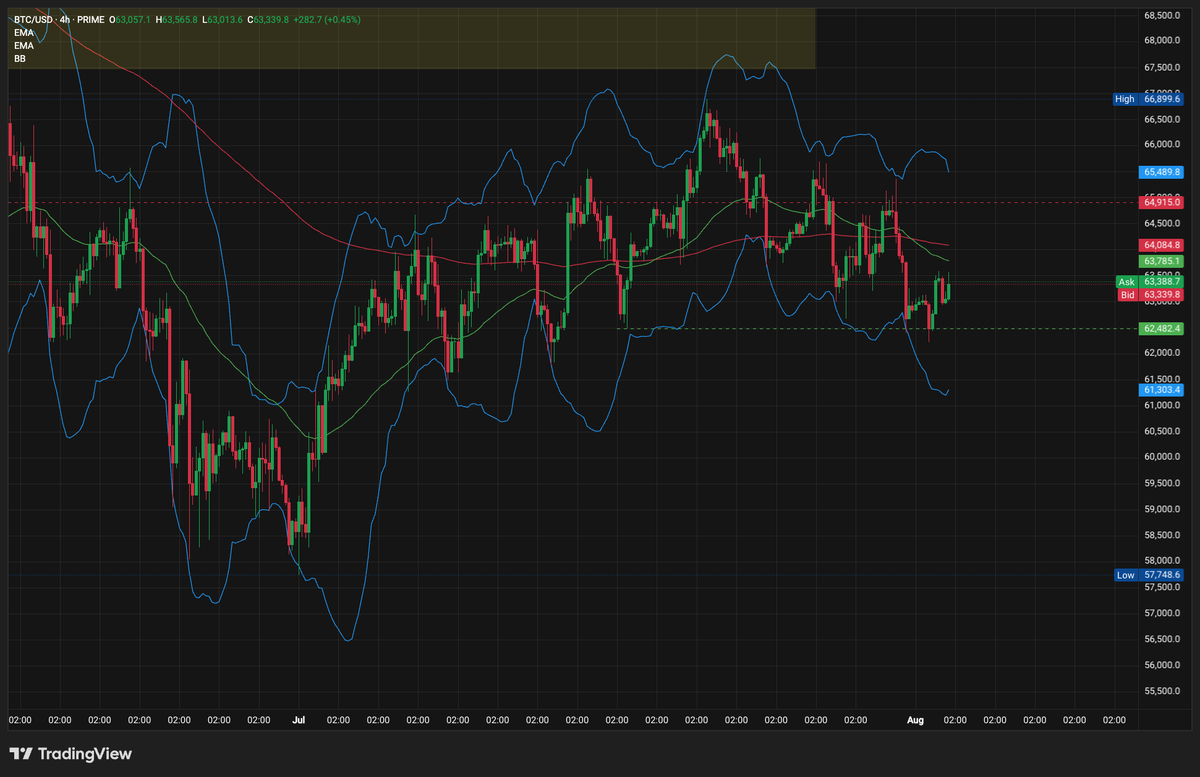
Bollinger Bands frame the week. The upper band sits at $65,489.8 and the lower band at $61,303.4, a corridor about $4,186 wide, or 6.6% of spot. Price approached the lower band twice in the closing days of July and recovered both times. The compression matters more than the bounces: narrower bands raise the odds of an expansion move without saying which side it resolves on. Two marked levels bracket spot, $64,915.0 above and $62,482.4 below, and the two-month range runs $57,748.6 to $66,899.6.
Crypto heatmap
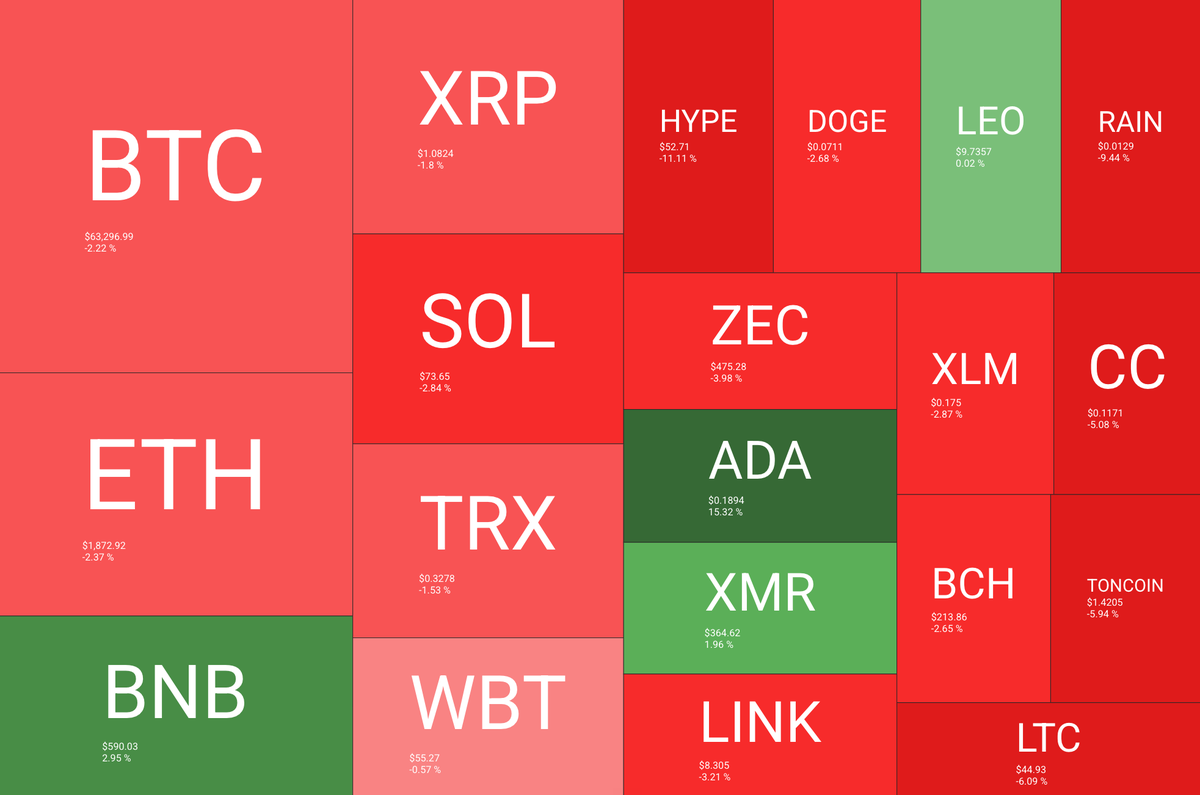
The tape is mostly red. Bitcoin prints $63,296.99 on the snapshot, down 2.22% over 24 hours, with Ethereum at $1,872.92, down 2.37%.
Source: https://quantifycrypto.com/heatmaps
Three tiles break the pattern. Cardano leads at $0.1894, up 15.32%, after ADA cleared the descending trendline that had capped every rally since early 2026 and whale wallets added more than 30 million ADA over the week. BNB adds 2.95% to $590.03 and Monero 1.96% to $364.62. The damage concentrates in high-beta names: HYPE down 11.11%, LTC down 6.09%, TONCOIN down 5.94%. One strong idiosyncratic mover against a broadly weak tape is exactly what the next section quantifies.
Altcoin Season Index
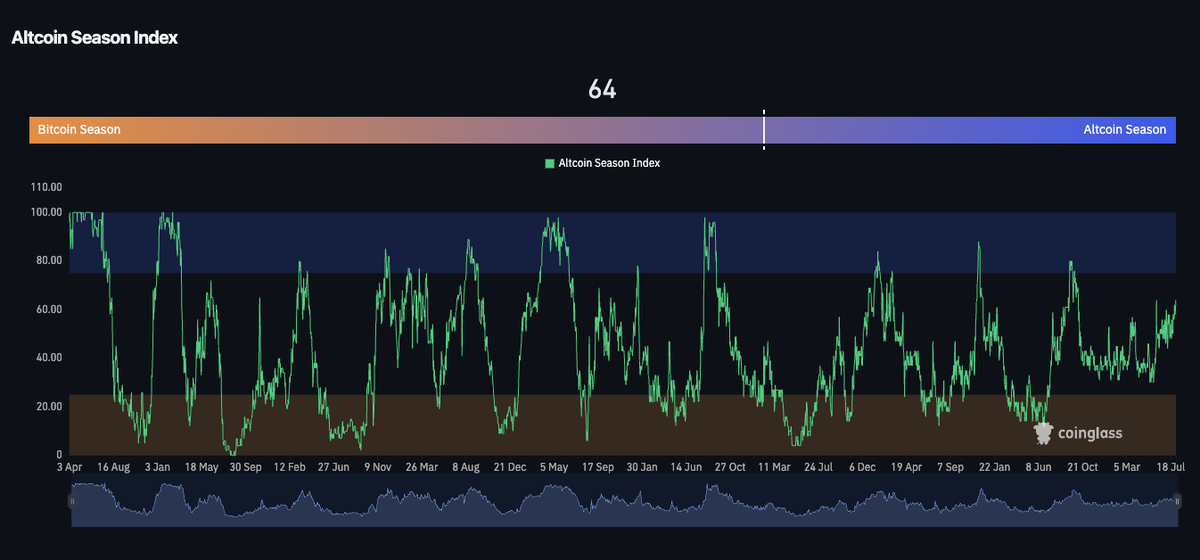
The index reads 64, up from 60 a week earlier.
Source: https://www.coinglass.com/pro/i/alt-coin-season
The threshold for an actual altcoin season is 75. At 64 the reading sits in the neutral band, closer to the alt side than the Bitcoin side but not through the line. A four-point weekly move is noise next to the swings in the history panel, where the index has cycled between single digits and 100 repeatedly. Read against the heatmap above, the number describes rotation into a handful of names rather than a broad alt bid.
Fear and Greed Index
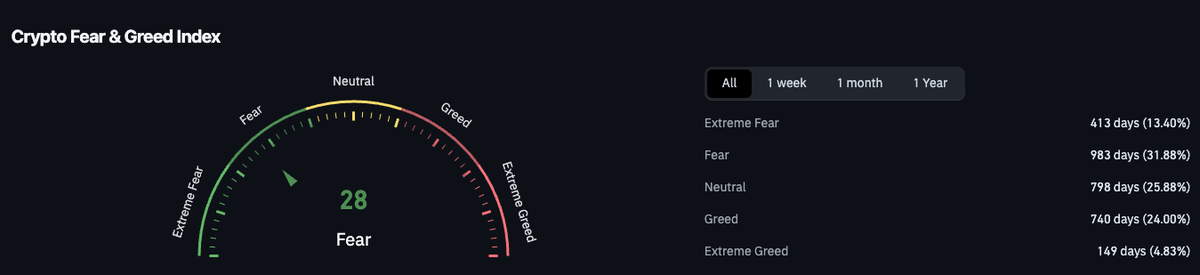
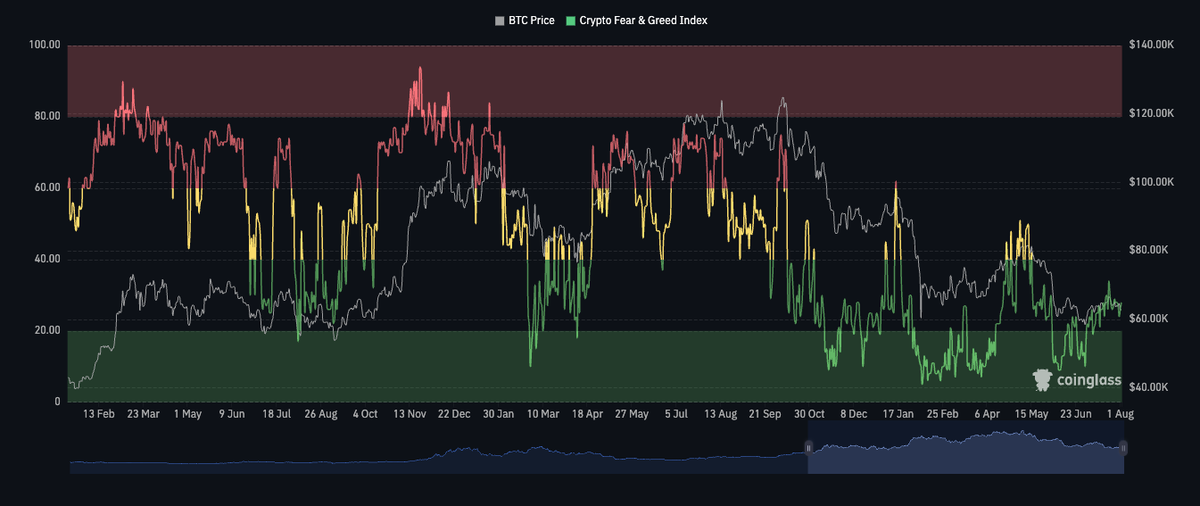
The Crypto Fear and Greed Index reads 28, against 27 a week ago. Both readings sit in the Fear zone, one step above Extreme Fear.
Source: https://www.coinglass.com/pro/i/FearGreedIndex
Context matters more than the one-point move. Across the full history, Fear covers 983 days, or 31.88% of all readings, and Extreme Fear another 413 days, or 13.40%. Greed and Extreme Greed together account for 28.83%. A 28 is common, not exceptional. The history panel shows the index holding the fear band almost continuously since October while price walked down from above $120,000. Sentiment has been depressed long enough that it has stopped working as a contrarian trigger on its own.
Warsh’s hawkish hold
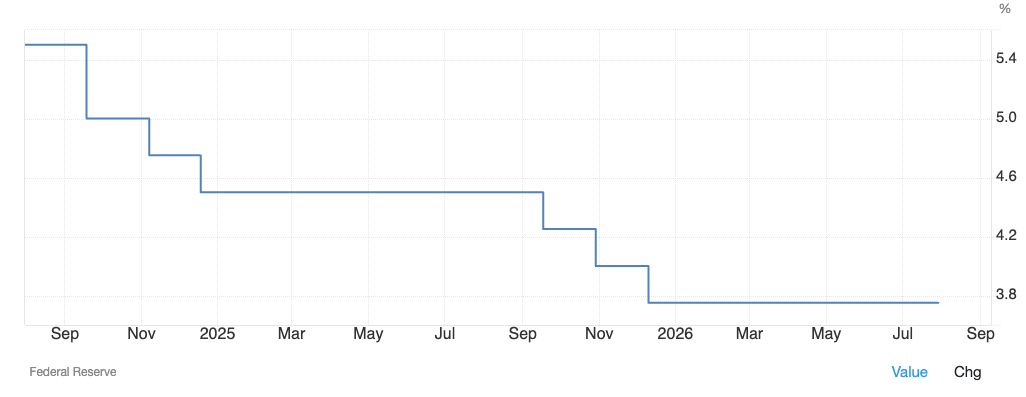
The Federal Reserve held its target range at 3.50 to 3.75% on July 29, unchanged since December 2025.
Source: https://tradingeconomics.com/united-states/interest-rate
The Federal Reserve left its policy rate unchanged in July, with three participants dissenting in favor of a hike. Markets had priced roughly a one-third probability of a hike, so the hold was dovish relative to that pricing. In his press conference, Chair Kevin Warsh discussed how inflation has been persistently above target and emphasized the Fed’s commitment to price stability, which suggests some policy firming may still be warranted, though not as imminently as markets had priced. Markets closed Wednesday still pricing 50 basis points of hikes, with more uncertainty around the timing, and inflation breakevens adjusted higher along with long-end nominal rates. The crucial question is not simply whether the Fed hikes, holds, or cuts. It is whether the Fed’s tolerance for two-point-something inflation is changing under Warsh.
The dissents came from Beth Hammack, Neel Kashkari and Lorie Logan, the first time since September 2016 that three policymakers broke ranks in the same direction. The 10-year yield reached a three-month high afterwards and 30-year notes traded at 20-year highs. That is the channel through which this reaches crypto, and it is the part the funding section below does not capture.
Strategy and the $5 billion question
Michael Saylor pushed back on August 1 against reports that Strategy had newly authorized up to $5 billion in bitcoin sales. His argument is that the authorization is not new: it came with the June 29 Digital Credit Capital Framework announcement, it requires no sales, and it exists to fund preferred dividends and rebuild cash reserves.
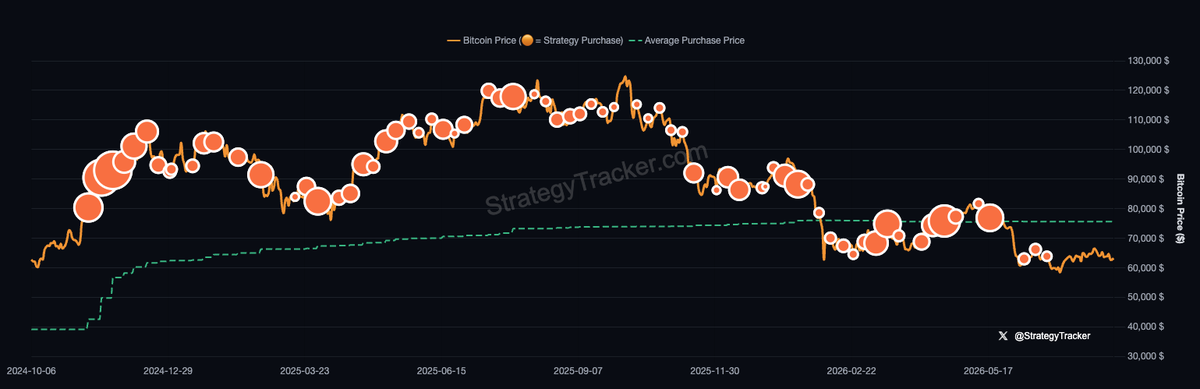
The chart shows why the story moved price anyway. Strategy’s average purchase price sits at $75,476 across 843,775 BTC as of July 30, roughly $63.6 billion deployed. Spot near $63,300 leaves the position about 16% underwater. Q2 carried an $8.2 billion fair-value loss and about $18.5 billion in unrealized losses, and a July 6 filing recorded 3,588 BTC sold for $216 million. Saylor also confirmed the company never ran a never-sell policy and expects to stay a net buyer. Bitcoin hit a three-week low on the original report.
August seasonality
August is bitcoin’s weakest month on the median, and the average hides it.
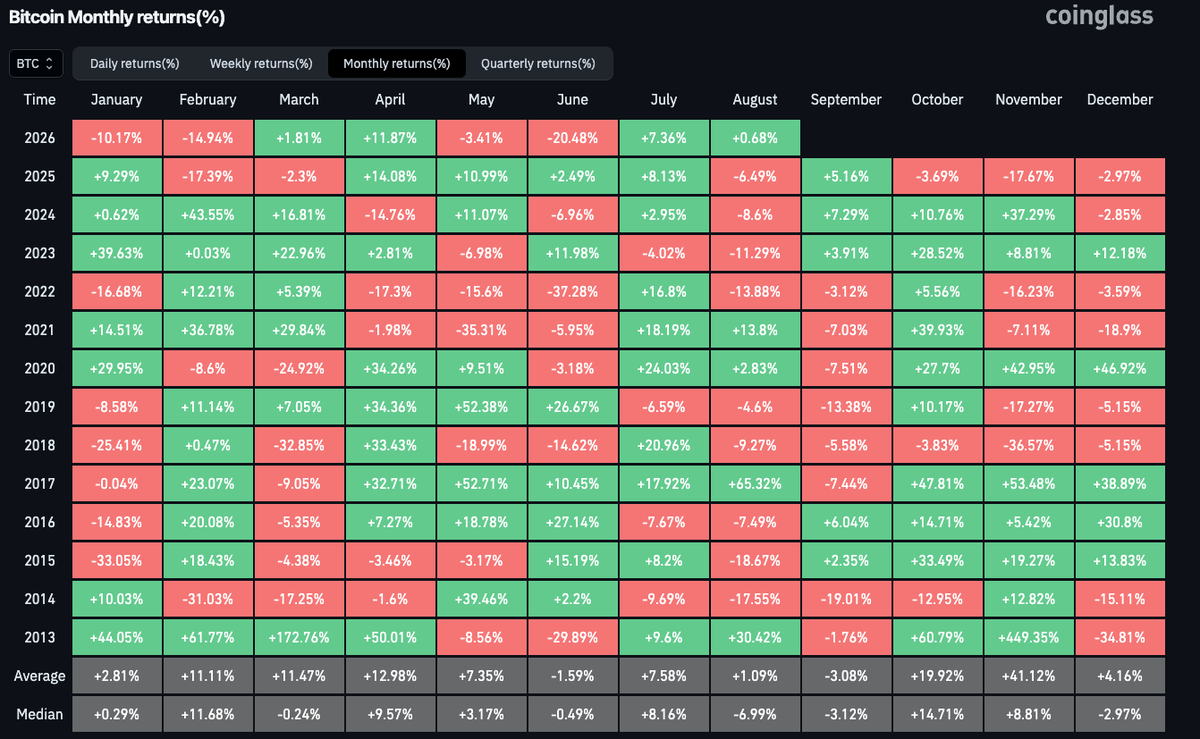
Across thirteen full Augusts the average is +1.09% but the median is -6.99%. The gap is one number, +65.32% in 2017. Strip it and the record reads nine red Augusts against four green, with the last four all lower: -13.88%, -11.29%, -8.6% and -6.49% for 2022 through 2025. September’s median is -3.12%, though the last three Septembers closed green, which weakens the standard pairing of the two months. August 2026 stands at +0.68% through the second, after a -20.48% June and a +7.36% July. Seasonality is a prior, not a signal.
Funding sits at baseline, not euphoria
This is the section where the chart and the first read part ways.
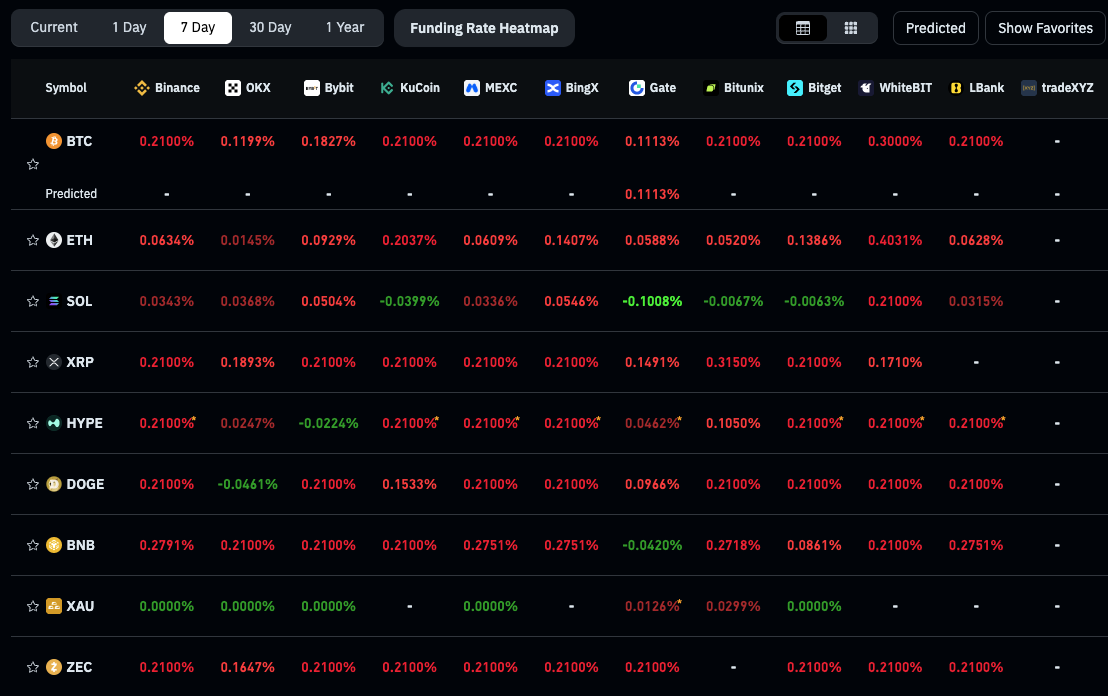
Seven-day BTC funding prints exactly 0.2100% on Binance, KuCoin, MEXC, BingX, Bitunix, Bitget and tradeXYZ. That is not an elevated number, it is the arithmetic floor. Positioning does not look stretched. However, a sudden rise in funding might lead the market to new lows.
Conclusion
The week does not resolve cleanly. The technical picture shows compression inside a narrowing corridor with spot below both moving averages, which is a setup for expansion rather than a direction. Sentiment at 28 and the Altcoin Season Index at 64 both sit mid-range. Funding is at baseline rather than overheated, which removes one of the usual pre-flush conditions rather than adding to them.
The measurable pressure sits elsewhere: three hawkish dissenters at the Fed, long-end yields at multi-month highs, and the largest corporate holder about 16% underwater on 843,775 BTC. If $61,303 gives way, the July low at $57,748 becomes the reference. If $65,490 clears, the $66,900 high comes back into range. Leverage is cheap here, which is precisely when it is easiest to carry too much of it.
Trading involves risk.
Author



 Risk Disclaimer
The content provided here is for informational purposes only. It is not intended as personal investment advice and does not constitute a solicitation or invitation to engage in any financial transactions, investments, or related activities. Past performance is not a reliable indicator of future results.
The financial products offered by the Company are complex and come with a high risk of losing money rapidly due to leverage. These products may not be suitable for all investors. Before engaging, you should consider whether you understand how these leveraged products work and whether you can afford the high risk of losing your money.
The Company does not accept clients from the Restricted Jurisdictions as indicated in our website/ T&C. Some services or products may not be available in your jurisdiction.
The applicable legal entity and its respective products and services depend on the client’s country of residence and the entity with which the client has established a contractual relationship during registration.