
 6 min read
 Brent crude is holding near its lowest levels since late February, back around the prices it traded at before the Middle East conflict erupted and sent it surging above $100 a barrel. The war premium that once dominated the oil market has almost entirely unwound, and the focus has shifted from geopolitics to a far more familiar concern: supply.
Over the weekend, OPEC and its allies, known as OPEC+, agreed to raise output targets by another 188,000 barrels per day from August. It was the latest in a steady run of monthly increases that has restored close to 800,000 barrels per day to quotas since April, as the group continues to unwind the voluntary production cuts it introduced in 2023. If it approves a further increase at its next meeting on 2 August, it will have reversed those cuts in full.
For much of the conflict, those hikes existed largely on paper. The closure of the Strait of Hormuz curtailed real exports from key producers including Saudi Arabia, Kuwait and Iraq, so the extra barrels never fully reached the market. That has been changing steadily since the US-Iran deal reopened the Strait of Hormuz, with Saudi exports back to roughly 90% of pre-war levels and the UAE restoring its shipments, though total flows remain below where they were before the war.
The demand side offers little offset. OPEC has trimmed its own 2026 demand growth forecast, lowering it for a second consecutive month, and a softening consumption outlook has traders increasingly focused on the risk of a supply glut as more barrels return. Progress in the US-Iran talks has reinforced that view, though the ceasefire remains fragile and the picture could still shift. OPEC+ itself stressed its increases could be paused or reversed if conditions change. With the next US inventory report due on 8 July, the charts are where the near-term picture gets decided.
Brent crude daily chart
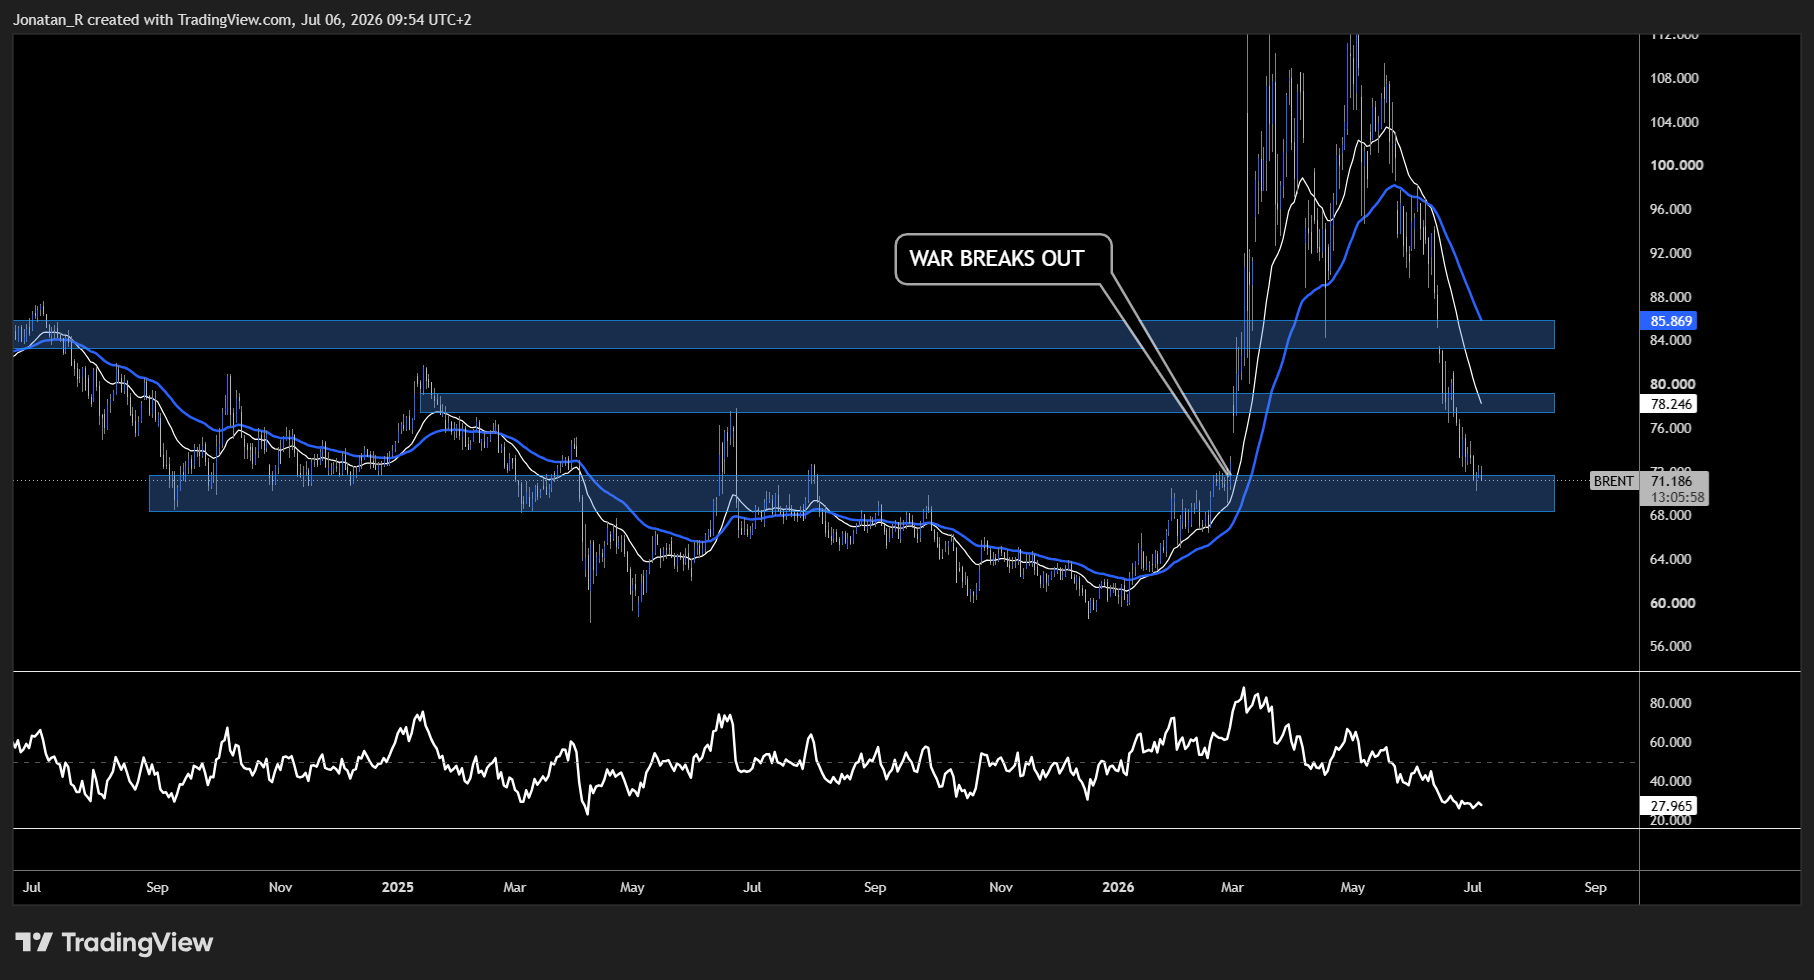
On the daily chart, Brent is testing a support zone around pre-war levels near $71, the same area that acted as a floor before the conflict erupted in late February. Price has been grinding steadily lower, but it is now pressing into this level rather than slicing through it.
There are early signs the selling could be losing steam. A subtle bullish divergence appears to be forming between price and the daily Relative Strength Index (RSI), hinting that downside momentum has slowed and could be starting to shift. It is tentative rather than confirmed, so it is worth treating as a clue rather than a signal for now.
To the upside, the daily 20-period exponential moving average (EMA) is sitting above price around the $78 resistance area. That makes $78 the first meaningful hurdle should a bounce develop, and a zone bulls would need to reclaim to argue the daily downtrend is genuinely turning.
Brent crude 4-hour chart
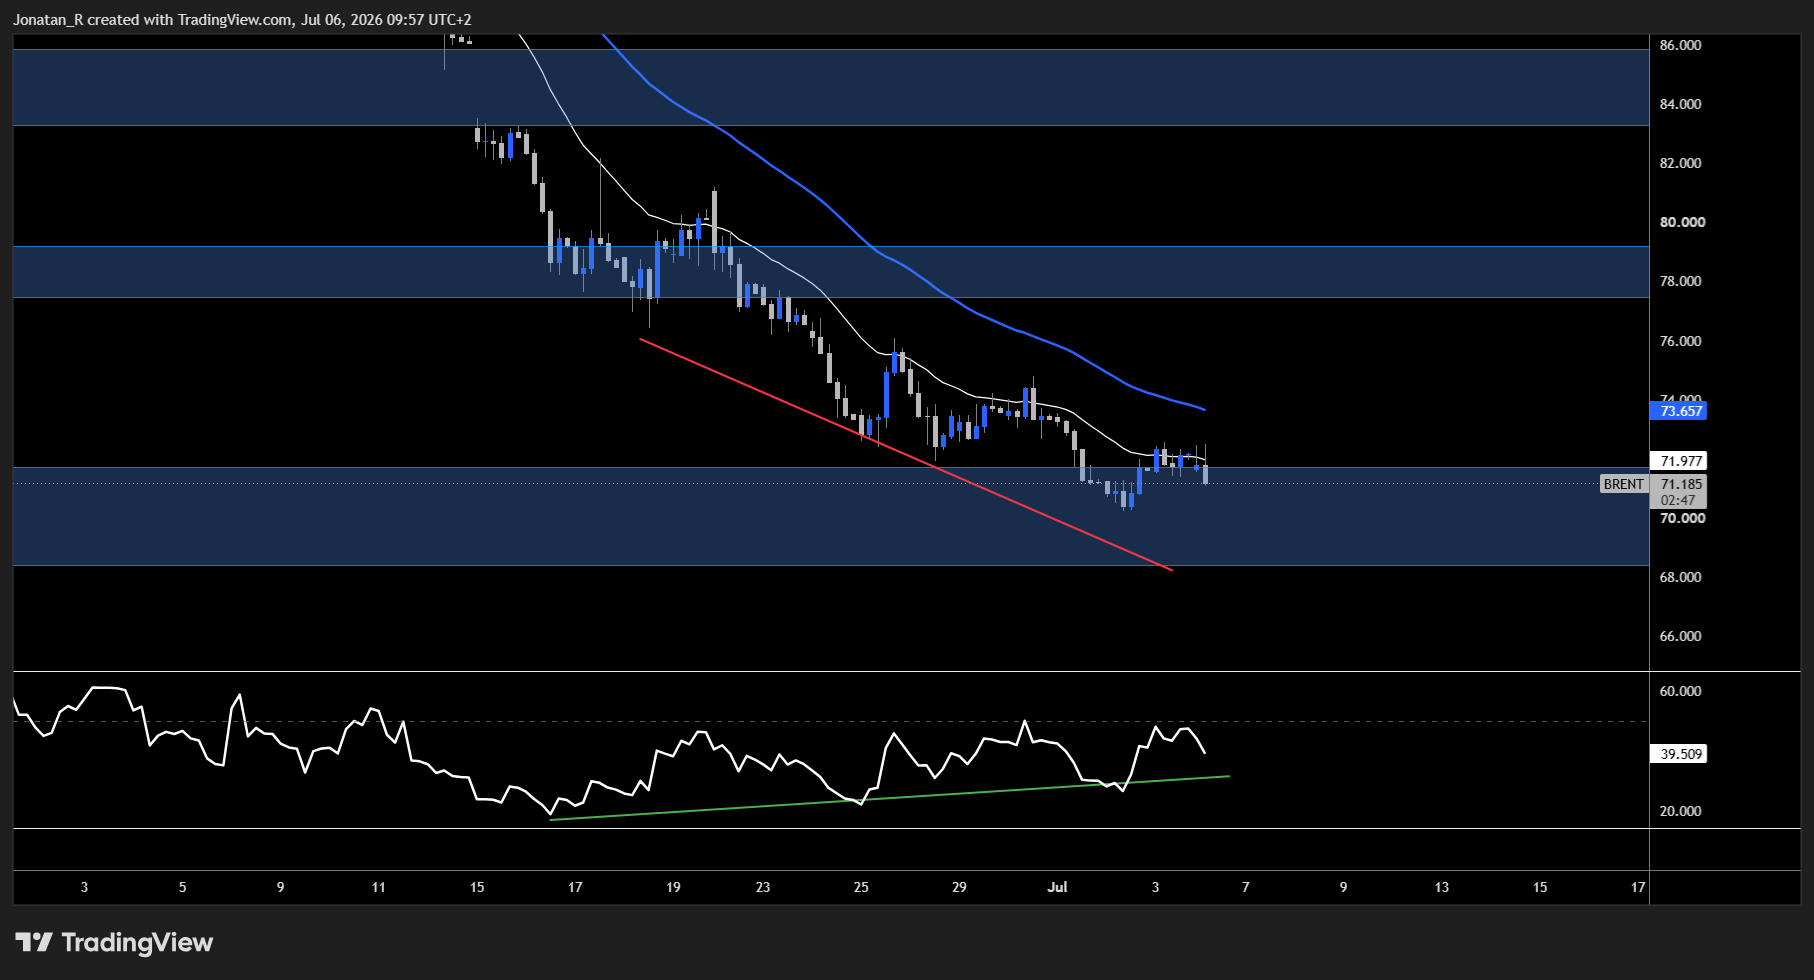
Dropping to the 4-hour chart, the divergence becomes clearer. Price remains in a well-defined downtrend, yet the 4-hour RSI is trending higher through a sequence of higher lows, a classic sign that selling pressure could be fading even as price drifts lower.
Price is currently hugging the 4-hour 20 EMA from below and respecting it as resistance, with $70 the logical near-term support just beneath.
If Brent begins to consolidate around here, the setup to watch is a break of structure: a move back above the 4-hour 20 EMA, followed by a reclaim of the 4-hour 50 EMA near $74. That combination could offer a potential early signal that the short-term trend is shifting.
For now, though, the macro backdrop appears to be doing its best to keep Brent pinned. With OPEC+ still returning barrels and the war premium fully unwound, the fundamental pressure remains to the downside, and it could take a clear break of structure on the lower timeframes before these tentative divergences translate into an actual reversal.
Key levels to watch
- $70: near-term 4-hour support, the level bulls need to hold
- $71: daily support zone around pre-war levels, where price is testing now
- 4-hour 20 EMA: immediate resistance price is hugging from below
- 4-hour 50 EMA (~$74): a reclaim here would strengthen the case for a short-term trend shift
- $78: daily 20 EMA and the first major resistance if a bounce develops
Trading involves risk.
Author



 Risk Disclaimer
The content provided here is for informational purposes only. It is not intended as personal investment advice and does not constitute a solicitation or invitation to engage in any financial transactions, investments, or related activities. Past performance is not a reliable indicator of future results.
The financial products offered by the Company are complex and come with a high risk of losing money rapidly due to leverage. These products may not be suitable for all investors. Before engaging, you should consider whether you understand how these leveraged products work and whether you can afford the high risk of losing your money.
The Company does not accept clients from the Restricted Jurisdictions as indicated in our website/ T&C. Some services or products may not be available in your jurisdiction.
The applicable legal entity and its respective products and services depend on the client’s country of residence and the entity with which the client has established a contractual relationship during registration.








