
 7 min read
 Key takeaways
- Brent jumped 9.6% on Monday, its biggest single-day gain since May 2020, after Trump reinstated the US naval blockade of Iranian ships and demanded a 20% reimbursement on all cargo shipped through the Strait of Hormuz.
- The war premium that had drained out of oil since the June ceasefire is back, and Brent has given up its pre-war discount in two sessions.
- US June CPI is released today at 13:30 UTC, but that print looks backwards at a month when pump prices fell. The barrel trading this morning is the one that sets July’s inflation data.
- Brent is now testing the 85 resistance area with the daily 50 EMA, with 79 as the level below and 90 as the next resistance if the situation deteriorates further.
Oil has taken back everything the peace deal gave it.
Brent jumped 9.6% on Monday, its biggest single-day gain since May 2020, after President Trump said the US was reinstating its naval blockade of Iranian ships and would be reimbursed “at the rate of 20% on all cargo shipped” through the Strait of Hormuz. WTI rose 9.4%. Both benchmarks are back at their highest since mid-June, and both extended higher again in early trading today.
Just over a week ago we wrote that Brent was holding near pre-war lows as OPEC+ turned the taps back up. That story has been overtaken. The war premium is back.
The escalation has been rapid and broad. The US struck dozens of Iranian targets on Monday, including the first combat use of unmanned surface vessels against the Bandar Abbas naval base. Iran’s Revolutionary Guard responded with strikes on Bahrain, Jordan, Kuwait and Oman, and says it has closed the strait, a claim Washington disputes. The June memorandum that reopened Hormuz, and which explicitly barred Tehran from charging transit tolls, was declared over by Trump last week.
What the blockade means in practice is still unclear. The White House has not defined what the 20% applies to, and shippers typically pay only 2% to 3% of cargo value in freight costs, so a toll on that scale could deter traffic rather than protect it. Insurers may also decline cover on the route regardless of who is escorting.
The timing collides with the day’s other event. US June CPI is released at 13:30 UTC, and consensus looks for headline inflation to fall to roughly 3.9% from May’s 4.2%, largely because pump prices dropped around 10% during the ceasefire. That reading is already out of date. The barrel that sets July’s inflation print is the one trading this morning, and a sustained energy shock could reinforce the case for a Fed still leaning towards a hike rather than a cut ahead of the 28 to 29 July FOMC.
We now head over to the charts to see if this could potentially be a new trend or just a volatility spike.
Brent crude daily chart analysis
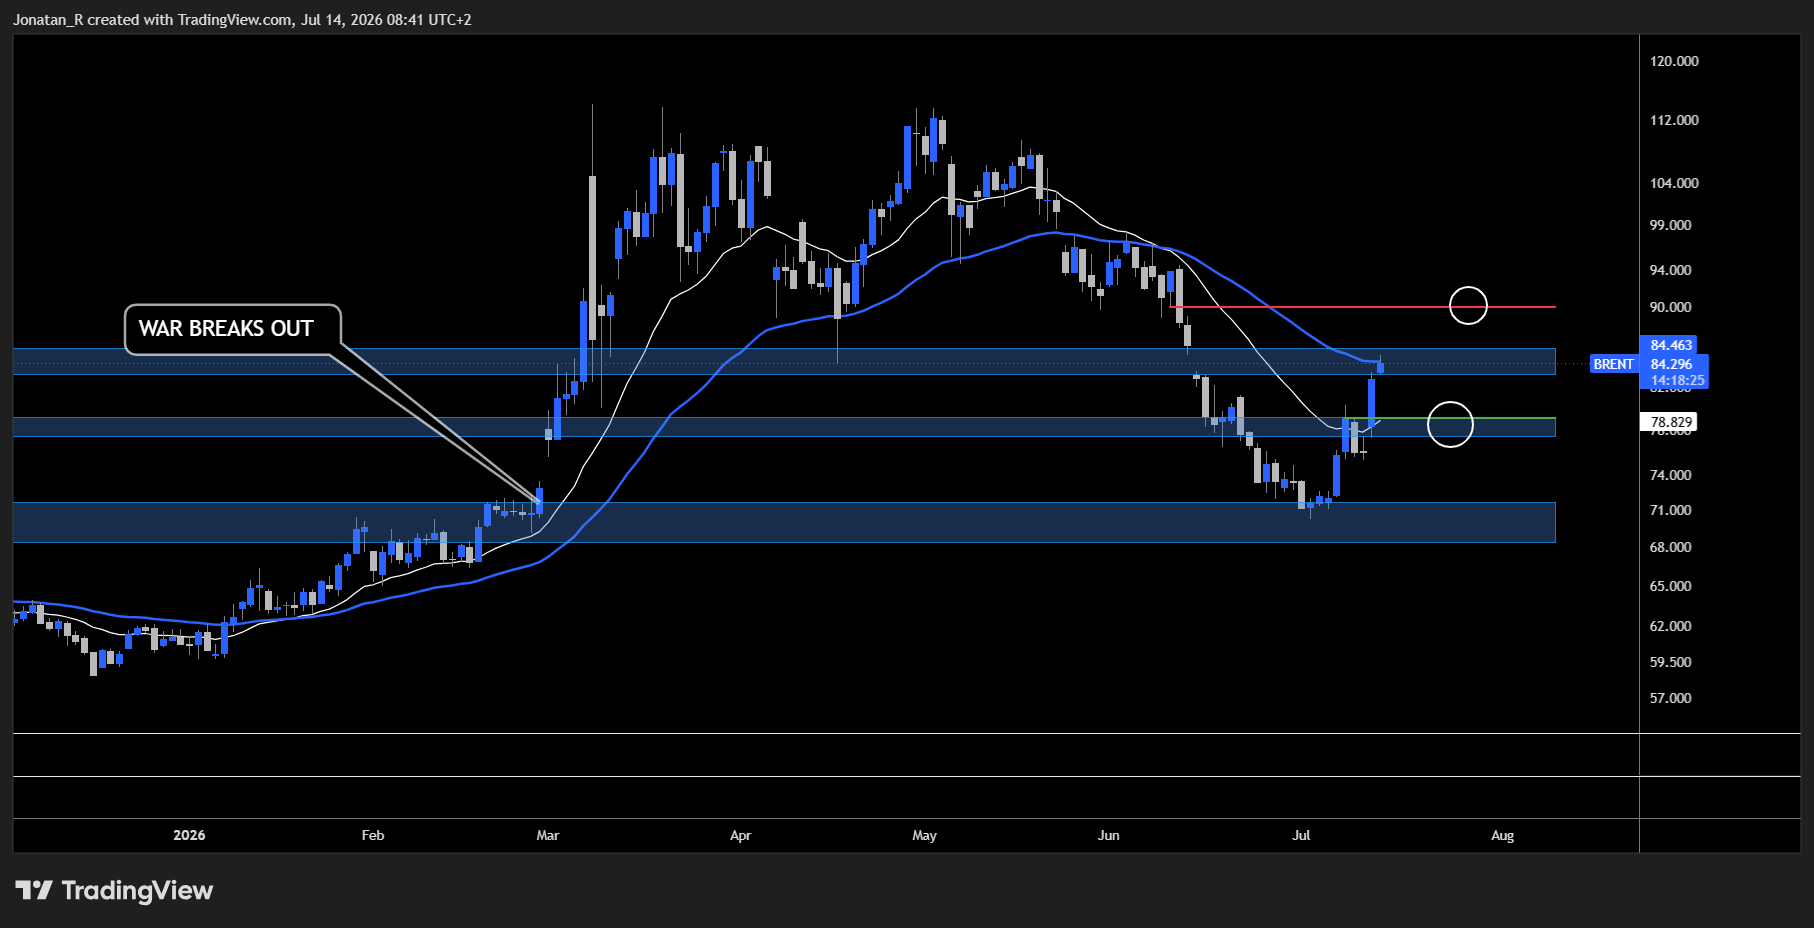
After hitting the support area down at around 70, where this whole situation started, we now see Brent back at the 85 resistance level, confluent with the daily 50 EMA.
The initial rejection at 78 and the daily 20 EMA that we wrote about in an earlier article did not hold for long, and price managed to push through it as buyers gained dominance. That same level now creates a possible support zone if this current 85 area holds as resistance.
Even if the situation in the Strait of Hormuz does not resolve in any meaningful way over the next few days or weeks, a pullback slightly lower could very well be possible, based simply on the mean-reverting nature of markets. In that case, the daily 20 EMA and the 79 area becomes interesting.
But if the situation does deteriorate and we see Brent move higher from here, the next possible resistance area sits at around 90.
This is still very much a headline-driven market, even though the whipsaw effects of President Trump’s posts have become less intense with time, as markets seem more used to it.
Brent crude 4H chart analysis
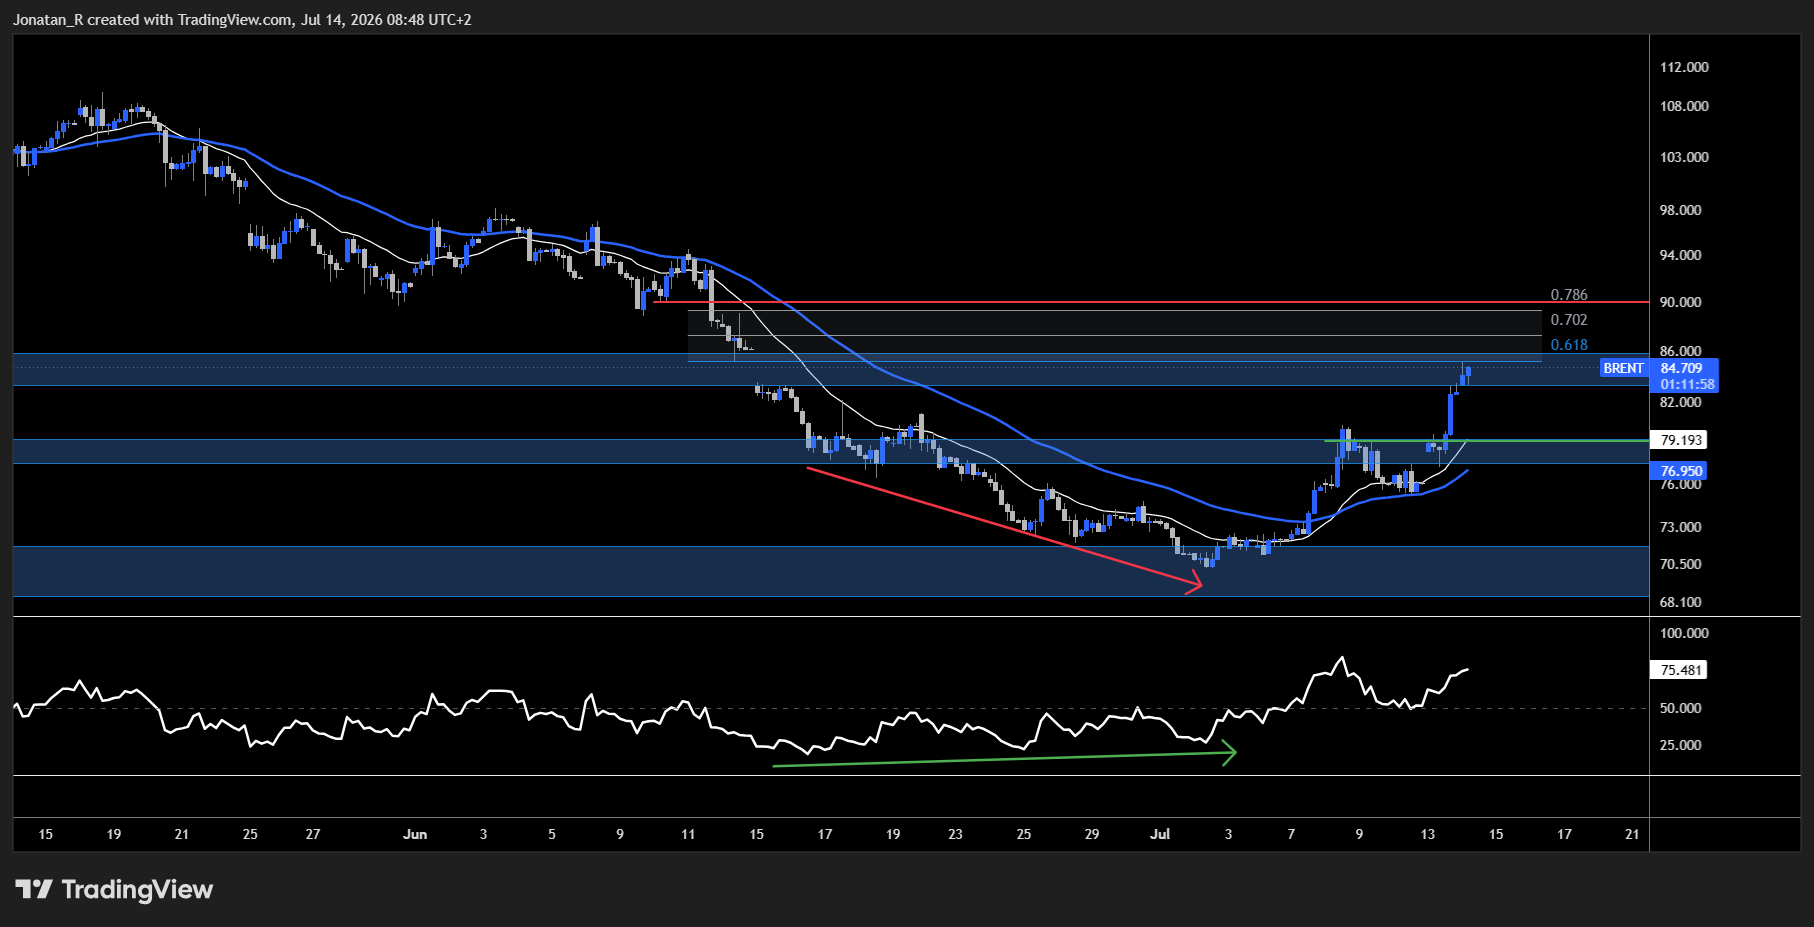
Here on the 4H, we see that the bullish RSI divergence we have been monitoring in previous articles has now played out, and we also see price about to potentially enter the local short reload zone.
That is the fib retracement area between the 0.618 and 0.786 fibs. This fib is measured using the high and the low of the latest strong down-move, the move that broke the 85 level and started the accelerated move down towards the pre-war levels.
This local short reload zone is an area where we usually see sellers stepping in, if not to form a long-term resistance, then at least for a temporary rejection. This area is also confluent with the daily 50 EMA and the 90 area explained in the daily chart analysis.
We can also see more clearly here on the 4H how clean the 79 to 80 area is for a possible retest, if this local short reload zone does act as resistance.
Trading involves risk.
Author



 Risk Disclaimer
The content provided here is for informational purposes only. It is not intended as personal investment advice and does not constitute a solicitation or invitation to engage in any financial transactions, investments, or related activities. Past performance is not a reliable indicator of future results.
The financial products offered by the Company are complex and come with a high risk of losing money rapidly due to leverage. These products may not be suitable for all investors. Before engaging, you should consider whether you understand how these leveraged products work and whether you can afford the high risk of losing your money.
The Company does not accept clients from the Restricted Jurisdictions as indicated in our website/ T&C. Some services or products may not be available in your jurisdiction.
The applicable legal entity and its respective products and services depend on the client’s country of residence and the entity with which the client has established a contractual relationship during registration.








