15 min read
 Curve DAO Token (CRV) trades near $0.24 in early August 2026, a long way below the levels it held a year ago and more than 96% under its 2021 cycle high. CRV is the governance token of Curve, the largest decentralized exchange built for low-slippage swaps between stablecoins and other like-priced assets. Holders lock CRV to earn a share of trading fees, boost liquidity rewards, and vote on where the protocol directs its token emissions. This page lays out PrimeXBT’s price outlook for CRV through 2030 and out to 2050, the levels traders are watching now, and the events most likely to move it. Where the evidence is thin, we say so rather than invent a number.
Curve DAO outlook at a glance
- Current price: $0.321 per CRV.
- 2026 base case: $0.221–$0.338, a consolidation year as fresh emissions keep a lid on the upside.
- Main bullish catalyst: a broad DeFi upcycle that lifts stablecoin swap volume and Curve’s fee income, paired with CRV’s scheduled emission cuts.
- Biggest downside risk: renewed selling from concentrated holders and a break below the $0.17 all-time low set in June 2026.
- Long-term view: a slow grind higher is the base case, but any figure past 2030 reads as a direction of travel, not a target.
Live Curve DAO price chart
Today (15 October 2026) Curve DAO (CRV/USD) is trading at $0.321 per CRV, with a market cap of $508,856,011 USD. The 24-hour trading volume amounts to $49,244,427 USD. CRV price has changed by -5.31% in the last 24 hours. Curve DAO’s circulating supply is 1,572,975,850 CRV.
Trading involves risk.
Curve DAO price prediction 2026–2030 (yearly forecast)
The table below sets our expected range for each year, built from a single continuous monthly path. The far more bullish institutional and algorithmic targets rest on different assumptions and are kept apart in the analyst section rather than blended in here.
| Year | Minimum | Average | Maximum |
|---|---|---|---|
| 2026 | $0.221 | $0.273 | $0.338 |
| 2027 | $0.299 | $0.432 | $0.584 |
| 2028 | $0.476 | $0.635 | $0.773 |
| 2029 | $0.447 | $0.588 | $0.740 |
| 2030 | $0.406 | $0.537 | $0.653 |
Curve DAO price prediction 2026
Our 2026 outlook holds CRV close to its early-August level near $0.24, a full-year range of $0.221–$0.338 that averages near $0.28. Curve still mints new CRV every week to reward liquidity providers, so supply grows while demand stays cyclical, and the base case is a market that consolidates rather than one that runs.
The month-by-month path firms only slightly into year-end, staying inside the compressed range that has defined most of 2026:
| Month (2026) | Minimum | Average | Maximum |
|---|---|---|---|
| August | $0.221 | $0.240 | $0.259 |
| September | $0.234 | $0.255 | $0.276 |
| October | $0.247 | $0.270 | $0.293 |
| November | $0.264 | $0.290 | $0.316 |
| December | $0.282 | $0.310 | $0.338 |
Curve DAO price prediction 2027
2027 is the first genuine recovery year in our path: CRV climbs off the base toward an average near $0.44, a full-year range of $0.299–$0.584. The step up leans on a wider DeFi recovery lifting stablecoin swap volume and Curve’s fee income, not on any single announcement.
| Month (2027) | Minimum | Average | Maximum |
|---|---|---|---|
| January | $0.299 | $0.330 | $0.361 |
| February | $0.316 | $0.350 | $0.384 |
| March | $0.333 | $0.370 | $0.407 |
| April | $0.350 | $0.390 | $0.430 |
| May | $0.367 | $0.410 | $0.453 |
| June | $0.384 | $0.430 | $0.476 |
| July | $0.398 | $0.447 | $0.496 |
| August | $0.410 | $0.462 | $0.514 |
| September | $0.422 | $0.476 | $0.531 |
| October | $0.433 | $0.491 | $0.549 |
| November | $0.445 | $0.505 | $0.566 |
| December | $0.456 | $0.520 | $0.584 |
Curve DAO price prediction 2028
2028 carries the cycle high in our model. The path peaks in this window and averages near $0.64 across the year, ranging $0.476–$0.773. Even at the top of that band CRV stays under $1, which keeps the round-number question honest: our numbers put a return to a dollar within reach only in a stronger scenario, not the base case.
| Month (2028) | Minimum | Average | Maximum |
|---|---|---|---|
| January | $0.476 | $0.545 | $0.613 |
| February | $0.496 | $0.569 | $0.642 |
| March | $0.516 | $0.594 | $0.672 |
| April | $0.536 | $0.618 | $0.701 |
| May | $0.555 | $0.643 | $0.731 |
| June | $0.575 | $0.668 | $0.761 |
| July | $0.581 | $0.677 | $0.773 |
| August | $0.575 | $0.672 | $0.769 |
| September | $0.568 | $0.666 | $0.765 |
| October | $0.562 | $0.661 | $0.760 |
| November | $0.555 | $0.655 | $0.756 |
| December | $0.549 | $0.650 | $0.751 |
Curve DAO price prediction 2029
2029 is the cool-down after the peak, a gradual fade to an average near $0.58 with a range of $0.447–$0.740. Emissions slow year by year, which softens the drawdown, but a post-peak year rarely holds the highs.
| Month (2029) | Minimum | Average | Maximum |
|---|---|---|---|
| January | $0.538 | $0.639 | $0.740 |
| February | $0.527 | $0.628 | $0.729 |
| March | $0.517 | $0.618 | $0.719 |
| April | $0.506 | $0.607 | $0.708 |
| May | $0.495 | $0.596 | $0.697 |
| June | $0.485 | $0.585 | $0.686 |
| July | $0.477 | $0.577 | $0.678 |
| August | $0.471 | $0.572 | $0.673 |
| September | $0.465 | $0.566 | $0.668 |
| October | $0.459 | $0.561 | $0.663 |
| November | $0.453 | $0.555 | $0.658 |
| December | $0.447 | $0.550 | $0.653 |
Curve DAO price prediction 2030
Our 2030 view averages near $0.54 across a range of $0.406–$0.653. Five years out the outlook rests on trajectory rather than precision, so read the month-by-month path as a shape, not a set of dated targets.
| Month (2030) | Minimum | Average | Maximum |
|---|---|---|---|
| January | $0.444 | $0.548 | $0.653 |
| February | $0.441 | $0.547 | $0.653 |
| March | $0.439 | $0.545 | $0.652 |
| April | $0.436 | $0.544 | $0.652 |
| May | $0.433 | $0.542 | $0.651 |
| June | $0.431 | $0.541 | $0.651 |
| July | $0.427 | $0.538 | $0.649 |
| August | $0.423 | $0.535 | $0.646 |
| September | $0.418 | $0.531 | $0.643 |
| October | $0.414 | $0.527 | $0.640 |
| November | $0.410 | $0.524 | $0.637 |
| December | $0.406 | $0.520 | $0.634 |
Curve DAO long-term price prediction: 2035, 2040–2050
Put a decade between today and a price, and the honest answer is that nobody can model it. Emission schedules, DeFi’s share of finance, and the macro backdrop all drift too far to pin a number to a year, so treat the figures below as a widening cone rather than a forecast. On that basis, our long-range path grinds higher without ever going vertical: an average near $0.78 in 2035, near $1.05 in 2040 — the point where CRV reclaims a dollar in our model — and near $1.65 by 2050.
| Year | Minimum | Average | Maximum |
|---|---|---|---|
| 2035 | $0.577 | $0.780 | $0.983 |
| 2040 | $0.714 | $1.050 | $1.386 |
| 2050 | $0.990 | $1.650 | $2.310 |
What analysts and models say (compared)
Forecasts for CRV sit unusually far apart. Near-term algorithmic models see the price roughly flat, while some editorial forecasters project multiples of today’s level within a few years. Averaging views built on incompatible assumptions would mislead more than it informs, so they are laid out side by side.
| Source | Method | CRV view |
|---|---|---|
| CoinCodex | Algorithmic | Near-term ~$0.23–$0.24, roughly flat into late 2026 |
| Changelly | Algorithmic | 2026 avg ~$0.57; 2030 avg ~$2.71 |
| Coinpedia | Editorial | 2026 range ~$0.45–$3.00; 2030 avg ~$6.50 |
The gap is the point. Short-horizon models extrapolate the current range and land near $0.24; multi-year forecasts assume a full DeFi bull market and a market that stops discounting Curve’s emissions, and they scale accordingly. PrimeXBT’s own path sits below the bullish camp because it weighs the dilution and concentrated-holder overhang more heavily than a trend-following model does. Anyone hunting for a single agreed number will not find one here.
Track record of this forecast
This is the first CRV forecast PrimeXBT has published, so there is no earlier call to grade yet. From the next monthly revision on, this section will set the previous forecast against CRV’s actual price on the update date and explain any miss instead of quietly resetting the numbers.
Curve DAO technical analysis
As of early August 2026, CRV trades around $0.24, and its 50-day and 200-day simple moving averages sit almost on top of each other near $0.215 — a convergence that marks a market coiled in a tight range rather than one that is trending. The RSI has hovered around its neutral 50 line through late July, without locking into a sustained overbought or oversold reading.
The support and resistance levels that matter now: support at roughly $0.20, then $0.19, with the $0.17 all-time low from June 2026 as the last line before price discovery; resistance near $0.26, then the $0.30 area, with a heavier band around $0.44. A clean move back above $0.30 would be the first real signal that the year-long downtrend has cracked. Market-wide sentiment, tracked by the Fear & Greed Index, has swung between “Fear” and “Neutral” in recent weeks, with readings in the high-20s to mid-40s.
Correlation with other assets
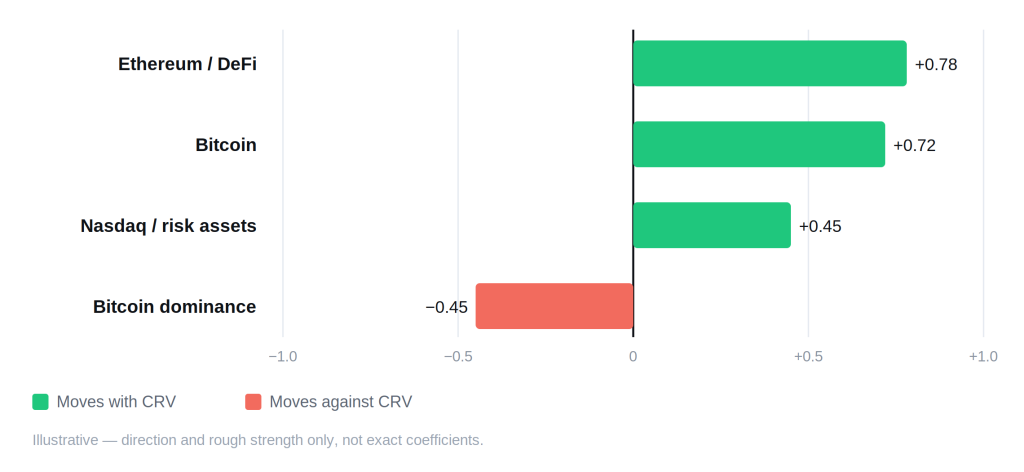
CRV trades as a high-beta bet on Bitcoin and on DeFi as a sector. When Bitcoin rallies, CRV tends to move further in the same direction; when it drops, CRV usually falls harder. The token also runs inverse to Bitcoin dominance — as capital concentrates into Bitcoin, governance tokens like CRV are among the first to bleed. What sets CRV apart from a generic altcoin is where its underlying demand comes from: the stablecoin and pegged-asset swap volume flowing through Curve, the total value locked across its pools, and the incentive economy around locked CRV, where protocols pay to steer emissions toward the pools they care about. Since institutions treat crypto as a risk asset, CRV also tracks the Nasdaq more closely than it once did, which is why Federal Reserve policy reaches its price quickly. Gold and the dollar index tell you little about CRV; DeFi regulation and headlines about large holders tell you far more. These are directional tendencies that loosen and tighten with the cycle.
Fundamental factors
Curve is the leading stableswap automated market maker, engineered to swap stablecoins and other assets that should trade near the same price with minimal slippage. That focus made it core plumbing for DeFi. CRV sits at the center of it through the vote-escrow model: lock CRV for up to four years and you receive veCRV, which grants boosted rewards on liquidity you provide, votes over which pools earn CRV emissions, and a cut of protocol trading fees. Locking is a one-way commitment for the term, so it takes tokens off the market in a way ordinary staking does not.
That voting power turned into a market of its own. In the so-called Curve Wars, protocols such as Convex compete to accumulate veCRV and direct emissions toward their own liquidity, and they bid for votes to do it. Curve also runs its own stablecoin, crvUSD, whose LLAMMA design liquidates collateral gradually as price falls rather than in one hit, softening the shocks that break other lending systems. The counterweight to all of this is supply. CRV is inflationary: against a maximum of about 3.03 billion tokens, roughly 1.55 billion circulate today, and the protocol keeps minting to reward liquidity providers. Emissions now run near 6% a year after the founding team’s vesting ended in 2024, and they step down by roughly 16% on each yearly schedule, but a token whose float is still expanding faces a headwind most large caps do not.
The other fundamental is idiosyncratic. Founder Michael Egorov held very large CRV-collateralized loans, and in June 2024 a sharp CRV drop cascaded into forced liquidation of about $141 million in positions, leaving roughly $10 million of bad debt on Curve’s lending market. The debt was cleared within days, partly through an over-the-counter sale of CRV to outside buyers, and depositors took no permanent loss. The episode did lasting damage anyway: it fixed the idea of a concentrated-holder overhang in the market’s mind, and CRV has traded under that shadow since.
Upcoming catalysts
Only confirmed, dated events are listed. With CRV now moving alongside risk assets, macro policy is the clearest near-term driver, and the token’s own emission schedule is the rare crypto-specific date that is fixed in advance.
| Date | Event | Potential impact |
|---|---|---|
| Mid-August 2026 | Scheduled annual CRV emission reduction (~16%), per Curve’s programmed schedule | Marginally supportive: slows the rate of new supply |
| September 15–16, 2026 | FOMC meeting (with economic projections) | Bull if the Fed signals cuts; bear if it holds rates higher for longer |
| October 27–28, 2026 | FOMC meeting | Rate path steers risk appetite across DeFi tokens |
| December 8–9, 2026 | FOMC meeting (with economic projections) | Year-end policy signal for 2027 positioning |
FOMC dates follow the Federal Reserve’s published 2026 schedule. The emission cut follows Curve’s fixed reduction formula rather than a discretionary announcement, which is why it can be dated in advance while most protocol events cannot.
Bull case vs bear case
Bull case:
- A DeFi upcycle lifts stablecoin swap volume through Curve, and fee income to veCRV lockers rises with it.
- The Fed shifts to cuts, and capital rotates back toward risk assets including governance tokens.
- Slowing emissions gradually tip the balance between new supply and locked-up float.
- crvUSD adoption grows, deepening Curve’s role beyond a swap venue.
Bear case:
- Emissions keep outpacing demand, and the expanding float caps every rally.
- Concentrated holders sell again, reviving the overhang that has dogged CRV since 2024.
- Bitcoin dominance climbs, draining liquidity out of altcoins and DeFi.
- DeFi regulation tightens, pressuring on-chain volume and CRV with it.
Invalidation levels. The bullish case loses its footing if CRV closes below the $0.17 all-time low, which would open unmapped territory beneath it. The bearish case starts to break on a sustained move back above $0.30 — first reclaiming the $0.215 moving-average cluster, then holding above it. That $0.30 line sits well above the early-August price and marks where the year-long downtrend would come into question.
Historical performance
CRV’s history reads as one long de-rating punctuated by brief spikes. Its meaningful high sits near $6.50, reached in early 2021; a larger figure shows up on some launch-day charts from August 2020, but it printed on paper-thin liquidity in the token’s first hours and never held as a level the market traded with any depth. From that 2021 peak the token lost the vast majority of its value over the following years, dragged down by relentless emissions and the 2024 founder-liquidation episode. A short rally in December 2024 briefly carried CRV back above $1 before it rolled over again. By mid-2026 the price had fallen to a fresh all-time low near $0.17. The pattern to take from it is that CRV rewards timing the cycle far more than holding through it.
Is Curve DAO a good investment in 2026?
Whether CRV earns a place in a portfolio comes down to two bets: that DeFi keeps taking share, and that Curve’s demand finally outgrows its emissions. Our outlook has CRV roughly flat into year-end, averaging near $0.28, with the market consolidating rather than turning. The facts underneath are plain: the token trades at an all-time low, sentiment is cautious, its 50- and 200-day averages have collapsed into one line near $0.215, and an expanding supply works against every rally. The protocol itself stays healthy, with billions locked and a central role in stablecoin trading. Read as a discounted bet on DeFi’s plumbing or as a value trap held down by dilution — the case runs both ways, and the reader’s horizon decides which.
How to trade Curve DAO on PrimeXBT
On PrimeXBT you can take a position on Curve DAO in either direction. CFDs on CRV can be traded long or short, so a trader can act on a bullish or a bearish view without holding the token. Leverage magnifies gains and losses alike, which makes position sizing and a stop-loss matter on any trade, and short selling lets you position for a decline as readily as for a rise. Trade on your own analysis and risk tolerance, and never commit more than you can afford to lose.
Trading involves risk.
How we build this forecast
PrimeXBT’s analysts assemble this outlook rather than copy it from a single price feed. We start from where CRV trades today, read its position against the 50- and 200-day moving averages and the support and resistance levels traders are acting on, weigh the fundamentals — emission schedule, veCRV locking, stablecoin swap volume, and the concentrated-holder overhang — and set all of it against the macro backdrop, chiefly the path of U.S. interest rates. The yearly ranges join that technical read to the fundamental and macro picture; the long-range figures lean on trajectory over precision.
None of this is a promise. Crypto moves fast, the inputs change, and a single macro or on-chain shock can push CRV further than any model expects. Treat every figure here as a considered estimate rather than a guarantee, and note that we revisit the outlook monthly as the data shifts.
How much will CRV be worth in 2026?
Our outlook averages near $0.28 for 2026, with the price consolidating close to where it trades now rather than breaking out.
How much will CRV be worth in 2030?
Our long-range view averages near $0.54 for 2030. On a five-year horizon, treat that as a direction rather than a fixed target, since the plausible range is wide.
Will CRV reach $1?
Not in our base case through 2030 — the top of our modeled path peaks near an average of $0.66 in 2028, below a dollar. CRV reclaiming $1 would take a full DeFi bull market and lighter emissions; our long-range path only crosses that level around 2040.
Is Curve DAO a good investment in 2026?
The case cuts both ways: a roughly flat near-term outlook, an all-time-low price, and cautious sentiment, set against a protocol that still anchors stablecoin trading in DeFi. Horizon and risk tolerance decide it.
Why is CRV trading so far below its old highs?
Three forces stack up: steady token emissions that keep expanding the supply, the overhang left by the founder's 2024 loan liquidations, and a long DeFi downturn. Together they have kept CRV near record lows even as the protocol itself stays widely used.
Author



 Risk Disclaimer
The content provided here is for informational purposes only. It is not intended as personal investment advice and does not constitute a solicitation or invitation to engage in any financial transactions, investments, or related activities. Past performance is not a reliable indicator of future results.
The financial products offered by the Company are complex and come with a high risk of losing money rapidly due to leverage. These products may not be suitable for all investors. Before engaging, you should consider whether you understand how these leveraged products work and whether you can afford the high risk of losing your money.
The Company does not accept clients from the Restricted Jurisdictions as indicated in our website/ T&C. Some services or products may not be available in your jurisdiction.
The applicable legal entity and its respective products and services depend on the client’s country of residence and the entity with which the client has established a contractual relationship during registration.