5 min read
 Ethereum has broken out of the range that held it through the summer after the US Treasury said it would at least double the size of its long-dated bond buyback operations, pushing long-end yields lower and lifting risk assets across the board. Ether has led the move rather than followed it, gaining close to 25% over the week and comfortably outpacing Bitcoin, while spot Ethereum ETFs recorded their largest single day of net inflows since October last year at roughly $189m.
The weekly chart
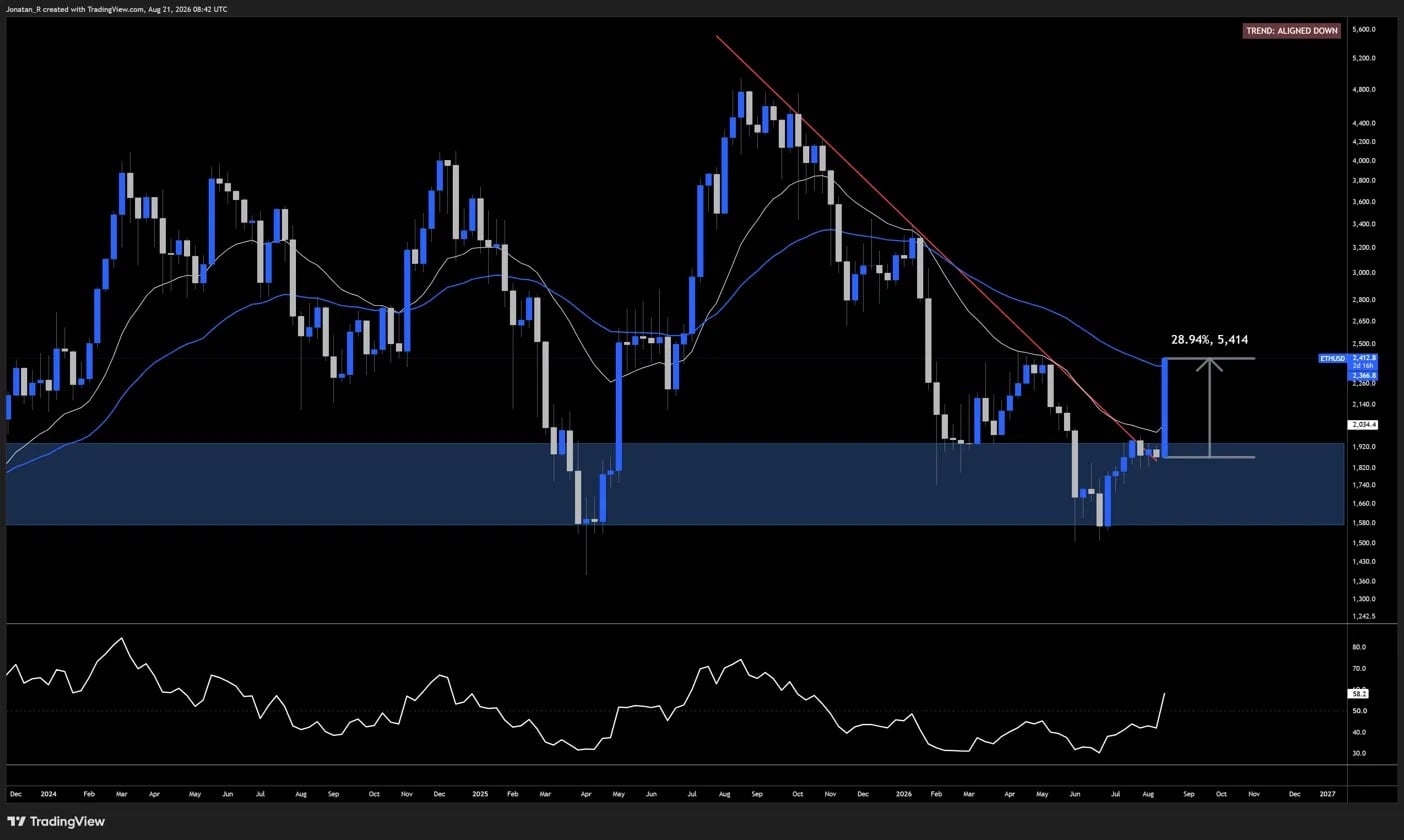
Ethereum’s weekly chart showing the break above the long-term descending trendline and both weekly moving averages.
The picture here has changed substantially since our previous coverage of Ethereum, when price was sitting on multi-year support with the weekly RSI down near 30 and no bullish divergence in place. Ethereum has now broken above a significant high-timeframe trendline area marked in red, and it is also trading above the weekly 20 EMA in white and the weekly 50 EMA in blue for the first time since it broke below both of them in January this year. The weekly RSI is back above 50 for the first time since November last year. This weekly candle is one of the largest Ethereum has produced in years, with almost a 29% gain in less than one week.
The daily chart
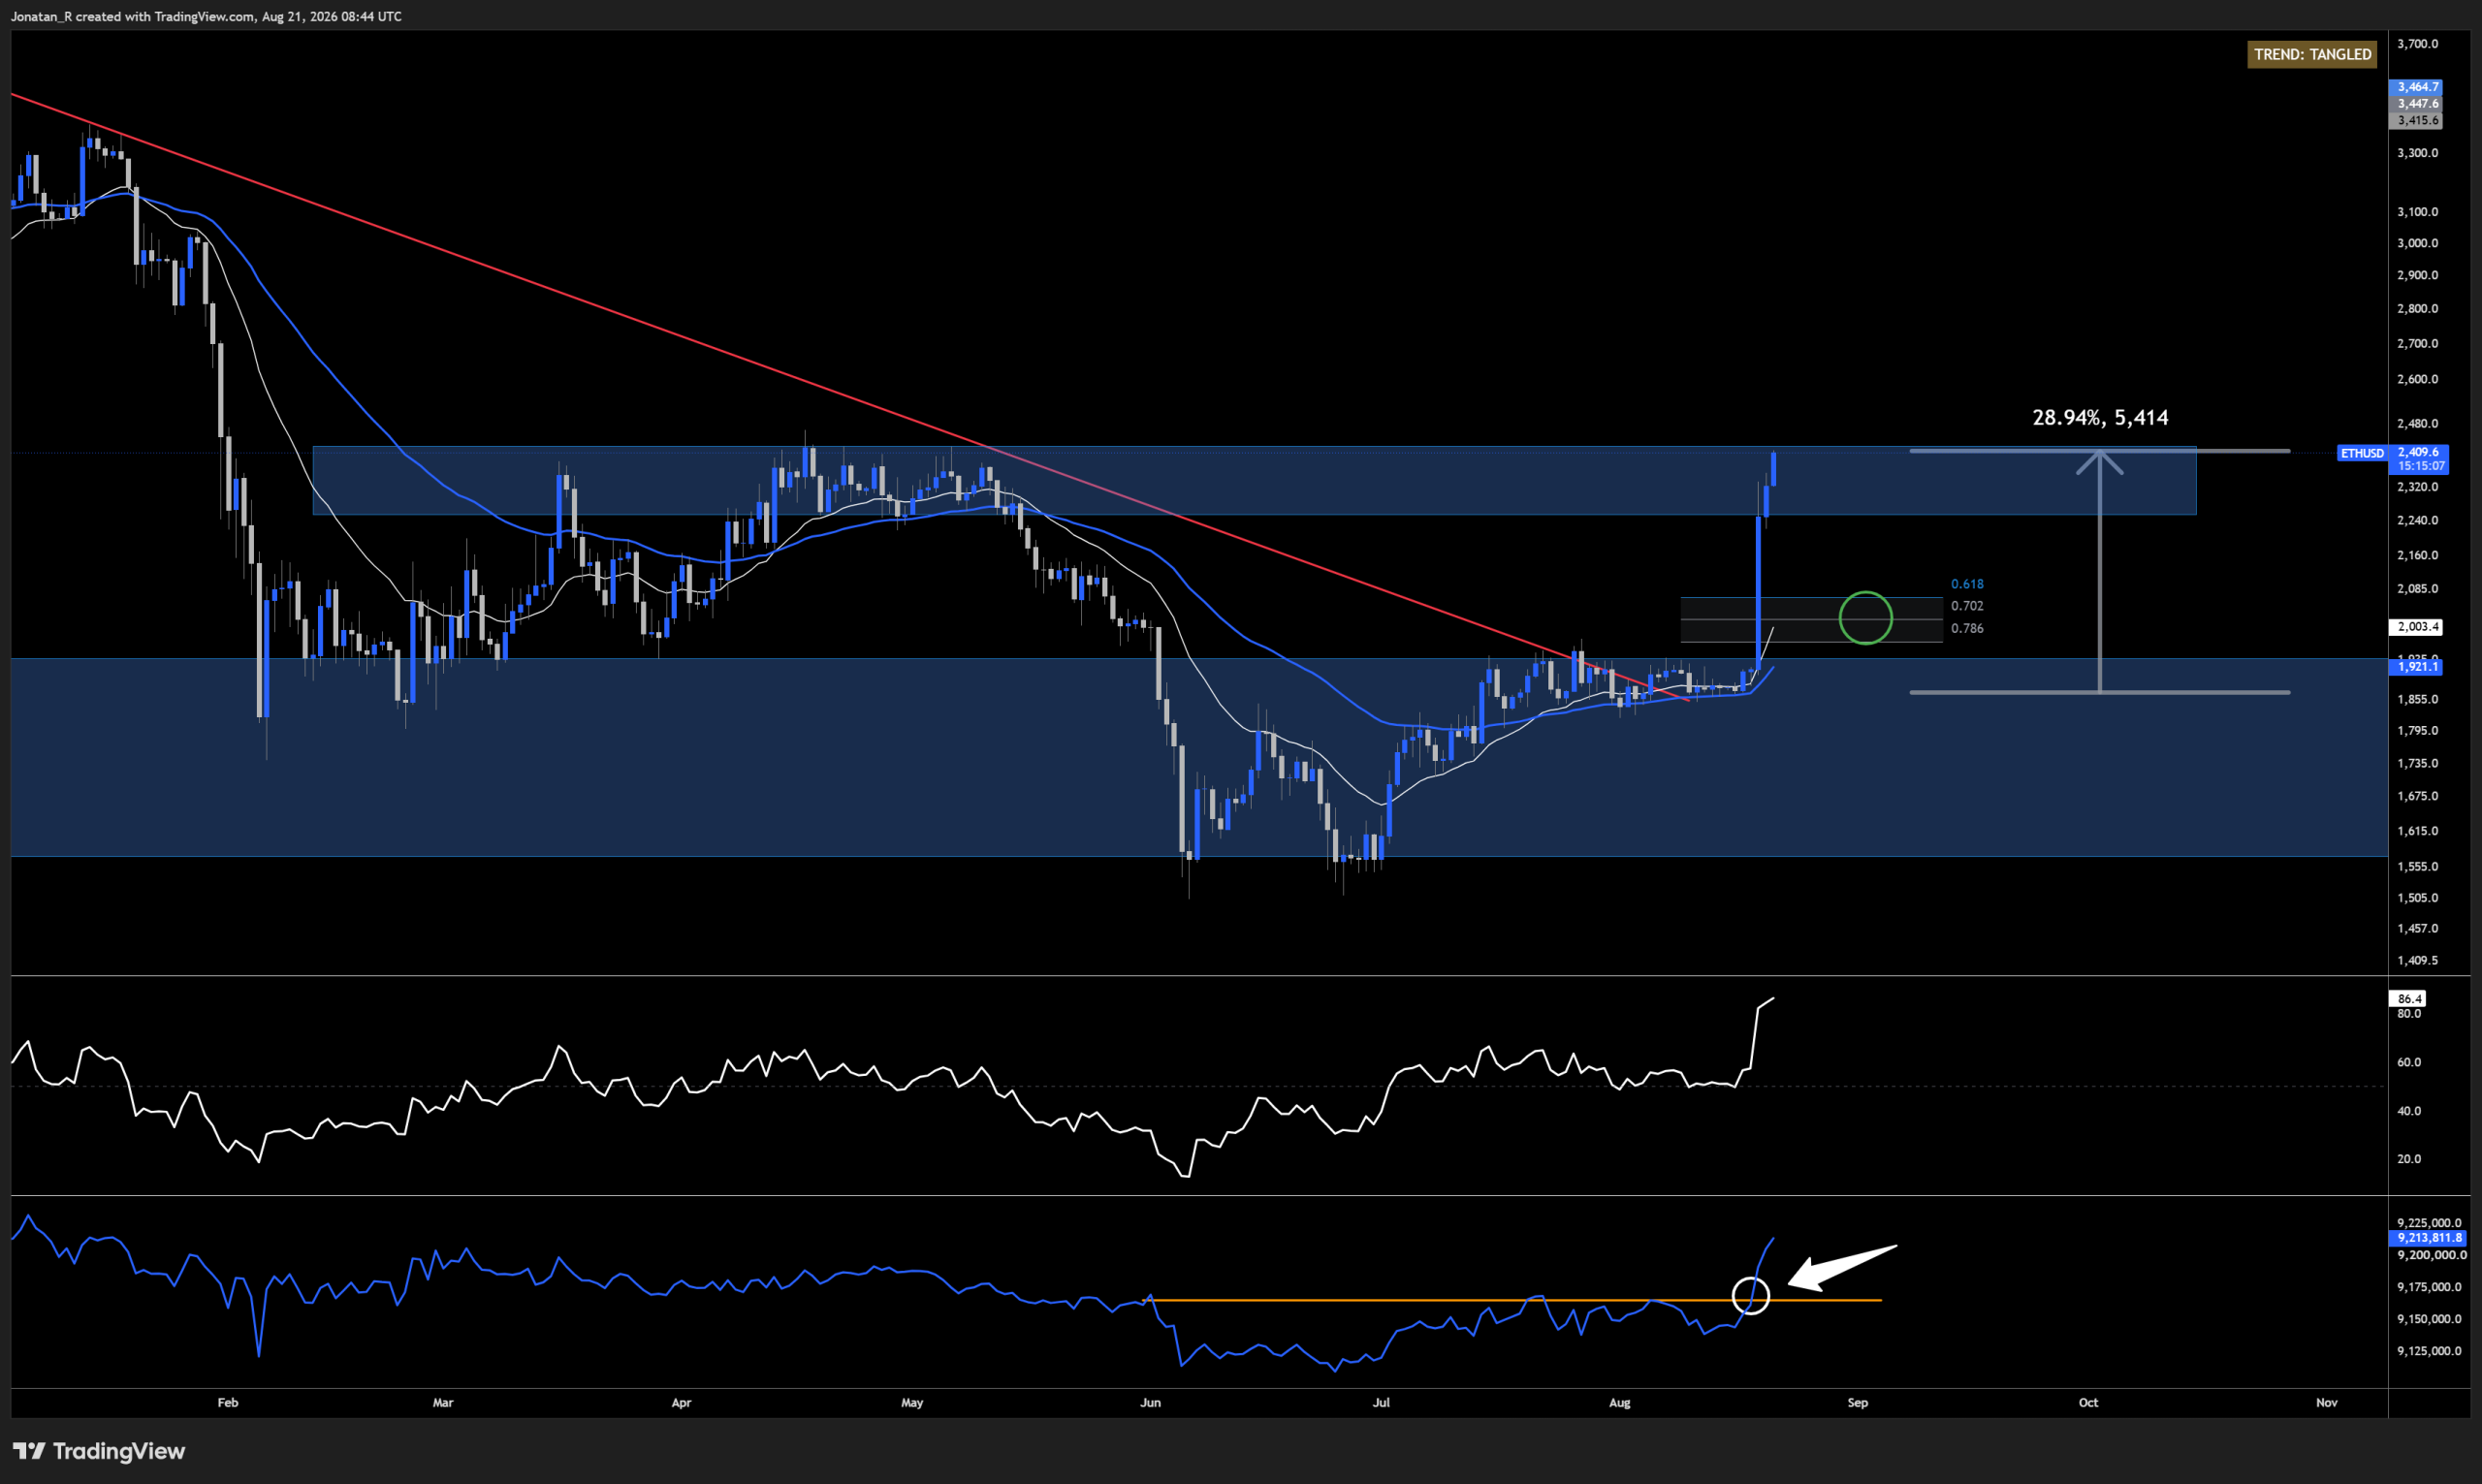
Ethereum’s daily chart with the high-timeframe resistance zone above and the Fibonacci reload zone beneath current price.
On the daily we can see how powerful this move really is. The RSI has gone straight up into extreme overbought levels, and a lot of people will look at that and say it has to correct somehow. That is not necessarily the right way of reading the RSI. Overbought does not mean price has to reverse, and what it is telling us here is that there is very strong momentum behind this bullish move.
If we look at the accumulation and distribution line below, it has now broken above a significant level marked in orange, with that break area marked by the white circle. Price is now testing the high-timeframe resistance zone sitting right at around 2,400, and that would be a crucial level to reclaim if we do get a reversal from current levels.
We can add Fibonacci levels from the beginning of the breakout move to the high of the current move. Adding the long reload zone, the area between the 0.618 and the 0.786, the mid part of that zone falls right at around 2,000, marked with the green circle. This is also where the daily 20 EMA currently sits. Even if price were to fall all the way back down to 2,000, a hold at that level would still be a significant bullish development for Ethereum.
The 1-hour chart
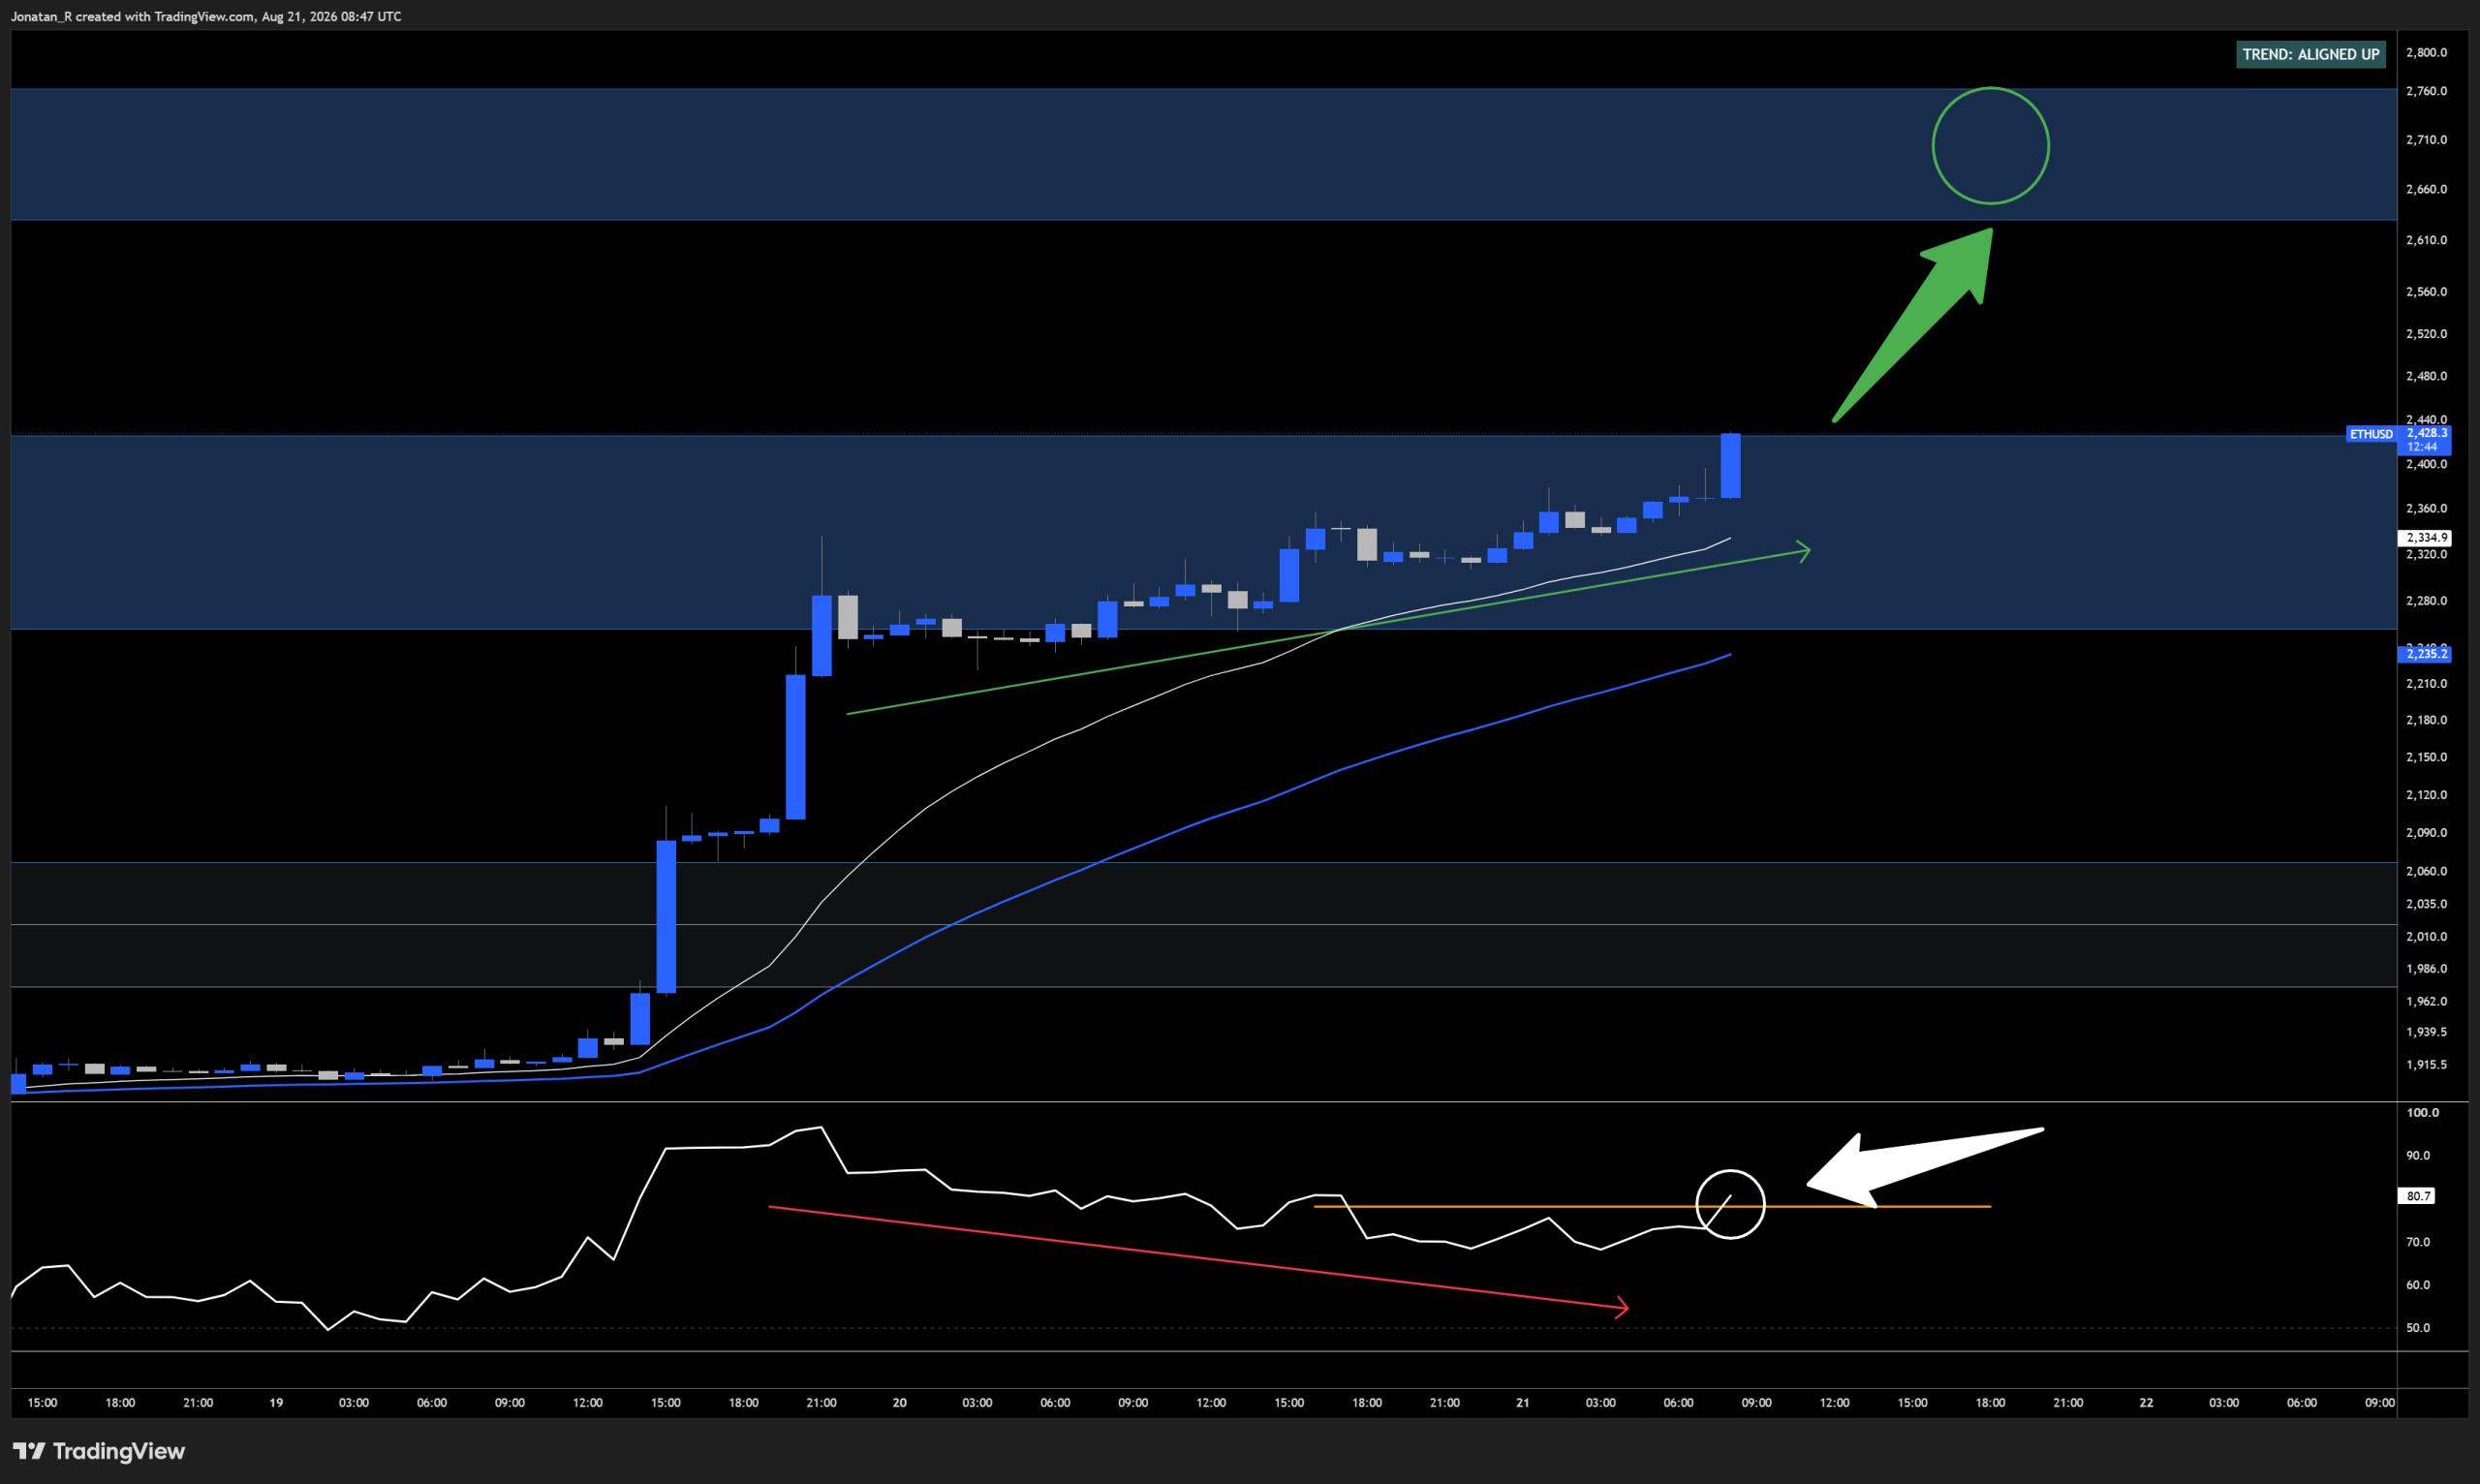
Ethereum’s 1-hour chart showing the RSI divergence and the next resistance zone above.
Looking at intraday price action, there is a clear bearish divergence between the 1-hour RSI and price. Again, that does not mean price has to reverse, but it is something to keep in mind and potentially something to stay cautious about, even though it now looks like the RSI could be breaking out into new highs, marked with the orange line and the breakout area inside the white circle. If this rally continues to the upside, the next major area of resistance sits above, starting at around 2,600 and marked with the green circle.
Trade Now
Trading involves risk.
Author



 Risk Disclaimer
The content provided here is for informational purposes only. It is not intended as personal investment advice and does not constitute a solicitation or invitation to engage in any financial transactions, investments, or related activities. Past performance is not a reliable indicator of future results.
The financial products offered by the Company are complex and come with a high risk of losing money rapidly due to leverage. These products may not be suitable for all investors. Before engaging, you should consider whether you understand how these leveraged products work and whether you can afford the high risk of losing your money.
The Company does not accept clients from the Restricted Jurisdictions as indicated in our website/ T&C. Some services or products may not be available in your jurisdiction.
The applicable legal entity and its respective products and services depend on the client’s country of residence and the entity with which the client has established a contractual relationship during registration.