5 min read
Gold fell more than 3.5% on Friday and touched around $3,870 an ounce, its lowest level since October 2025. The drop came during a sharp sell off in US technology stocks, and it appears that some investors sold gold to raise cash and cover losses elsewhere. The Federal Reserve (Fed) also remains a headwind. It held interest rates at 3.75% to 4.00% last week, but two officials voted for a hike, and markets are leaning towards a hike in December. Higher rates tend to weigh on gold because it doesn’t pay any interest. Gold is trying to recover today as oil prices ease, with the US midterm elections on Tuesday and the US jobs report on Friday.
Weekly chart: gold closes below its range
In our previous gold analysis, we said a break below the bottom of the range could bring the 3,400 area into view. Gold has now broken below that range. Last week’s candle closed around 3,875, the first weekly close below the 3,920 to 4,180 area since it formed in October 2025.
- Trend: gold has made lower highs and lower lows since its peak in early 2026, which is how Dow Theory defines a downtrend.
- Old support: 3,920 could now act as resistance, as a level that breaks often flips from support to resistance when price returns to it. A weekly close back above it could suggest the break was a false move.
- First support below: around 3,700, a minor level that also marks a 50% pullback of the rally that began in October 2023.
- Next major zone: 3,200 to 3,440, where gold traded sideways between April and August 2025. The 61.8% Fibonacci retracement of the same rally, near 3,250, also sits inside this zone.
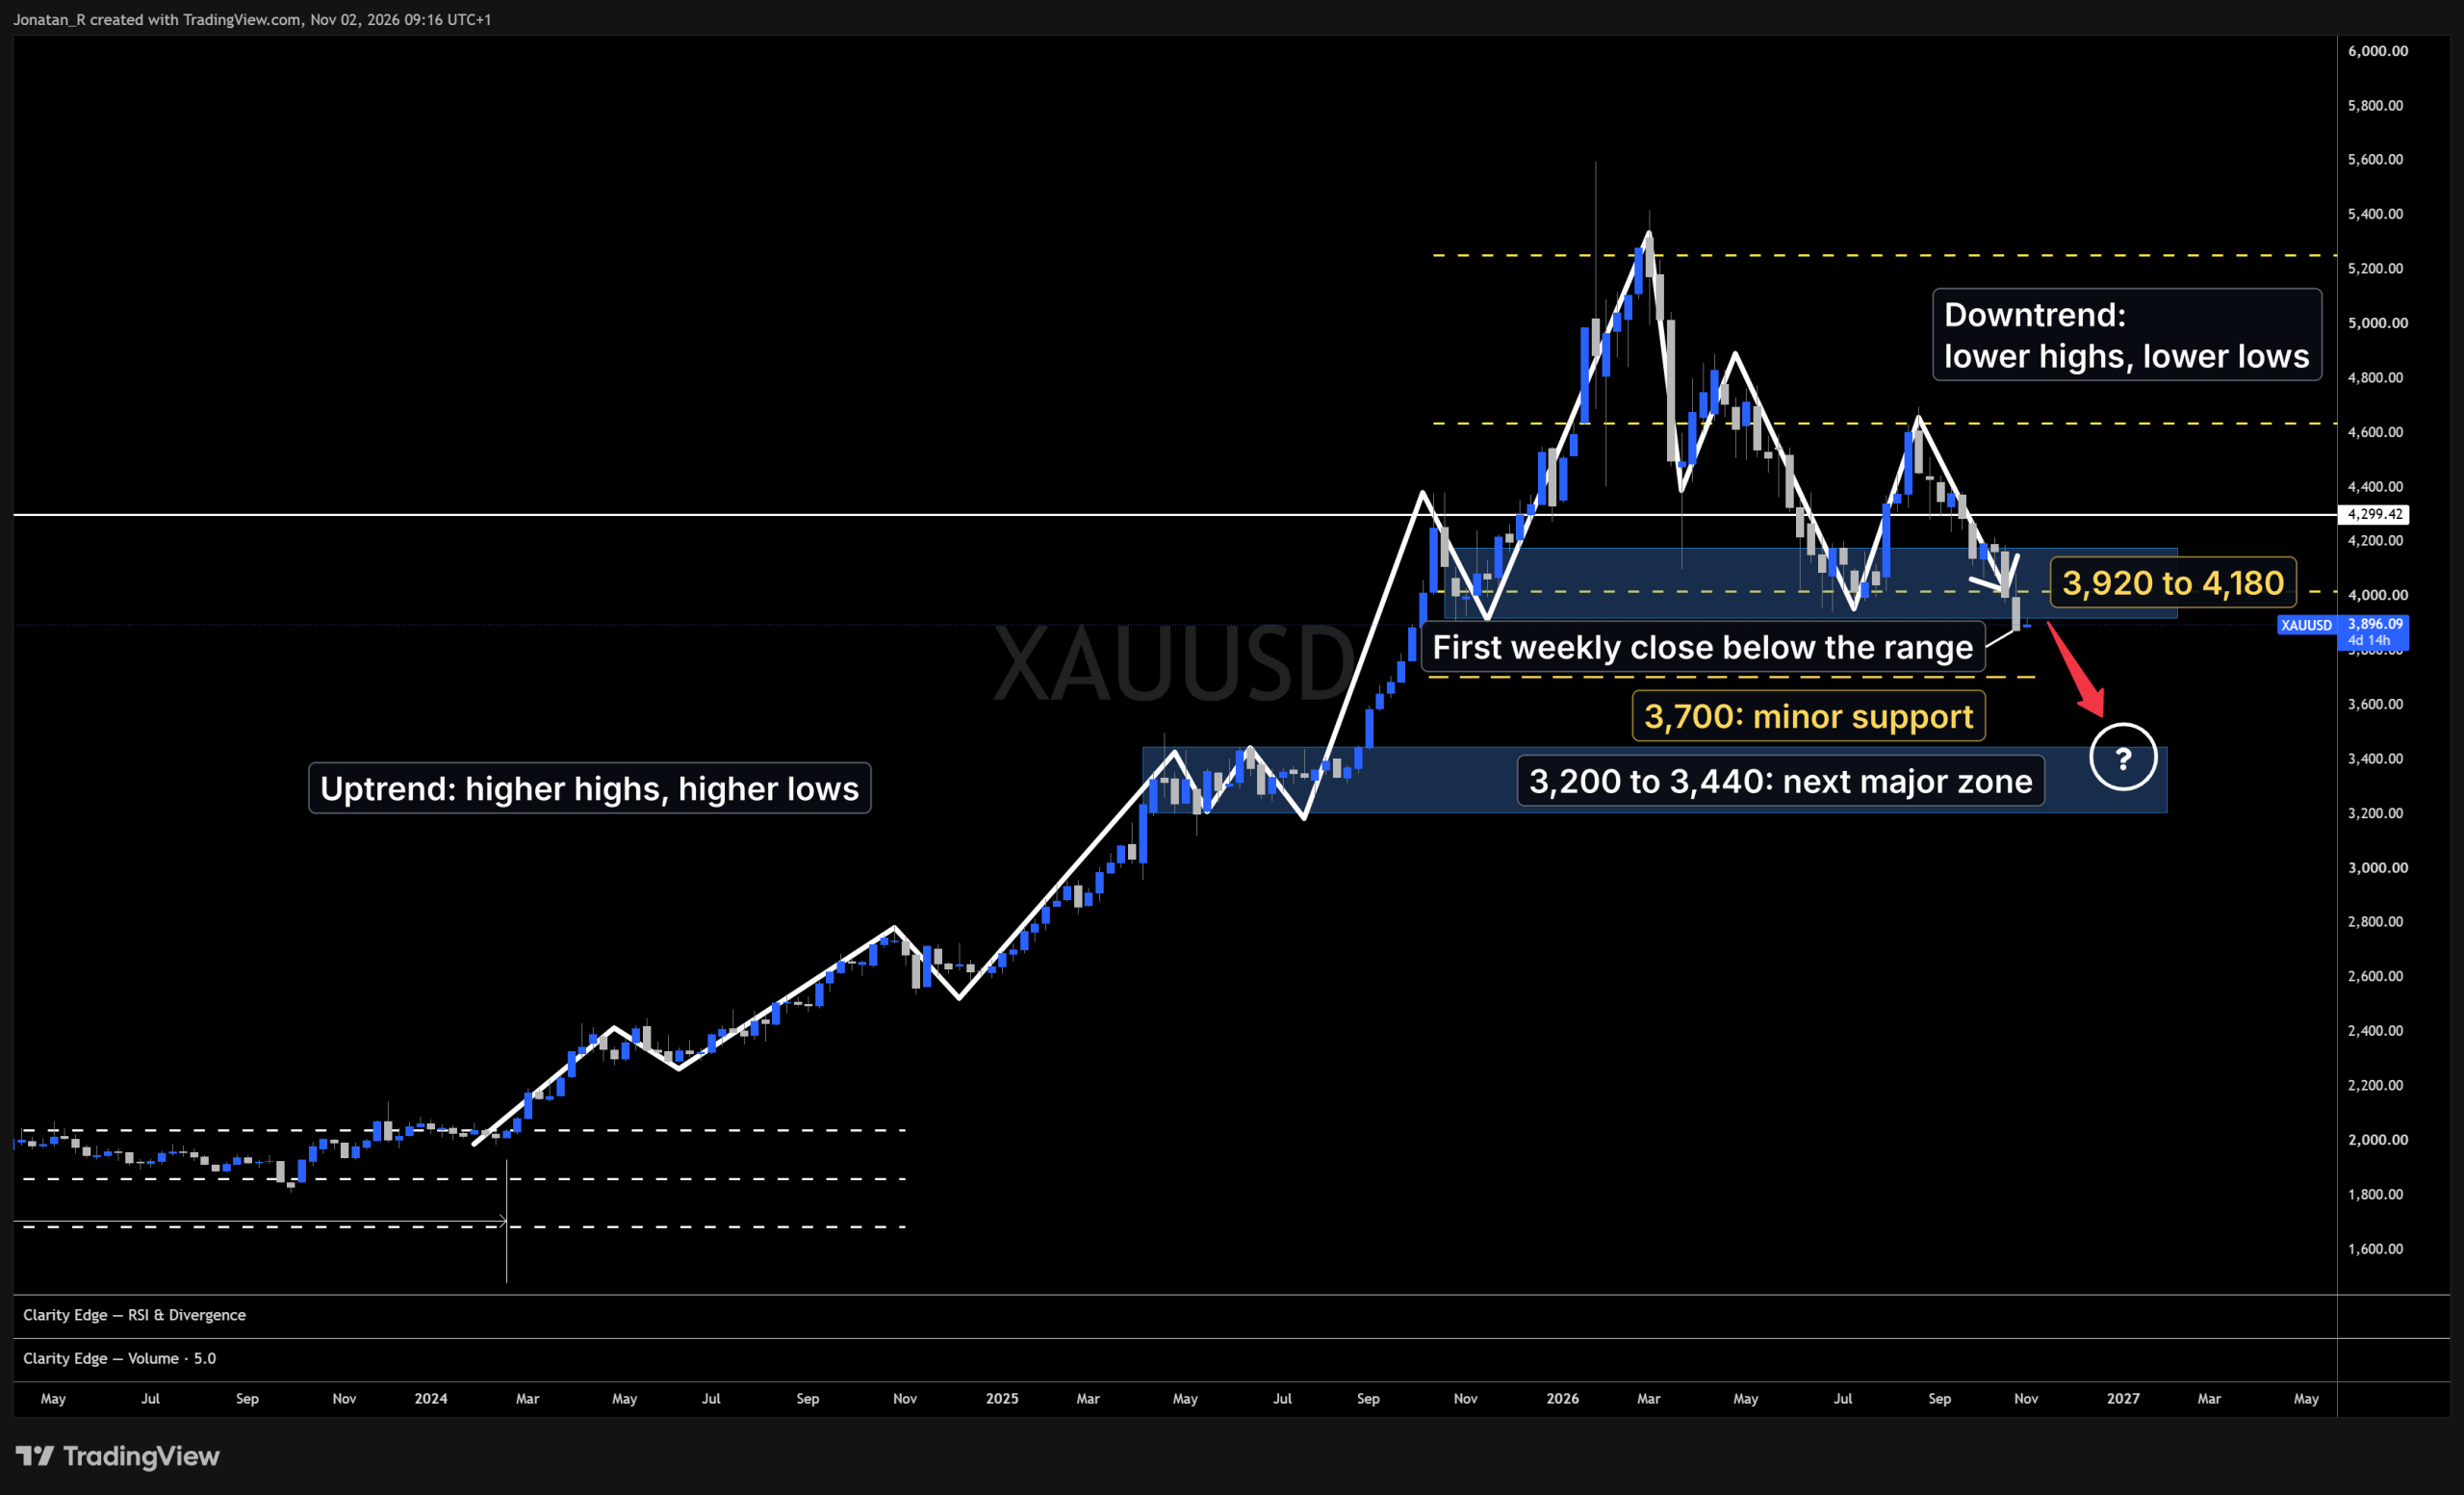
Gold closed a week below the range that has held since October 2025, with the 3,700 area and the 3,200 to 3,440 zone the next levels below.
4 hour chart: the bounce runs into old support
On the 4 hour chart, today’s bounce has stalled around 3,919, right under the bottom of the weekly range, and gold is trading around [3,894]. Price sits well below the 20 exponential moving average (EMA) at 3,966 and the 50 EMA at 4,018. Both are falling, which keeps the short term trend pointing down. The Fibonacci retracement from the 4,083 high to Friday’s 3,870 low shows where a bigger bounce could meet sellers.
- 3,975 to 3,996: old support that could now act as resistance, with the 0.5 retracement at 3,976.
- 4,001 to 4,037: the 0.618 to 0.786 retracement zone. The 50 EMA and the 0.702 retracement both sit near 4,018, inside this zone.
- Bearish scenario: a rejection below 3,920, followed by a break of Friday’s low at 3,870, could open the way towards the 3,700 area.
- Bullish scenario: a reclaim of 3,920, followed by a successful retest, could open the way towards the 20 EMA at 3,966 and the 3,975 to 3,996 area. The structure could stay bearish while gold holds below 4,083.
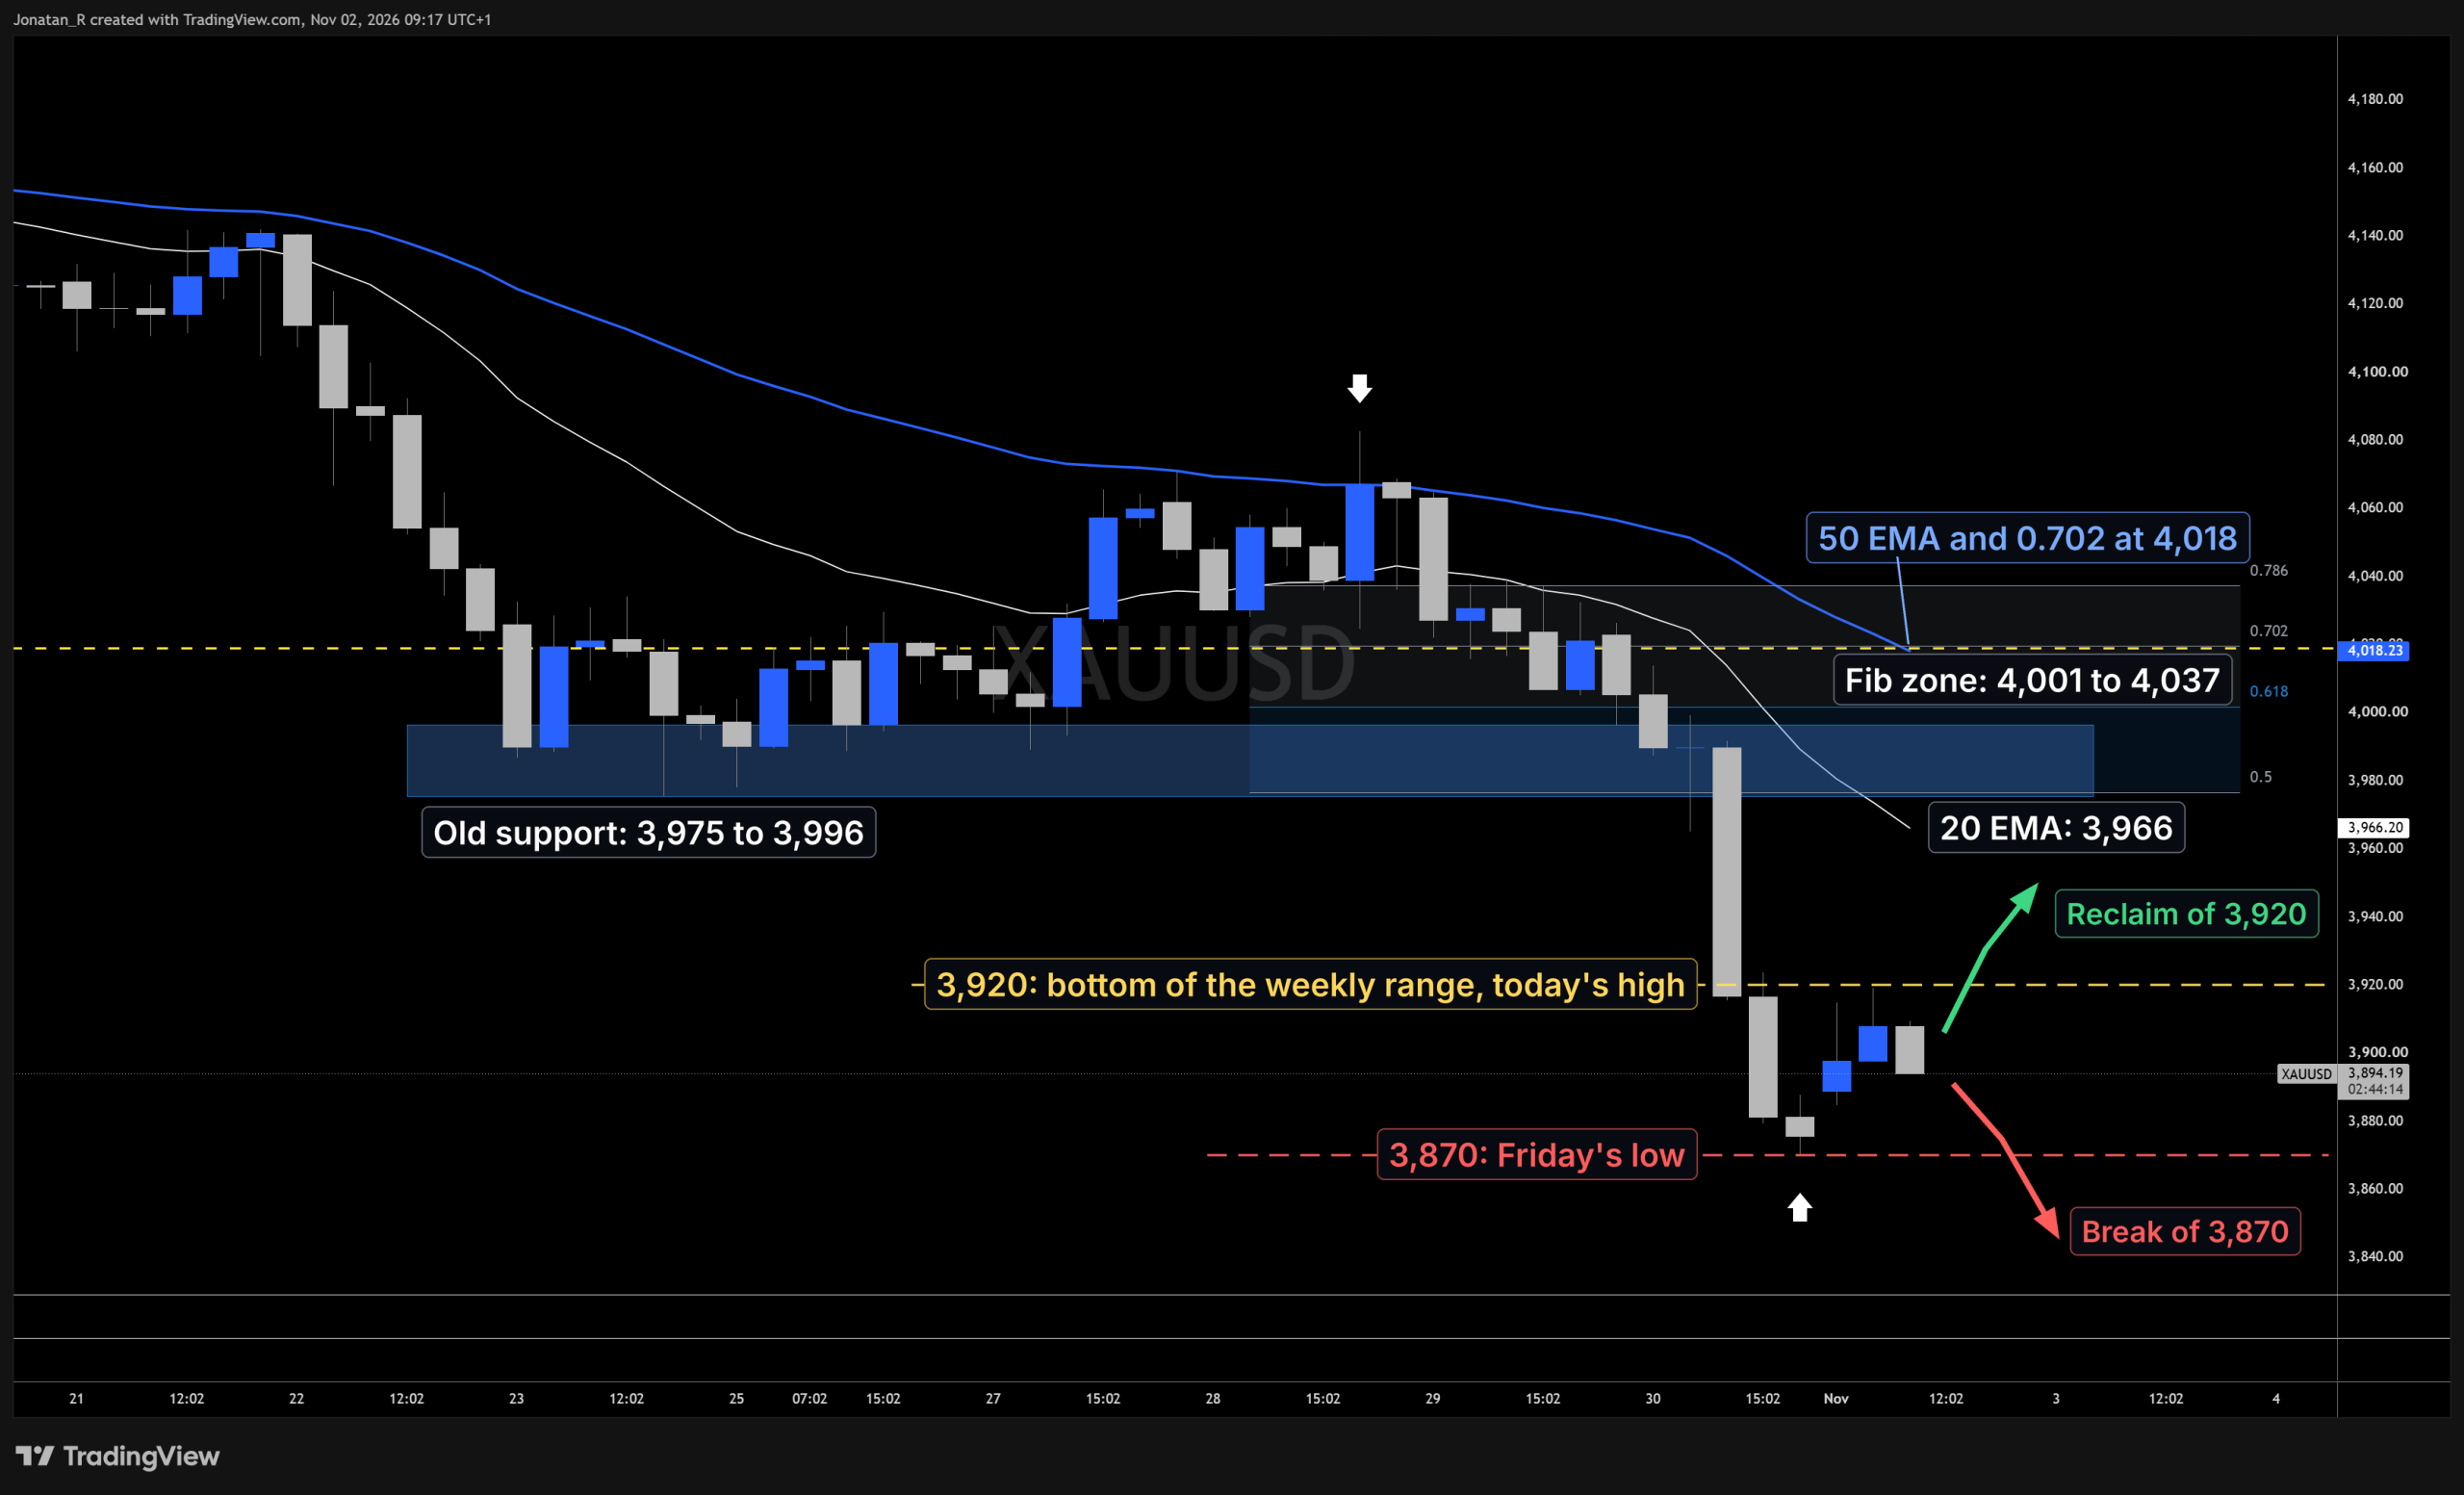
Gold’s bounce has stalled under the bottom of the weekly range. A reclaim of 3,920 could point to the 20 EMA and old support, while a break of 3,870 could bring more downside.
Trading involves risk.
Author



 Risk Disclaimer
The content provided here is for informational purposes only. It is not intended as personal investment advice and does not constitute a solicitation or invitation to engage in any financial transactions, investments, or related activities. Past performance is not a reliable indicator of future results.
The financial products offered by the Company are complex and come with a high risk of losing money rapidly due to leverage. These products may not be suitable for all investors. Before engaging, you should consider whether you understand how these leveraged products work and whether you can afford the high risk of losing your money.
The Company does not accept clients from the Restricted Jurisdictions as indicated in our website/ T&C. Some services or products may not be available in your jurisdiction.
The applicable legal entity and its respective products and services depend on the client’s country of residence and the entity with which the client has established a contractual relationship during registration.