5 min read
 Ethereum (ETH) has just posted its strongest week of the year, a gain of close to 30%, while spot Ethereum ETFs recorded their largest weekly inflow of 2026 and extended the run to a sixth consecutive positive session on Monday. The rally has now paused, and it does so with a heavy macro week directly ahead: Nvidia’s earnings and core PCE both land on Wednesday, a GDP revision follows on Thursday, and Fed chair Kevin Warsh delivers his first Jackson Hole keynote on Friday.
A sideways range above broken resistance
Since our previous coverage of Ethereum, price has cleared the ceiling that capped it through the summer and has settled into a sideways trading range above it, holding above the 2,400 area that was resistance and has now turned support.
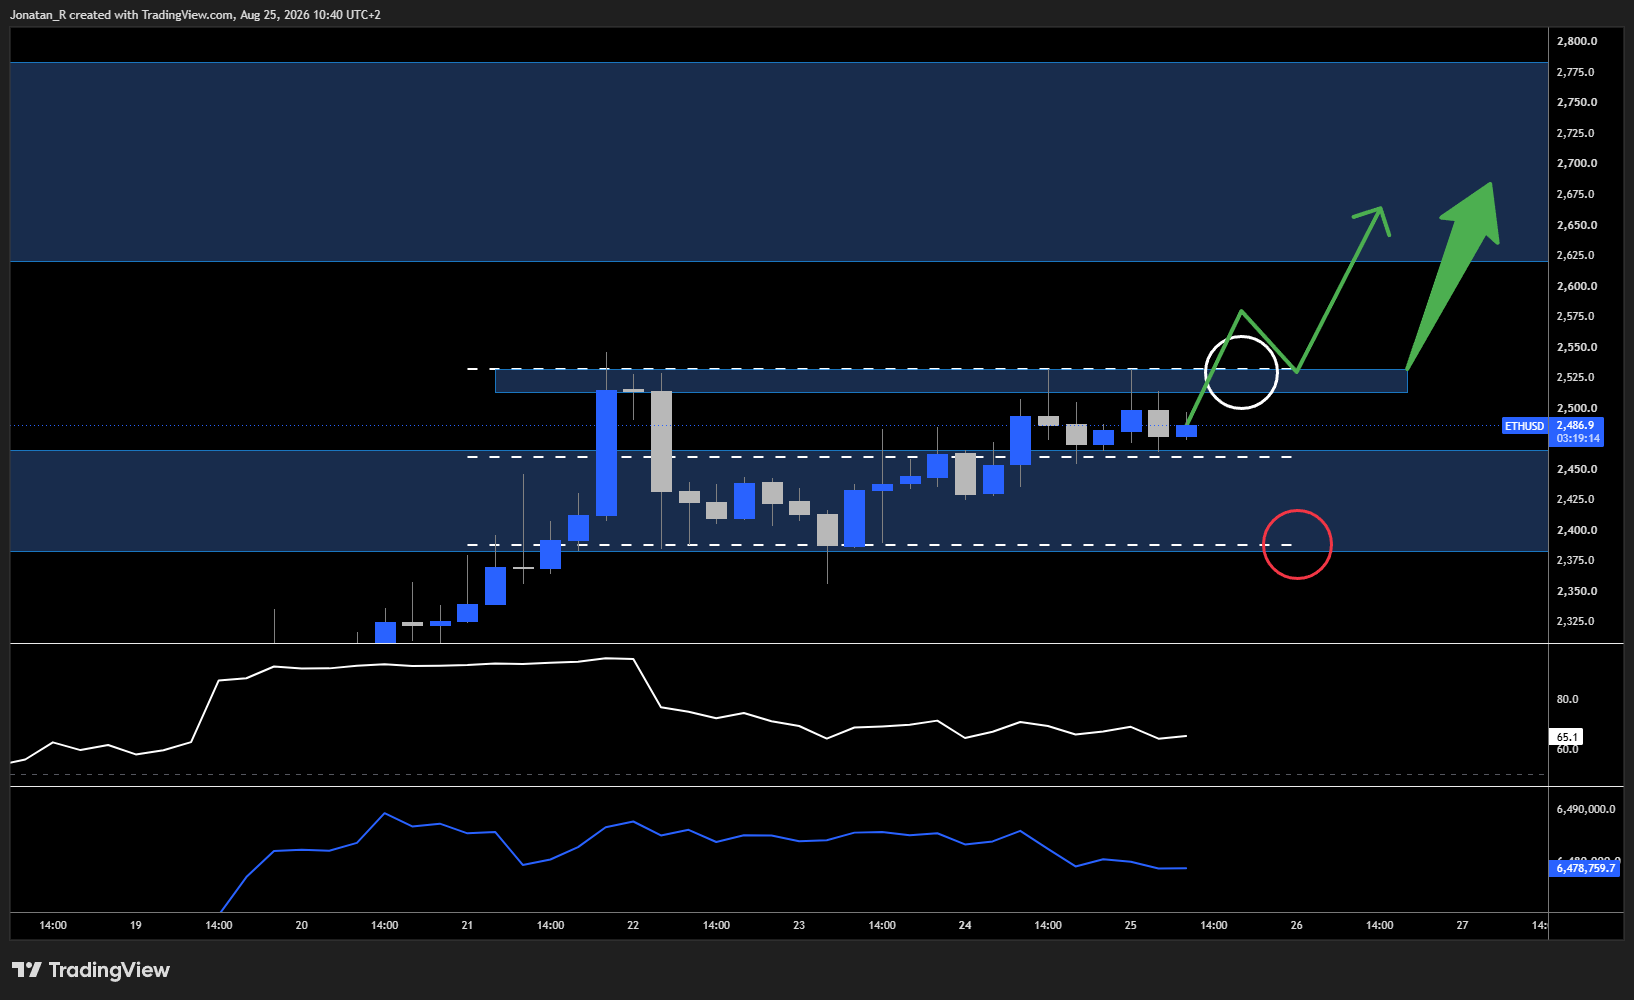
Ethereum on the 4-hour chart, with the sideways range holding above broken resistance and the higher timeframe resistance zone above.
The RSI on the 4-hour chart is showing weakening momentum, but that is what we’d expect after a move as extreme as the one we’ve just had. The accumulation and distribution indicator in the blue line below is also decreasing. Neither of these necessarily means the indicators are failing to confirm price. It may simply be that price is resetting after an impulsive move, and the indicators are resetting with it.
The fact that we’re sitting above this previous resistance zone, and at the upper end of the range rather than beneath its equilibrium, tells us there’s still potential strength here. A break above the 2,530 level, marked with the white circle, could take us higher into that higher timeframe resistance zone starting just above 2,600. Given the momentum price has shown over the last few days, a break above the range could give us another surge.
Breakout traders would probably buy a break above 2,540. Break and retest traders would most likely wait for the break first, then look for a retest of 2,530 as support before entering.
The same logic applies to the downside. A break below 2,400 with continuation could take us all the way back to where this move originated.
A smaller range inside the range
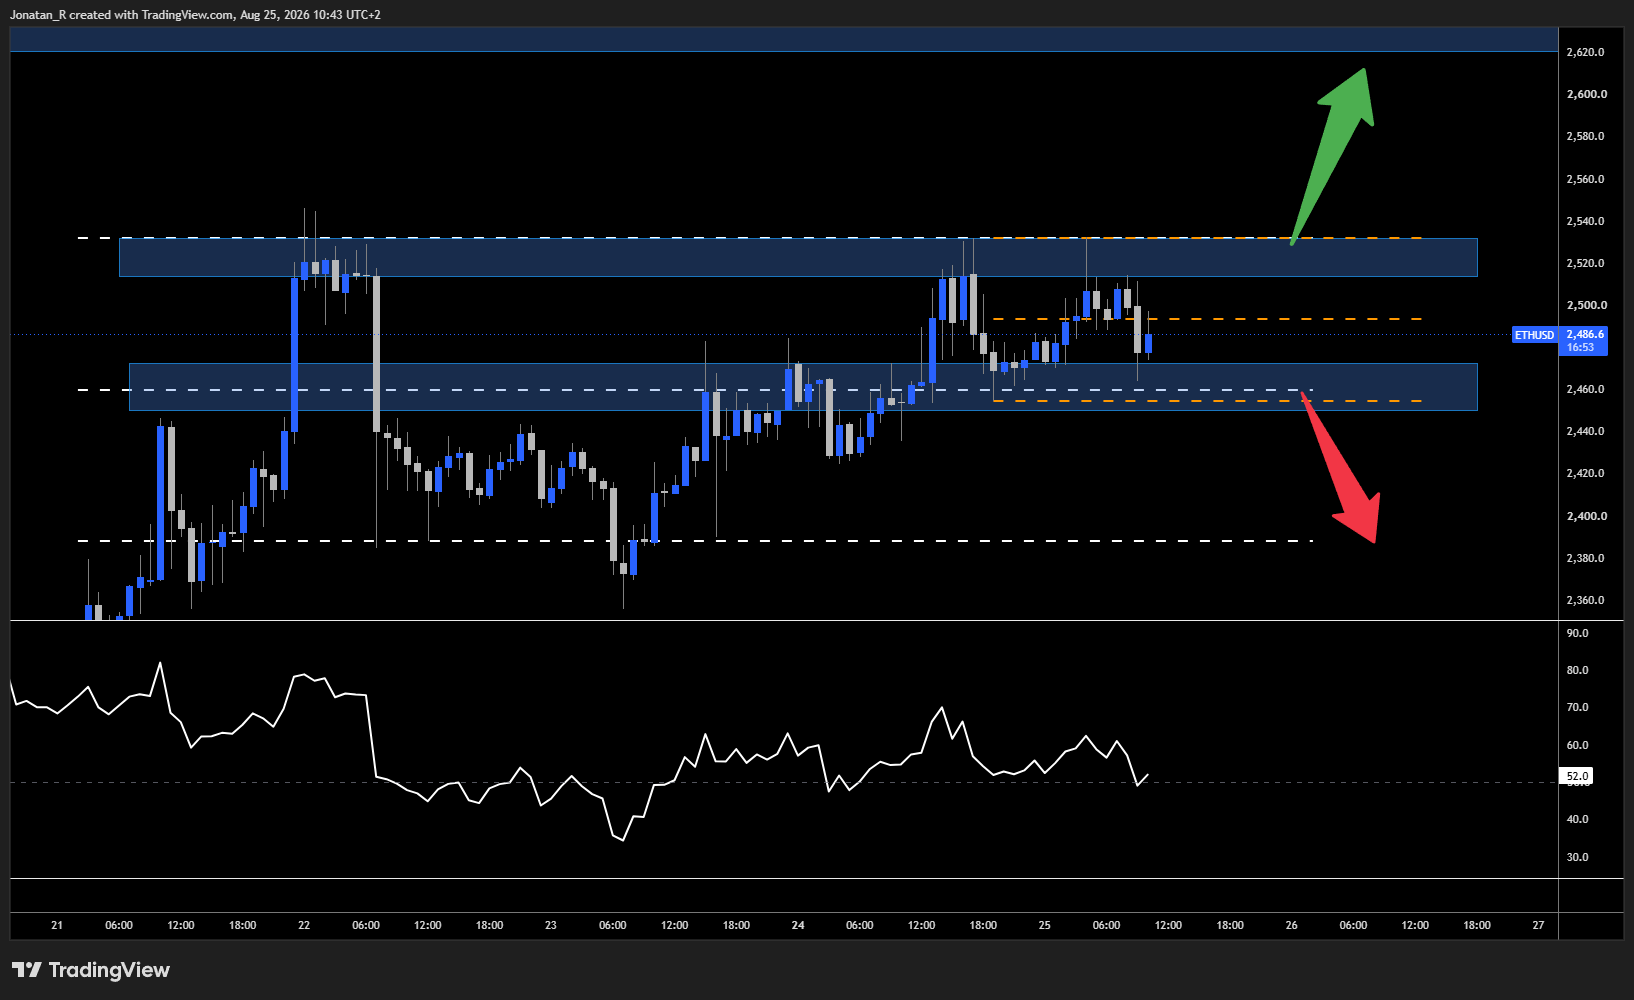
The same structure on the 1-hour chart, with the smaller orange range sitting between the equilibrium area and the range highs.
Zooming in to the 1-hour chart, the range becomes cleaner. Price is now testing the range equilibrium area at around 2,460, and is potentially forming an even smaller range on the lower timeframes between that equilibrium and the range highs. That smaller range is marked in orange.
Intraday traders and scalpers will most likely be watching the orange range for opportunities. Traders looking for bigger moves could instead be watching for a break below the equilibrium down towards the range lows, marked with the red arrow, or for the breakout up into the higher timeframe region marked with the green arrow.
For now this is a range-bound market, but a lot can happen from here. Once these levels break, there’s a fairly high likelihood of seeing another strong, high-momentum and high-volatility move.
Trading involves risk.
Author



 Risk Disclaimer
The content provided here is for informational purposes only. It is not intended as personal investment advice and does not constitute a solicitation or invitation to engage in any financial transactions, investments, or related activities. Past performance is not a reliable indicator of future results.
The financial products offered by the Company are complex and come with a high risk of losing money rapidly due to leverage. These products may not be suitable for all investors. Before engaging, you should consider whether you understand how these leveraged products work and whether you can afford the high risk of losing your money.
The Company does not accept clients from the Restricted Jurisdictions as indicated in our website/ T&C. Some services or products may not be available in your jurisdiction.
The applicable legal entity and its respective products and services depend on the client’s country of residence and the entity with which the client has established a contractual relationship during registration.