
 5 min read
 Bitcoin has just closed its strongest week in years, gaining more than 20% as a short squeeze gave way to the heaviest week of ETF inflows we’ve seen in 2026. What began as forced buying now has to prove it can hold through a week carrying Nvidia’s earnings, the Jackson Hole symposium and the Fed chair’s first keynote alongside the July core inflation print.
The 4-hour chart
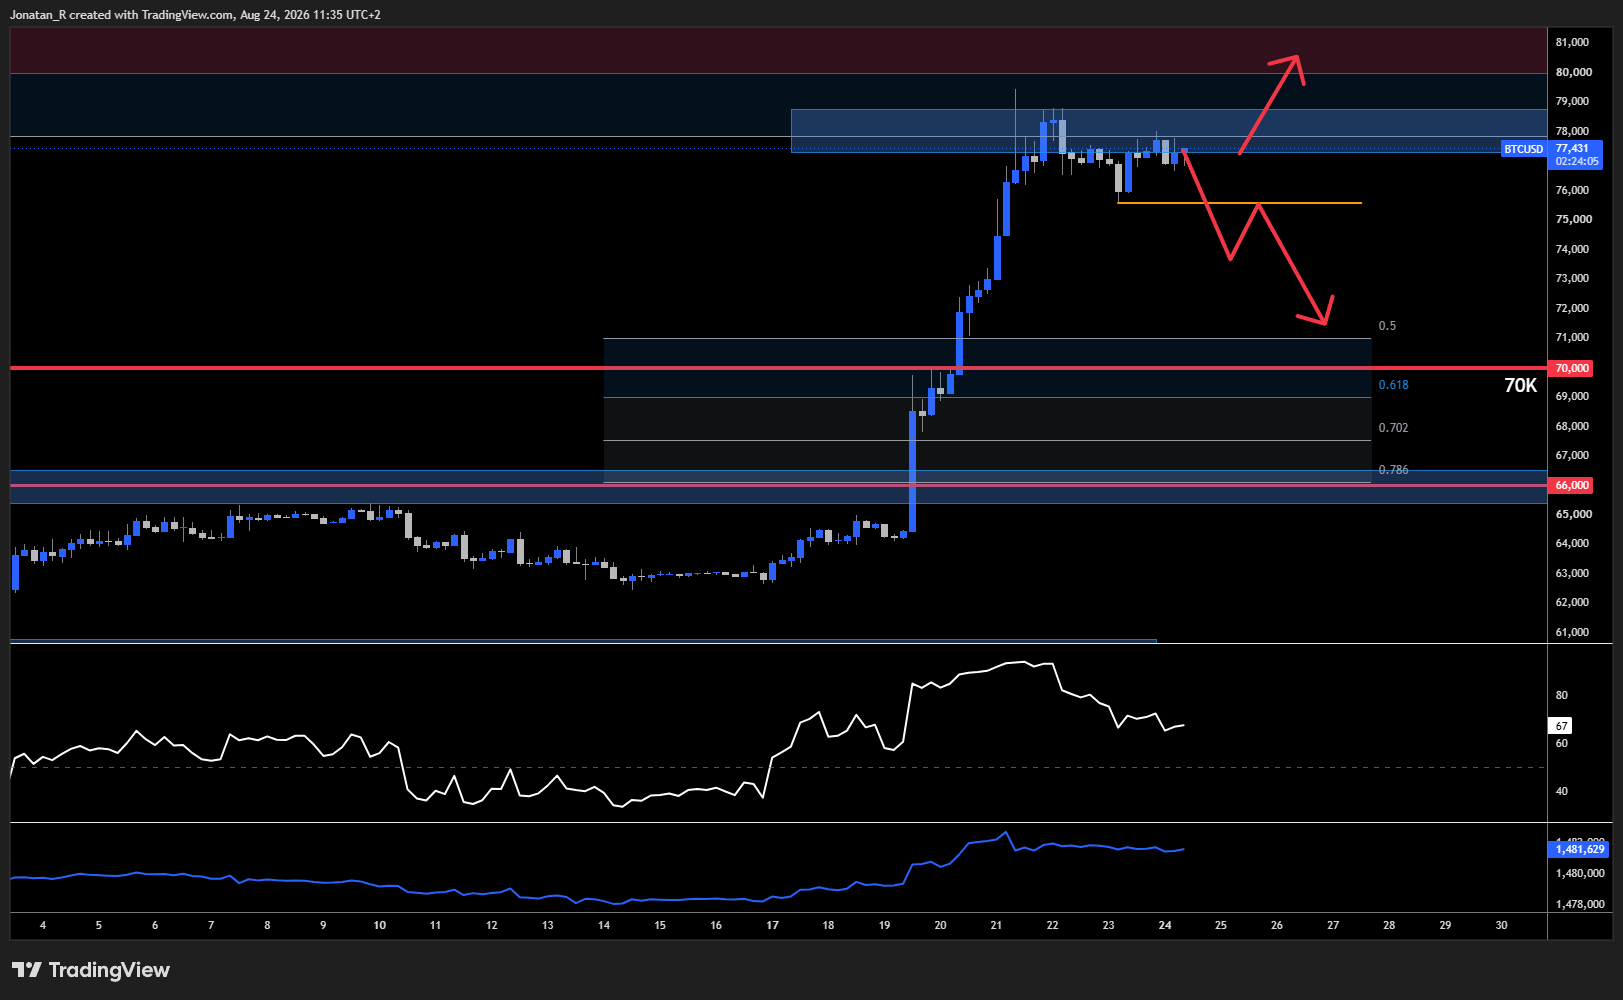
Bitcoin consolidating below the 78,000 to 79,000 resistance zone after last week’s rally, with the Fibonacci retracement of the move mapped out below.
We asked whether the bull market was back in our previous coverage of Bitcoin, when price had just torn through 70,000. The difference now is that the weekly candle has closed, and the 4-hour is showing consolidation rather than continuation. After the rally that began on Wednesday, Bitcoin is holding in the 77,000 to 78,000 area with resistance directly overhead at 78,000 to 79,000. The RSI has been resetting from deeply overbought territory as momentum has come out of the move, which is what you would expect after a week like the one just gone.
The composition of the move is what makes this more interesting than a standard squeeze. The initial leg higher was driven by short covering, with billions of dollars of bearish positions forced closed as price accelerated. In the back half of the week, spot ETF flows joined in, delivering their largest weekly total of the year and reclaiming the 200-day moving average in the process. Forced buying burns itself out once the shorts are gone. New money does not, which is why the flow data through this week matters more than the price does.
Below price, the Fibonacci retracement of the advance gives a clear map. The area between the 0.5 and the 0.618 brackets the 70,000 level, which sits right in between the two. A failure from here and a break below the 75,000 area could potentially open that move down towards 70,000. A breakout above 78,000 to 79,000, on the other hand, and we could potentially see a proper breakout to the upside and a continuation of this rally.
The 15-minute chart
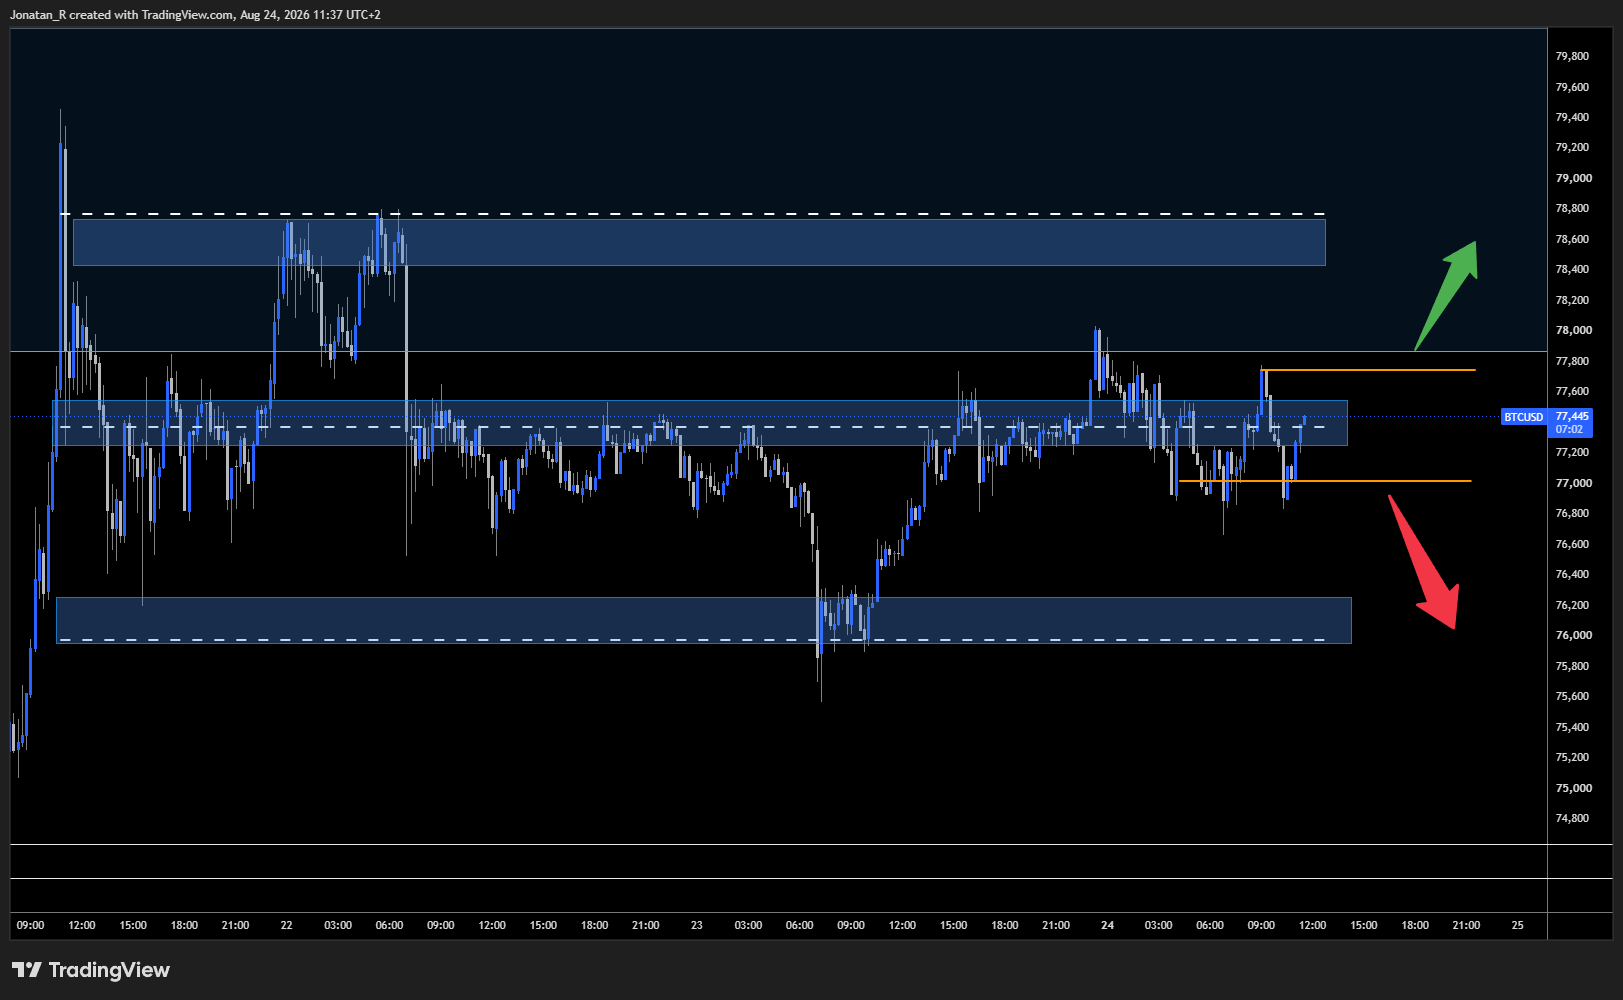
The intraday range on Bitcoin, with the range highs above, the equilibrium area in the middle and a tighter low timeframe range marked by the two orange lines.
On the 15-minute we have a potential range forming, with the range highs sitting above at around 78,500 and the range lows down at around 76,000. We’re currently trading within the range equilibrium area, roughly between 77,000 and 77,800.
For intraday traders, today is about looking for a move out of that equilibrium area. The two orange lines mark out a potential low timeframe range sitting inside the larger one, and a break above or below those levels could potentially take price to the range highs or back down towards the range lows. With the week’s scheduled catalysts landing from Wednesday onwards, the early part of the week is as much about positioning as it is about direction.
Trade Now
Trading involves risk.
Author



 Risk Disclaimer
The content provided here is for informational purposes only. It is not intended as personal investment advice and does not constitute a solicitation or invitation to engage in any financial transactions, investments, or related activities. Past performance is not a reliable indicator of future results.
The financial products offered by the Company are complex and come with a high risk of losing money rapidly due to leverage. These products may not be suitable for all investors. Before engaging, you should consider whether you understand how these leveraged products work and whether you can afford the high risk of losing your money.
The Company does not accept clients from the Restricted Jurisdictions as indicated in our website/ T&C. Some services or products may not be available in your jurisdiction.
The applicable legal entity and its respective products and services depend on the client’s country of residence and the entity with which the client has established a contractual relationship during registration.








