8 min read
S&P 500 Breaks Below Its Head and Shoulders Neckline
The S&P 500 fell 0.6% last week to 7,580.07, a third straight weekly loss. Friday’s 1.8% drop was the worst session since June: Intel sank 28.6% on weak guidance and Amazon’s free cash flow turned negative, reviving doubts about AI spending. The Fed held at 3.75% to 4.00% with two dissents for a hike. This week brings the midterms, Apple’s results and the jobs report.
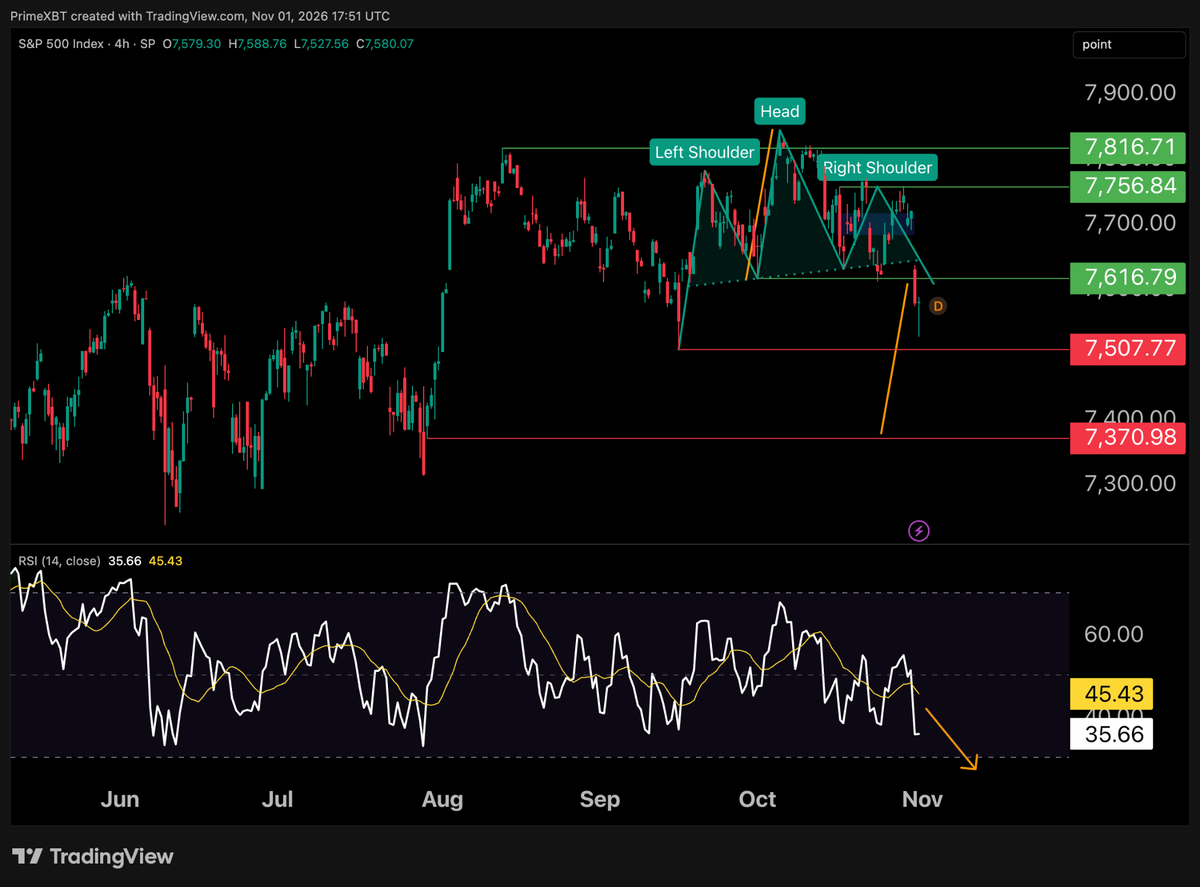
On the chart, the S&P 500 has completed the head and shoulders flagged last week: Friday’s drop closed below the 7,616.79 neckline. The red levels at 7,507.77 and 7,370.98 are next, and the second sits close to the pattern’s measured target shown by the drawn arrow. The RSI at 35.7 is weak but not yet oversold, which leaves room for further downside. A return above 7,616.79 would put the breakdown in doubt, and Friday’s jobs report is the main event that could shift the balance.
WTI Crude Holds Above $100 as OPEC+ Stands Pat
WTI crude rose about 0.8% on the week, with December futures settling at $104.12, and gained roughly 15% in October. Tanker attacks near Hormuz kept the risk premium high, with UKMTO counting 43 Gulf security incidents in October, the most since the war began. On Sunday OPEC+ kept December output targets unchanged, leaving the 2027 decision for November 29.
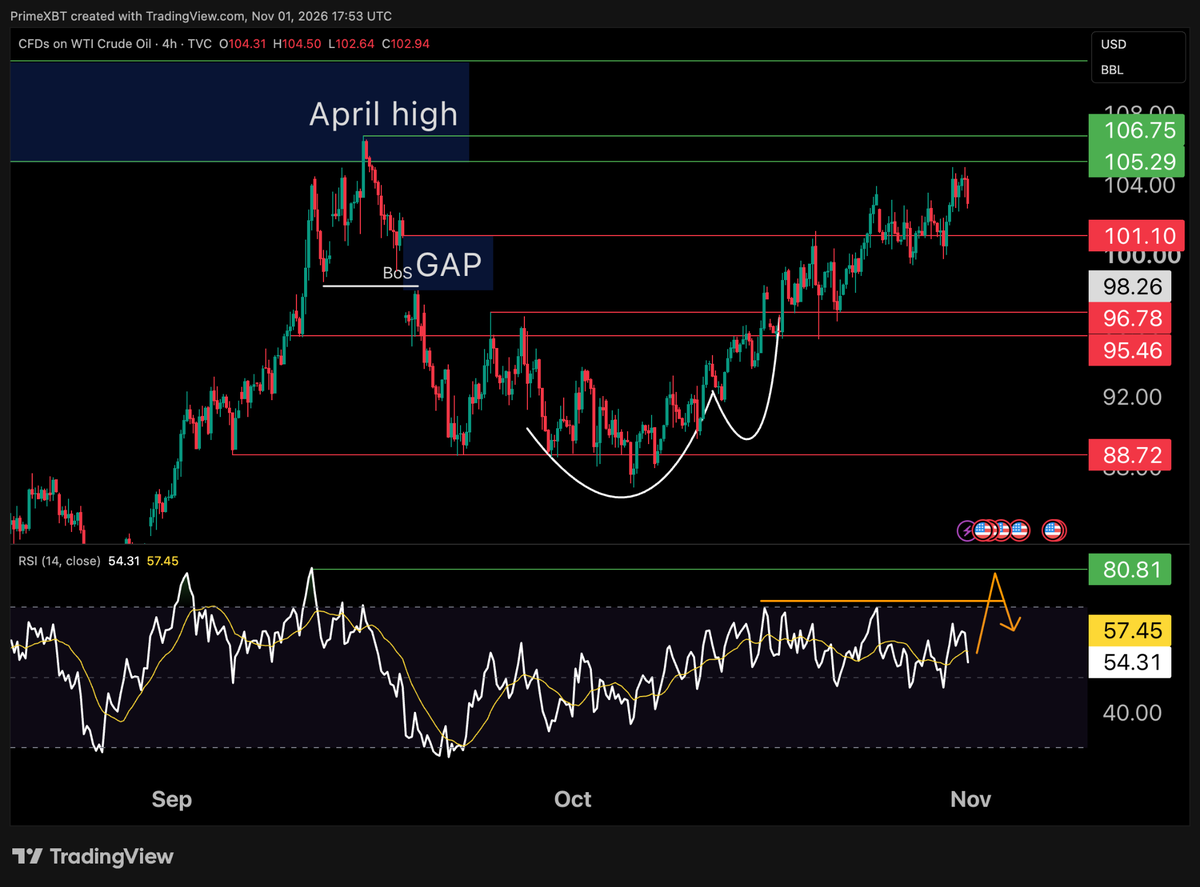
On the chart, WTI crude consolidates just below the 105.29 to 106.75 April high zone, the top of this year’s range. The CFD ended near $102.9, below the futures settlement. The drawn scenario is a spike into that zone, with the RSI testing 80.81, followed by a sharp reversal. If a break above 105.29 fails and price falls back below it, that would mark a false breakout and put 101.10, the top of the filled gap, back in focus. A sustained move above 106.75 would cancel that scenario.
RBA Cash Rate (Tuesday)
The RBA announces on Tuesday at 03:30 GMT, with the press conference at 04:30 GMT. The cash rate is 4.60% after a September hike, the fourth this year. Q3 trimmed mean inflation rose to 3.7% y/y, above the 3.6% consensus. All four major banks expect a 25 bp hike to 4.85%, priced at roughly 80% to 90%. With the move priced, guidance matters: a signal of further hikes would support the Aussie, while a pause message could weigh on it.
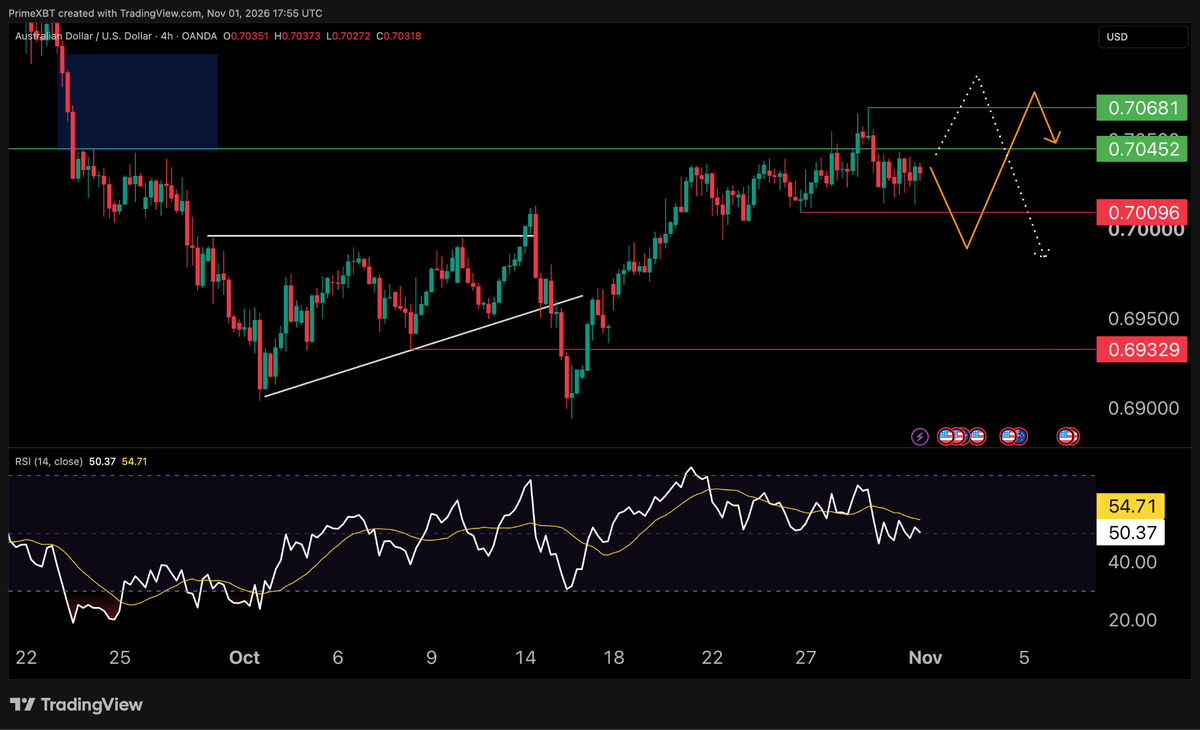
On the chart, AUD/USD spent last week in a narrow range between 0.70096 and 0.70452, with one spike to 0.70681. Two paths are drawn. If the RBA sounds hawkish, a break above 0.70452 and 0.70681 would open the late September supply zone near 0.7100. If the guidance disappoints, a drop below 0.70096 would point toward 0.6985 and then 0.69329. The RSI at 50.4 is neutral, leaving the direction to the decision.
US Midterm Elections (Tuesday)
Americans vote on Tuesday for all 435 House seats and 35 Senate seats, with first results after about 23:00 GMT. Decision Desk HQ gives Democrats an 83% chance of taking the House and 63% for the Senate. A Democratic House looks largely priced, so the Senate result and any upset would drive the reaction through fiscal and energy policy expectations. Gold enters the vote weak after a drop of more than 3% on Friday, driven by margin-call selling.
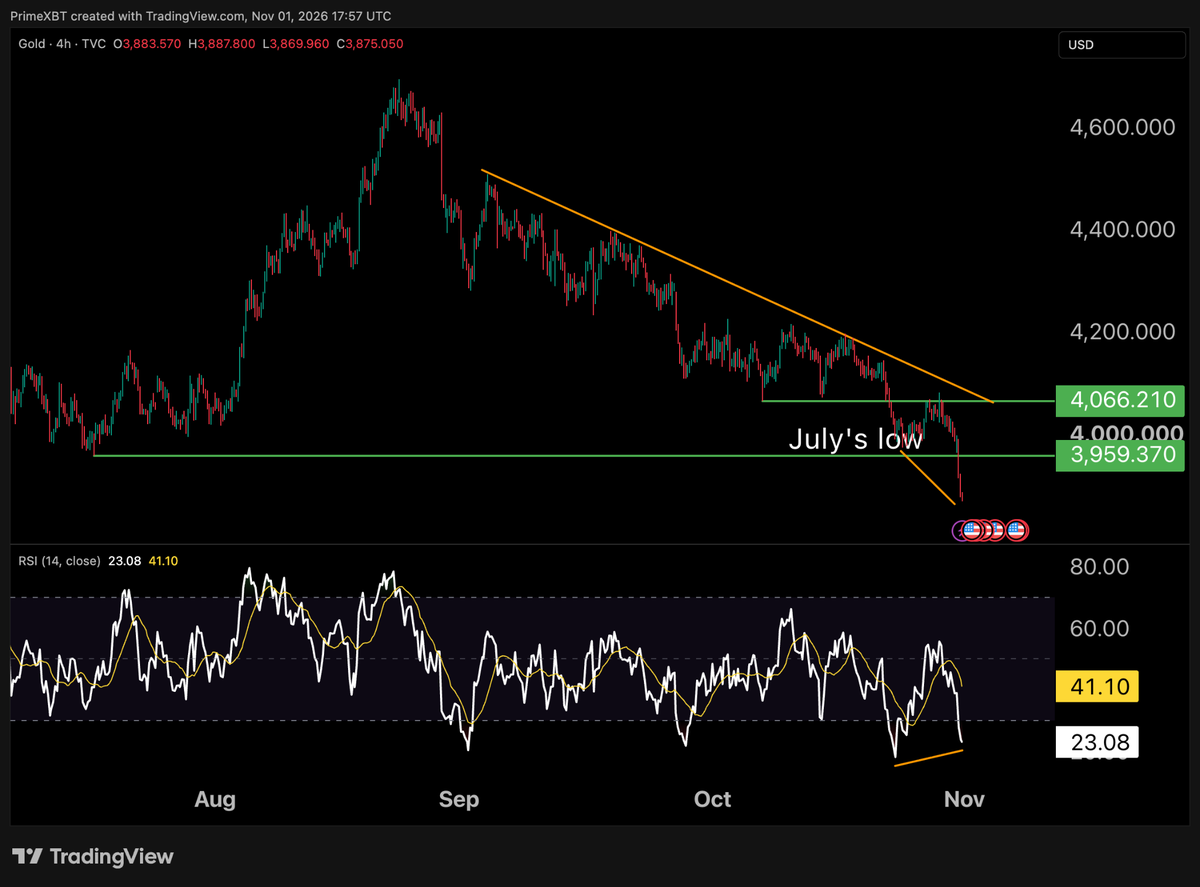
On the chart, gold broke below July’s low at 3,959.37 and trades near 3,875, its lowest level in more than a year, under a descending trendline from the September highs. The RSI at 23.1 is deep in oversold territory and shows a bullish divergence against the late October low. That makes a technical rebound toward 3,959.37 possible, but the trend shows no sign of turning: a rebound could come late and stay shallow. Only a move above 4,066.21 and the trendline would change the structure.
BoE Official Bank Rate (Thursday)
The Bank of England decides on Thursday at 12:00 GMT with a new Monetary Policy Report, and Governor Bailey speaks at 12:30 GMT. Bank Rate is 3.75% after a 6 to 3 hold in September. September CPI then jumped to 3.5% from 3.1%. In a Reuters poll, 54 of 63 economists expect a hike to 4.00%, and prediction markets price it near 97%. With the hike priced, the vote split and the new forecasts set the tone for sterling.
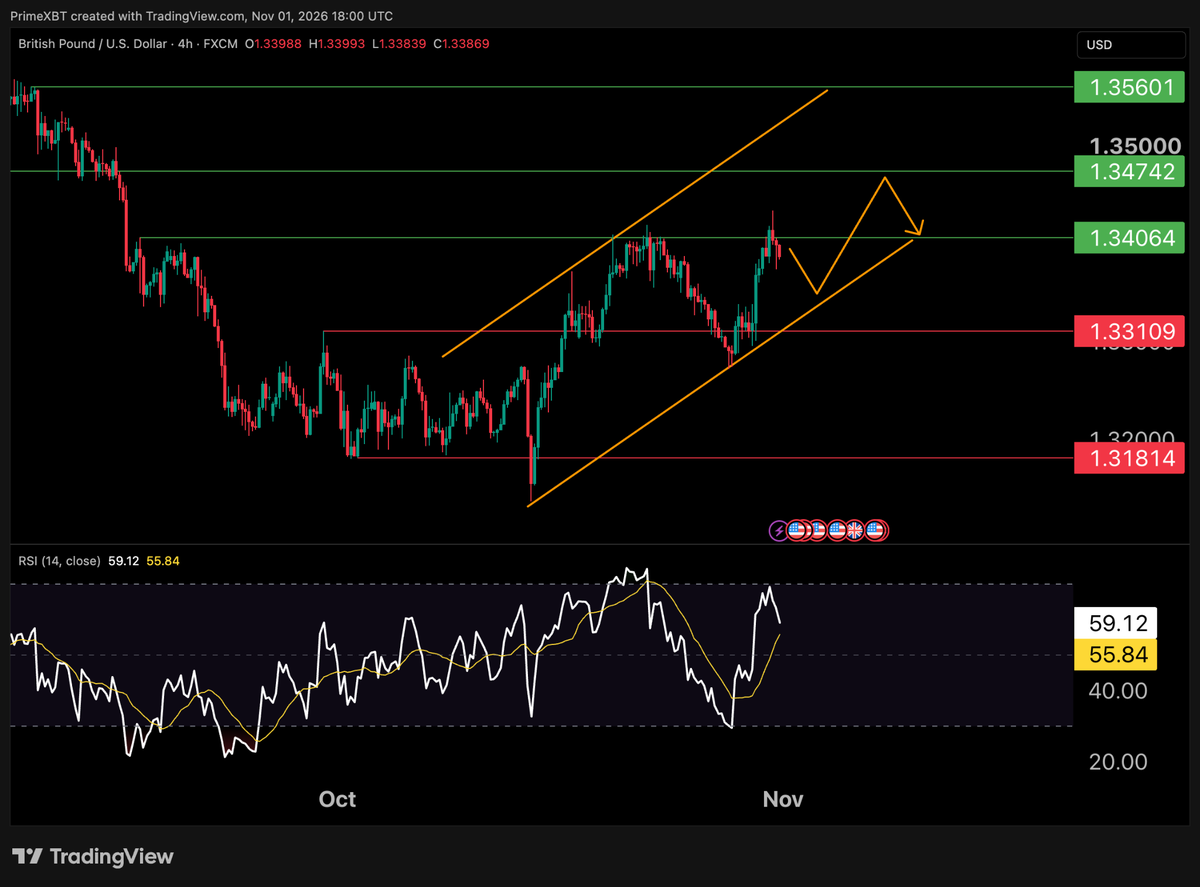
On the chart, GBP/USD moves inside a rising channel from the mid-October low, bouncing off its lower boundary. Resistance at 1.34064 has capped two attempts, the latest with a wick above it. The drawn scenario is a dip toward 1.3350, near the channel support, followed by a second approach to 1.34064. If that test produces a break, the path would open toward the next resistance at 1.34742. A move below the channel and 1.33109 would invalidate the setup.
Canada Employment Change (Friday)
Statistics Canada publishes October jobs on Friday at 13:30 GMT. September brought a 68,300 drop, the largest this year, with unemployment at 6.5%, and the loonie slid to an 18-month low. The BoC still hiked to 2.50% last week. Forecasts point to a rebound of about 15,000 jobs, with unemployment at 6.4% to 6.5%. A second weak print would challenge further hikes and weigh on the loonie; a solid rebound would support it.
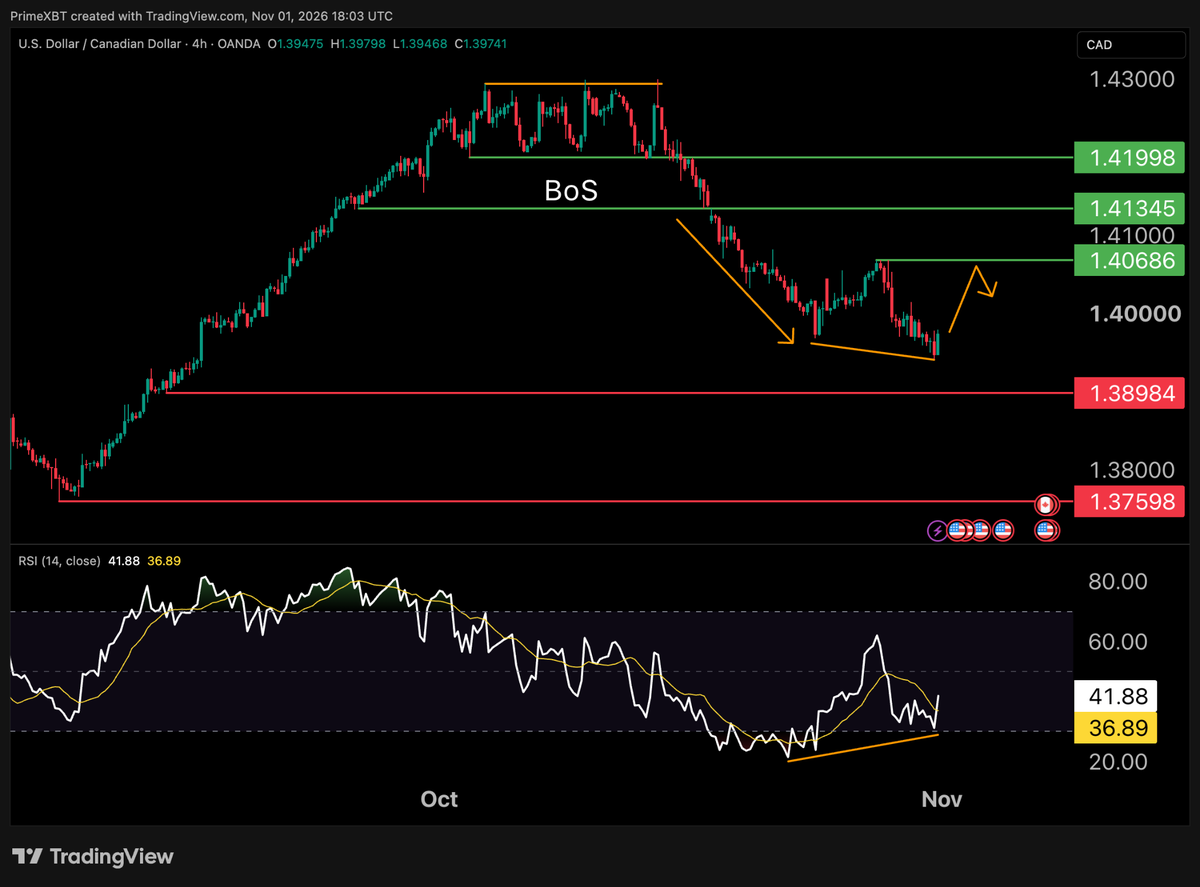
On the chart, USD/CAD extended the downtrend that began with the break of structure below 1.41998 and 1.41345, but its latest low near 1.3944 came with a higher RSI low, a bullish divergence. Friday’s last candle closed sharply higher at 1.39741. The drawn target is 1.40686, the late October high. A drop below the 1.3944 low would void the divergence and put 1.38984 in focus.
US Non-Farm Payrolls (Friday)
The October jobs report is due on Friday at 13:30 GMT. In September payrolls rose just 29,000 against about 90,000 expected, unemployment climbed to 4.2% and hourly earnings gained 0.1% m/m. CME FedWatch still prices a December hike at about 83%. October forecasts range from 42,000 (RBC) to 63,000, with earnings seen at 0.3% m/m. Strong hiring with firmer wages would cement the hike and support the dollar; another weak print would test that pricing.
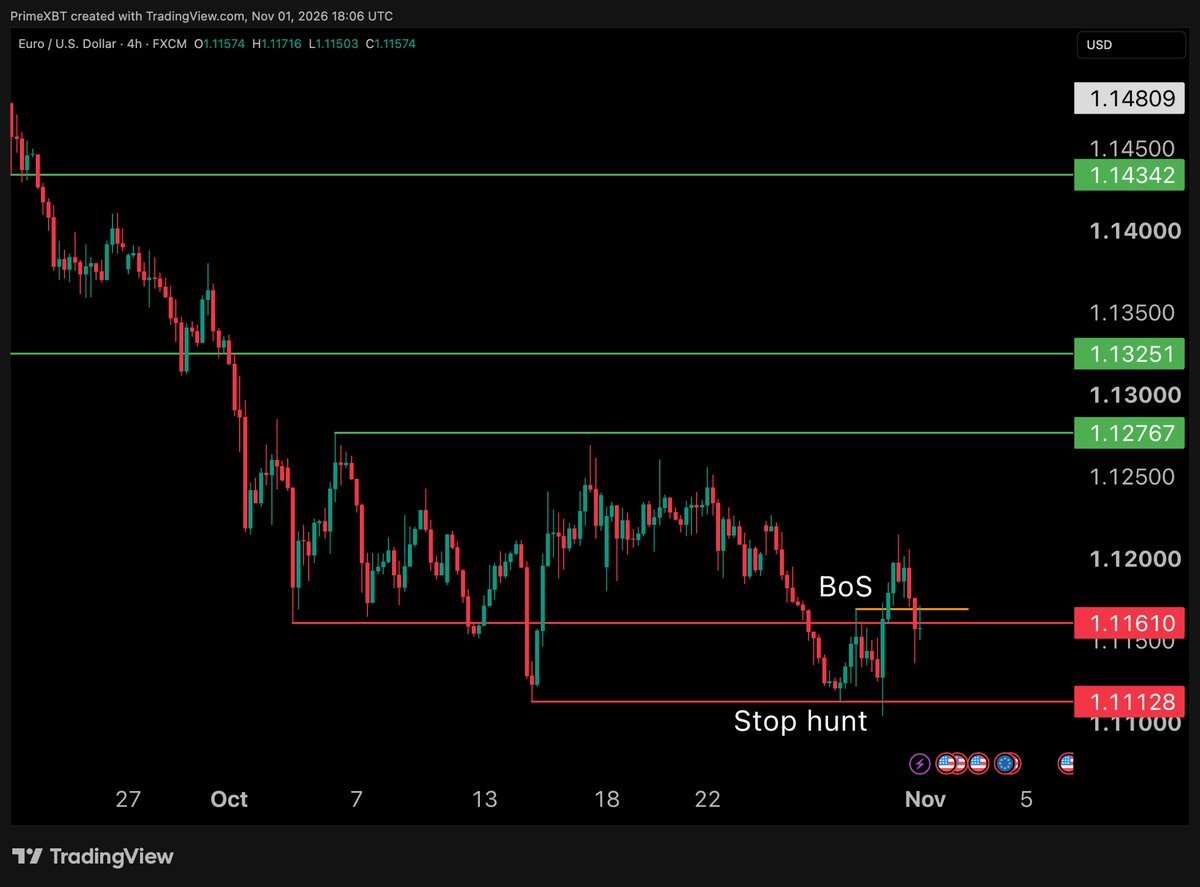
On the chart, EUR/USD keeps trading sideways with a slight downward drift. A stop hunt below 1.11128 late last week reversed quickly, and the rebound broke structure near 1.1169 before easing back to 1.1157, just under 1.11610. If buyers defend this area, the drawn path points to 1.12767, the top of the October range, where a move could accelerate if stops above it are triggered. A close below 1.11128 would negate the setup.
Bottom line
Two central banks are expected to hike, the US votes, and payrolls land together with Canada’s jobs data, while stocks break a head and shoulders and oil presses its April high. With the RBA and BoE moves largely priced, guidance and surprises matter more than the decisions. Friday at 13:30 GMT is the most volatile window of the week, so position size and stops deserve extra care.
Trading involves risk.
Author



 Risk Disclaimer
The content provided here is for informational purposes only. It is not intended as personal investment advice and does not constitute a solicitation or invitation to engage in any financial transactions, investments, or related activities. Past performance is not a reliable indicator of future results.
The financial products offered by the Company are complex and come with a high risk of losing money rapidly due to leverage. These products may not be suitable for all investors. Before engaging, you should consider whether you understand how these leveraged products work and whether you can afford the high risk of losing your money.
The Company does not accept clients from the Restricted Jurisdictions as indicated in our website/ T&C. Some services or products may not be available in your jurisdiction.
The applicable legal entity and its respective products and services depend on the client’s country of residence and the entity with which the client has established a contractual relationship during registration.