7 min read
S&P 500 Slips to Its Head and Shoulders Neckline
The S&P 500 lost 0.5% last week to close at 7,623.68. Concerns about financing heavy AI spending pushed the Nasdaq down 2.6% on Thursday, its sharpest drop since June. The US-Iran conflict stayed the main macro driver: Iran’s Revolutionary Guard warned it could target US bases if American forces keep escorting tankers through Hormuz. Next week a third of the index reports, including Microsoft, Alphabet and Amazon.
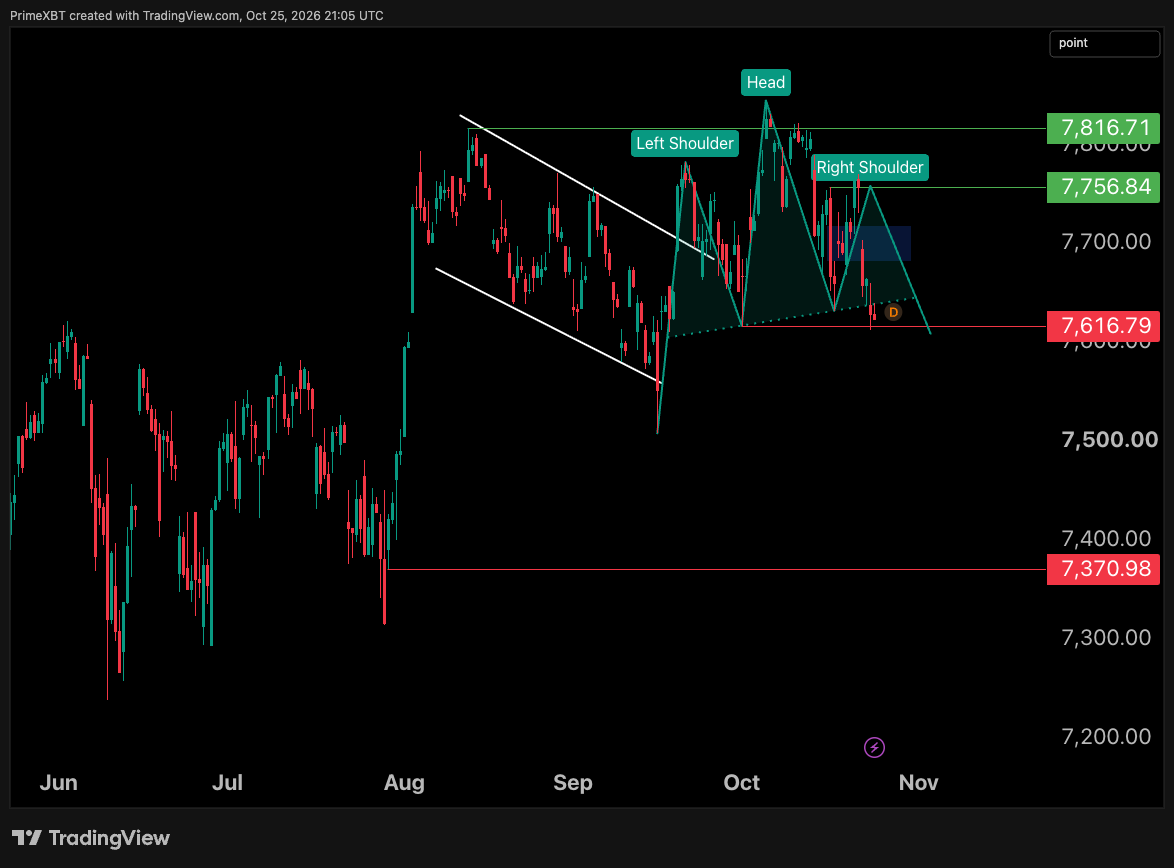
On the chart, the S&P 500 has drawn a head and shoulders, with the head above 7,816.71 and the right shoulder capped at 7,756.84. Price sits on the neckline near 7,616.79. A sustained move below it would confirm the pattern and open the path toward 7,500, then 7,370.98. A recovery above the shaded zone near 7,700 would weaken the setup, and a break above 7,756.84 would invalidate it.
WTI Crude Climbs Back Above $100
WTI crude rose 4.3% on the week, with December futures settling at $103.27, while Brent hit $116.72, its highest since late April. Houthi strikes on Saudi Arabia forced Aramco to evacuate its Dhahran headquarters, and attacks on shipping made October the worst month for Hormuz-area incidents since 2017. Offsets came from Washington: Russian diesel cargoes to the US are resuming under a new deal, and Trump has pushed the Defense Production Act to lift output while accusing Iran of driving prices up before the November 3 midterms.
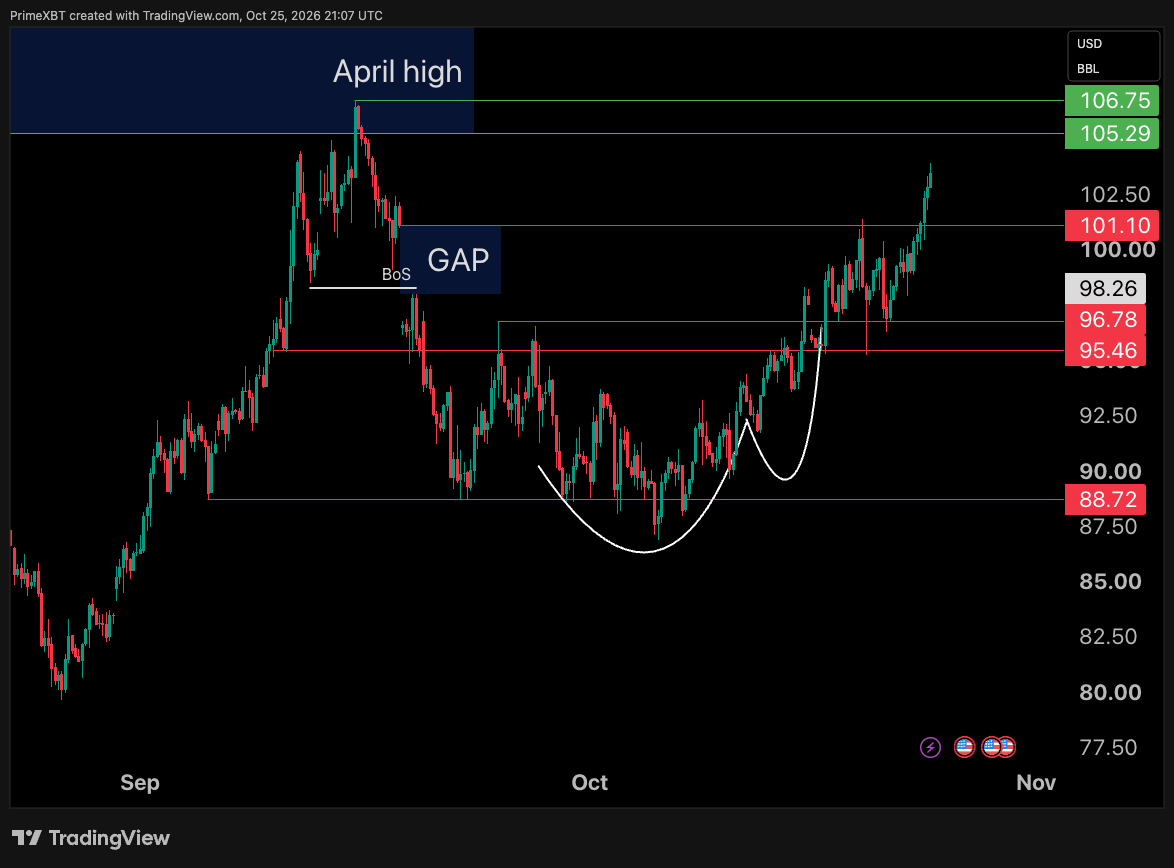
On the chart, WTI crude broke out of a cup and handle above 96.78, filled the September gap up to 101.10 and cleared it. The CFD trades near $103.8, slightly above futures. The next resistance is the 105.29 to 106.75 April high zone, where a first reaction would test the breakout. Holding above 101.10 keeps the structure intact; a drop below it would put 98.26 and 96.78 in play.
New Zealand Cash Rate (Wednesday)
The RBNZ decides on Wednesday at 01:00 GMT. The OCR is 2.75% after a 25 bp hike on September 2. Q3 inflation eased to 3.7% y/y from 4.1%, below the 3.8% consensus but above the 1% to 3% target. Markets still price a hike to 3.00%, with odds estimated between 80% and 98%. With a move largely priced, a hold would be the bigger surprise for the kiwi, while hawkish guidance would support it.
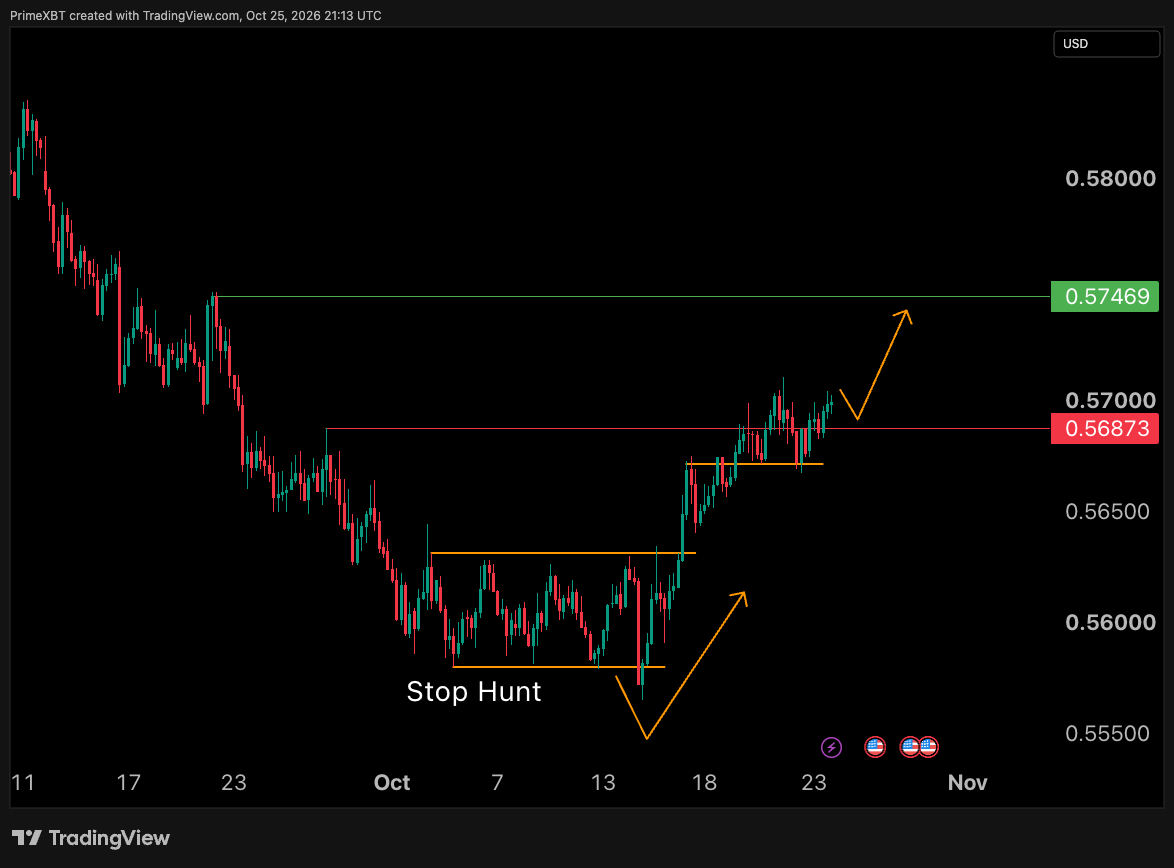
On the chart, NZD/USD ranged between about 0.5580 and 0.5630 in early October, swept liquidity below the lower edge in a stop hunt and reversed higher. The pair has cleared 0.56873 and trades near 0.5700. Holding above 0.56873 keeps the path toward 0.57469 open; a return below the 0.5670 shelf would put the breakout in doubt.
BoC Rate Statement (Wednesday)
The Bank of Canada announces on Wednesday at 13:45 GMT, with a new Monetary Policy Report. The rate has been 2.25% since October 2025. September CPI rose to 3.1%, driven by gasoline up 27.8% y/y; excluding gasoline, inflation was 2.2%. A Reuters poll shows 19 of 34 economists expecting a hike to 2.50%, and futures moved from about 30% to roughly 75% odds. The hold camp points to a weak economy, with 68,000 jobs lost in September. A hike would support the loonie; a hold would unwind much of the repricing.
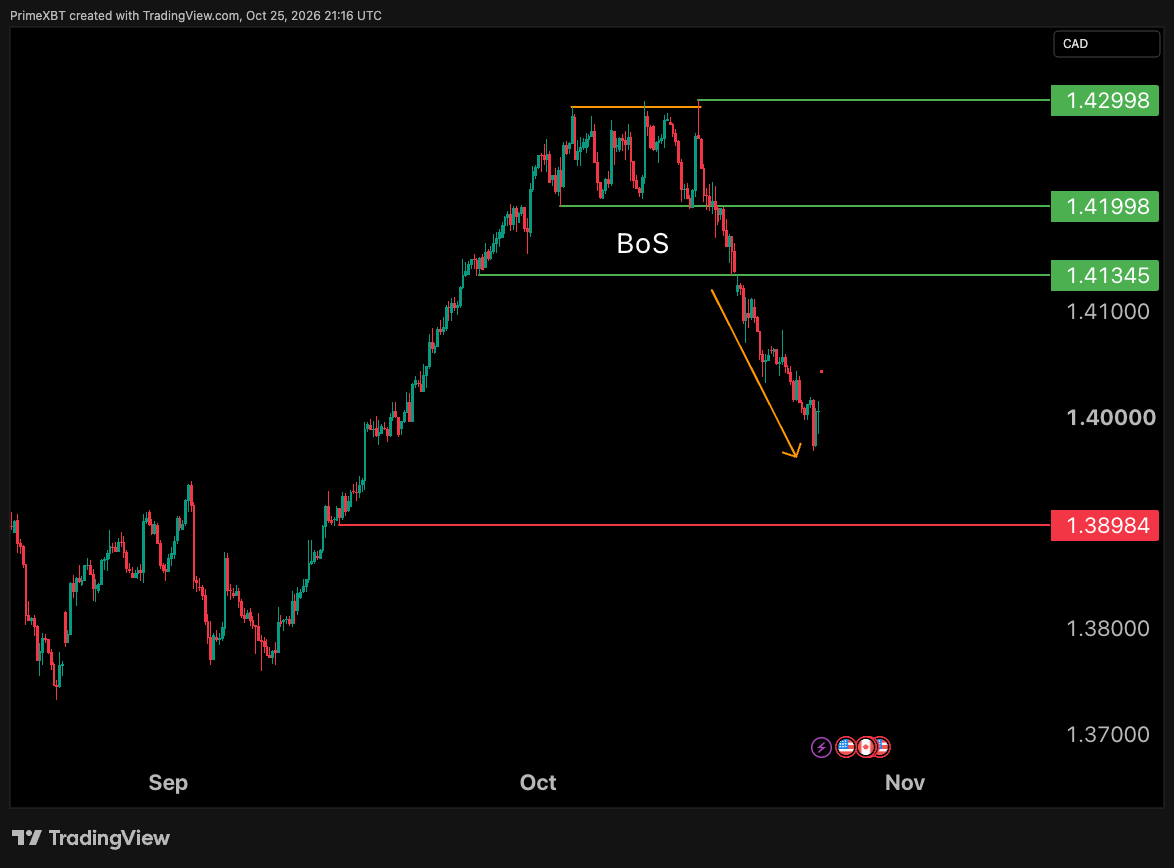
On the chart, USD/CAD followed through on the break of structure below 1.41998 and 1.41345, which ended the range under 1.42998, and trades near 1.3995. The drop came alongside a firm US dollar, higher oil and BoC hike repricing, so it reflects loonie strength rather than dollar weakness. If the downtrend holds, 1.38984 is the next support; a recovery above 1.41345 would neutralize the break.
US Federal Funds Rate (Wednesday)
The Fed decides on Wednesday at 18:00 GMT, followed by Chair Kevin Warsh’s press conference. The target range is 3.75% to 4.00% after a hike on September 16, and September CPI ran at 3.7% y/y. CME FedWatch prices a hold at roughly 85% to 91% and a December hike at 84% to 90%. With a hold priced in, the focus is Warsh’s tone on December. Thursday’s Q3 GDP and core PCE add a second test.
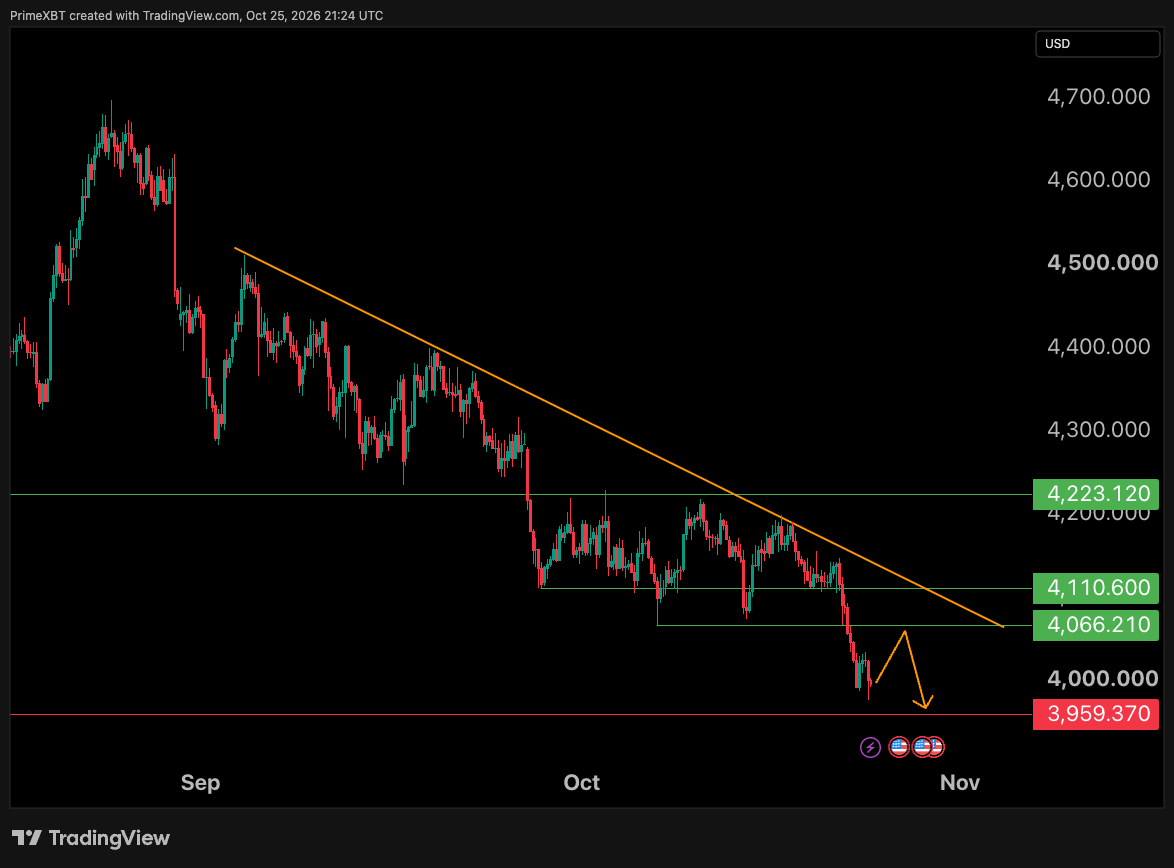
Gold closed below $4,000 for the first time since July, hit by higher oil, a firmer dollar and forced selling during the tech slide. On the chart, price broke the October floor at 4,110.60, then 4,066.21, and trades near 3,990 under a descending trendline. A technical rebound toward 4,066.21 is possible; rejection there would put 3,959.37 in focus, especially if Warsh keeps December firmly on the table. A move above 4,110.60 would weaken the bearish structure.
ECB Main Refinancing Rate (Thursday)
The ECB announces on Thursday at 13:15 GMT, with Lagarde’s press conference at 13:45 GMT. The main refinancing rate is 2.65% and the deposit rate 2.50% after the September 10 hike. Euro area inflation rose to 3.8% in September, with energy up 18.9% y/y and core at 2.5%. Nomura, MUFG and Danske still expect a hold and a December hike, while markets price about 75 bp of further tightening. A firm December signal would support the euro; pushback against that pricing would weigh on it.
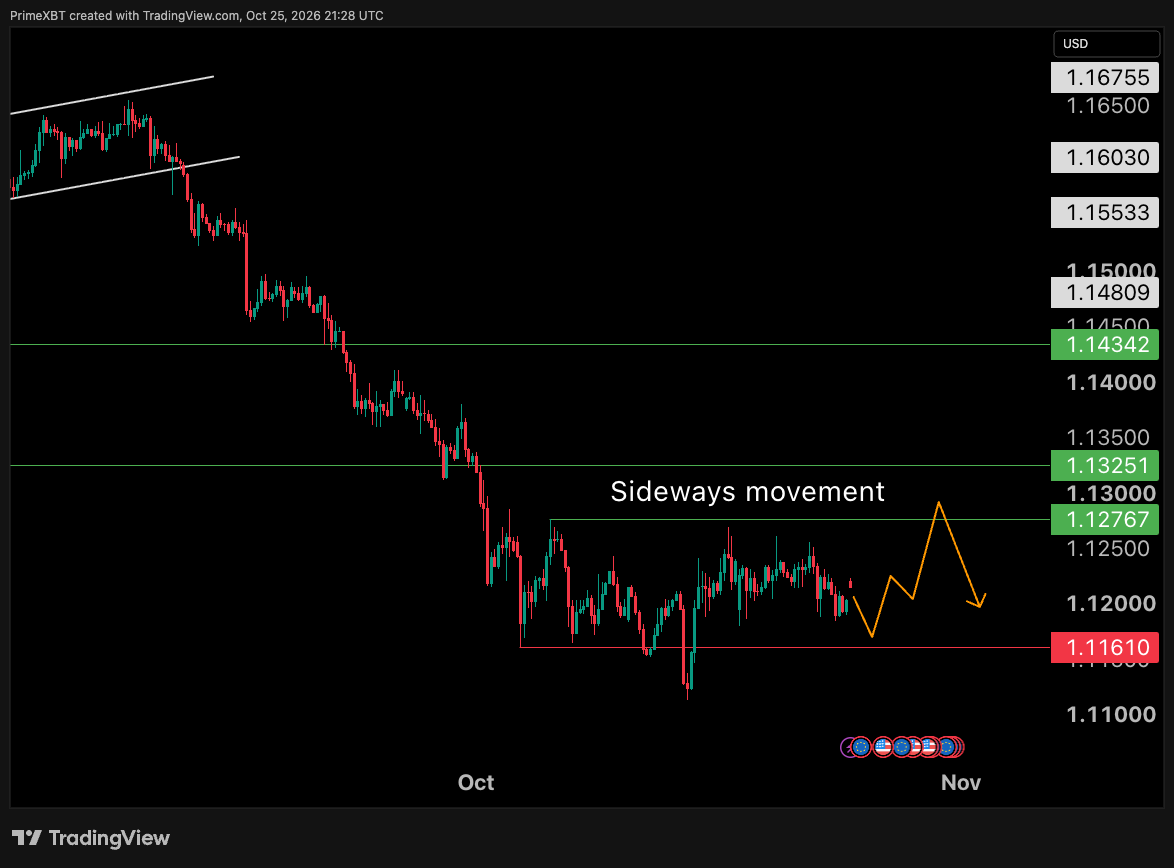
On the chart, EUR/USD has spent October in a range between 1.11610 and 1.12767. A mid-month dip below the floor reversed quickly, and the pair trades near 1.1200. A test of 1.12767 is the drawn scenario, and a breakout above it would open 1.13251. A sustained move below 1.11610 would shift focus back to the September downtrend.
Bottom line
Four central banks decide within about 36 hours, with US GDP, core PCE and megacap earnings in between. Hikes are largely priced in New Zealand and Canada, while the Fed and the ECB are expected to hold and point to December, so guidance and surprises against pricing matter more than the decisions. Moves can be sharp in the currency of each release, so position size and stops deserve extra care.
Trading involves risk.
Author



 Risk Disclaimer
The content provided here is for informational purposes only. It is not intended as personal investment advice and does not constitute a solicitation or invitation to engage in any financial transactions, investments, or related activities. Past performance is not a reliable indicator of future results.
The financial products offered by the Company are complex and come with a high risk of losing money rapidly due to leverage. These products may not be suitable for all investors. Before engaging, you should consider whether you understand how these leveraged products work and whether you can afford the high risk of losing your money.
The Company does not accept clients from the Restricted Jurisdictions as indicated in our website/ T&C. Some services or products may not be available in your jurisdiction.
The applicable legal entity and its respective products and services depend on the client’s country of residence and the entity with which the client has established a contractual relationship during registration.