6 min read
 Key takeaways
- SpaceX joins the Nasdaq 100 before today’s open, and every index fund tracking the benchmark has to buy it. JPMorgan estimates around $4.3 billion of forced passive demand, a mechanical source of support for the index.
- A fresh tanker attack in the Strait of Hormuz has revived geopolitical risk that had mostly faded, a risk-off catalyst pulling the other way.
- The Nasdaq is coiling inside a symmetrical triangle and is closing in on its apex, where these patterns often resolve.
- 29,710 is the resistance to reclaim and 29,290 the support to hold. Those two levels frame the next move.
SpaceX joins the index as a fresh geopolitical shock lands
The Nasdaq 100 opens Tuesday with two forces pulling in opposite directions. Before the bell, SpaceX (SPCX) officially joins the index, one of the fastest additions on record and the first real test of the exchange’s new fast-track rule, which lets large new listings enter after just 15 trading days rather than waiting for the annual reshuffle. The stock completed the largest IPO on record on 12 June, and today it crosses into one of the world’s most closely tracked benchmarks.
That matters because index membership forces buying. More than $800 billion is benchmarked to the Nasdaq 100, so every fund tracking it has to hold the stock. JPMorgan estimates the move could drive around $4.3 billion of passive demand for SpaceX shares, with funds having started buying at Monday’s close and the rebalance taking effect at today’s open. Because of its small free float, SpaceX enters at a sub-1% weight despite a valuation of roughly $2 trillion, and trackers are trimming small slices of existing heavyweights like Nvidia, Apple, Microsoft, Amazon and Alphabet to make room.
It’s worth a note of caution, though. Index inclusion is not automatically a bullish signal. Several high-profile additions in recent years peaked around the time they joined, so the mechanical demand and the price reaction can quickly part ways.
The bigger swing factor today may come from outside the index. Early on Tuesday, a liquefied natural gas (LNG) tanker off the coast of Oman was struck by a projectile and caught fire in the Strait of Hormuz, according to the British military. Iranian state television said the vessel was hit after ignoring warnings and, citing anonymous sources, implied Tehran was responsible, though there has been no direct official claim. The strike revives a geopolitical risk premium that had largely unwound since the US-Iran deal reopened the strait on 19 June, and it echoes the same tensions that weighed on the Nasdaq through much of June.
For a tech-heavy, risk-sensitive index, that’s an awkward mix: supportive, mechanical buying from the SpaceX debut on one side, and a fresh risk-off catalyst that could weigh on sentiment on the other. With chip stocks already trading nervously on AI-valuation worries and Samsung’s second-quarter preliminary earnings also due today, there’s plenty for the Nasdaq to digest.
Nasdaq daily chart
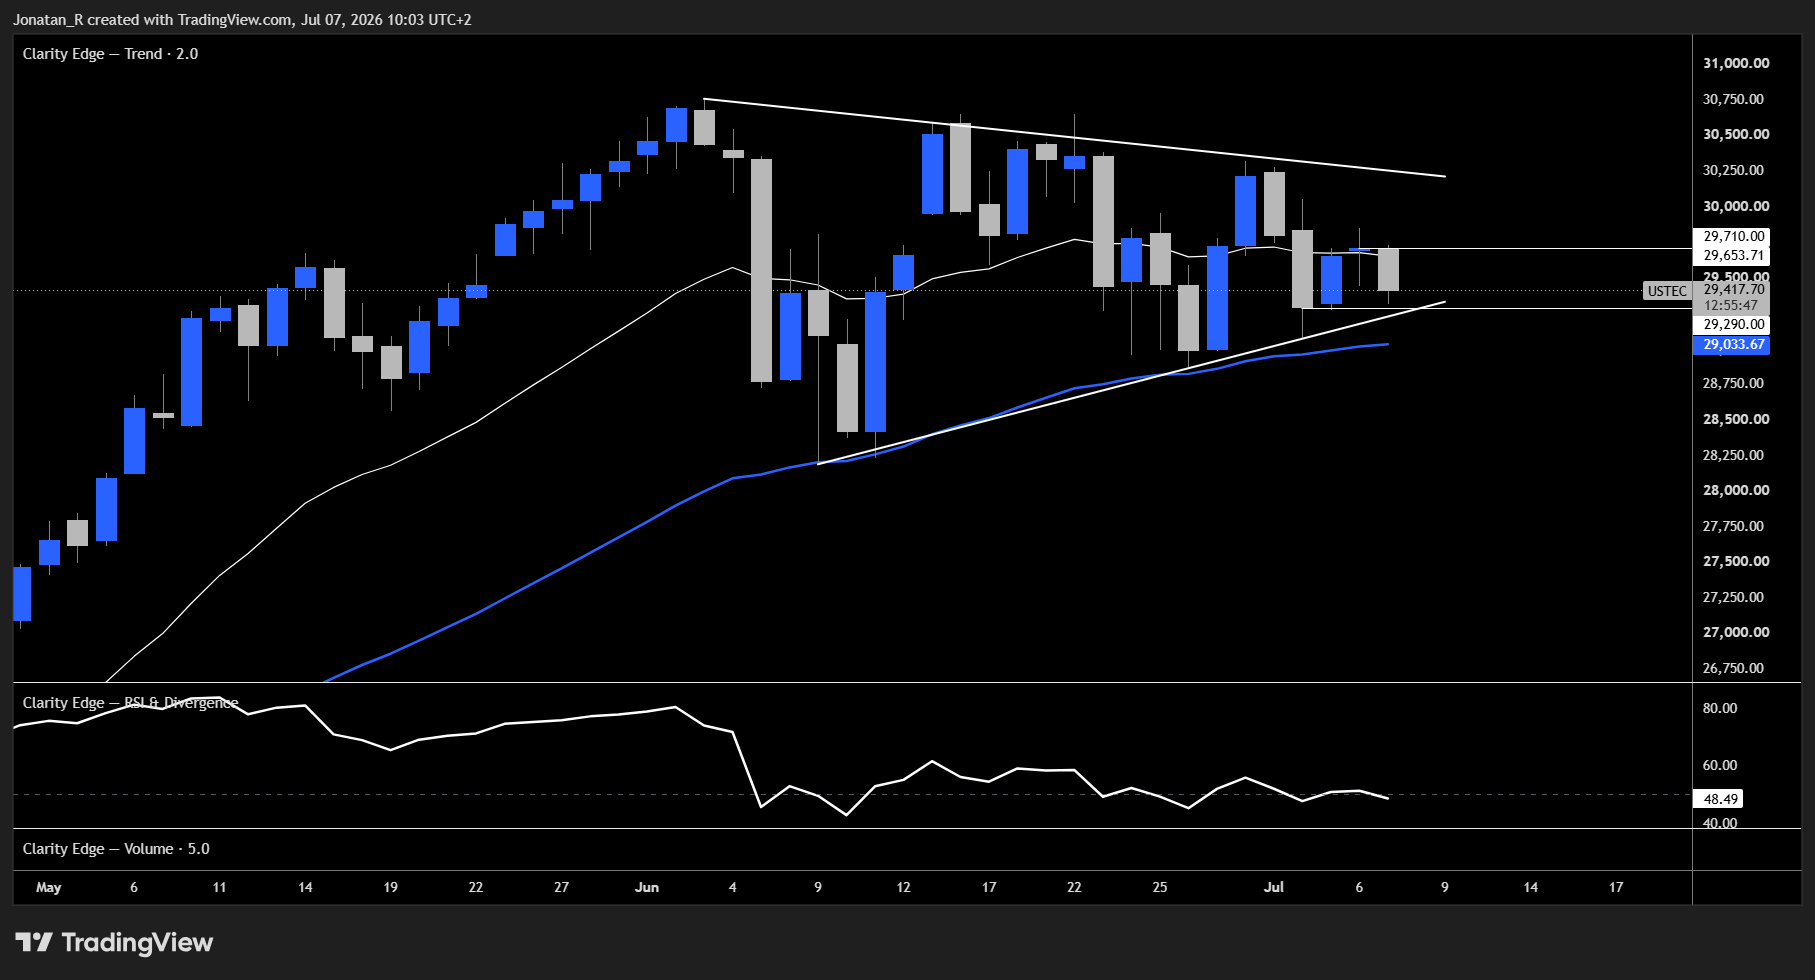
On the daily, yesterday’s candle was an indecisive one and today’s is looking rather bearish so far. The symmetrical triangle is still forming, and price is now getting close to the apex. That’s worth watching, because these patterns often resolve around the 75% completion mark, and we’re closing in on that threshold.
The closest support to watch is 29,290, which also lines up with the ascending trendline of the triangle. Above, the nearest resistance zone sits at 29,710. Together, those two levels mark out clear boundaries, and they set the frame for the lower timeframes.
Nasdaq 4-hour chart
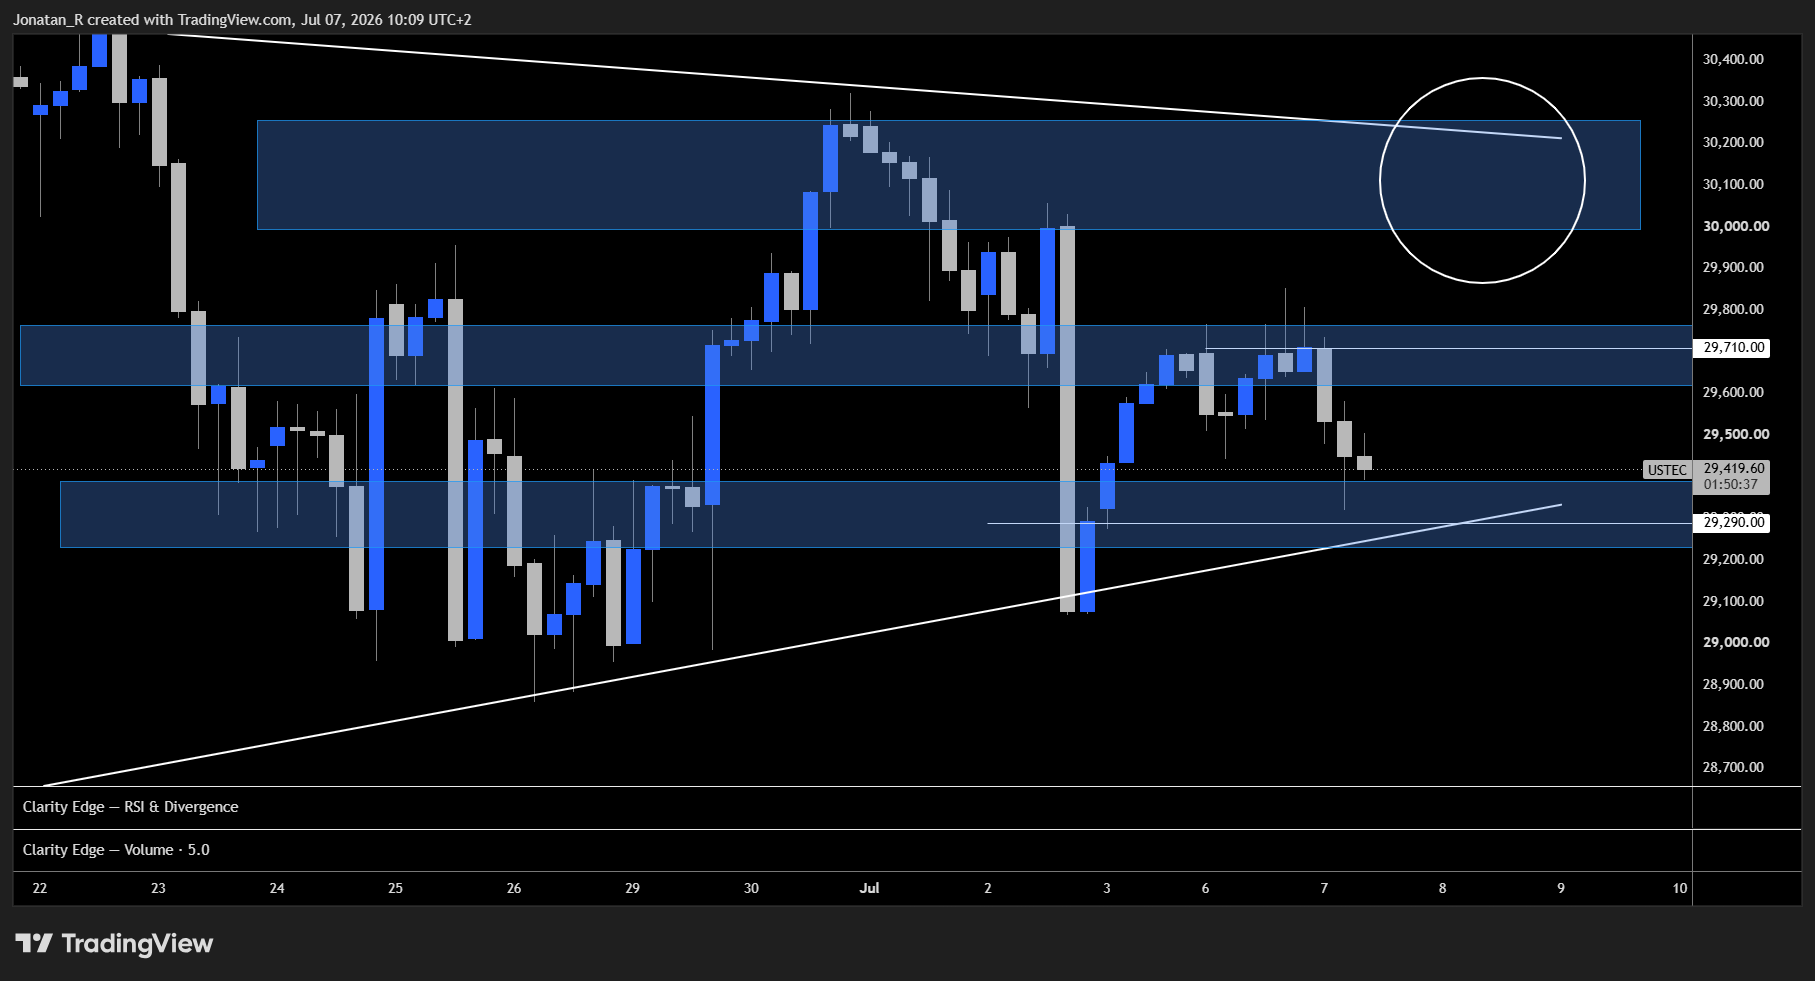
The 4H view shows the same two boundaries: the 29,710 resistance zone above and the 29,290 support zone below, with that lower zone coinciding with the ascending trendline of the symmetrical triangle from the daily.
If the Strait of Hormuz situation deteriorates further, with more attacks and a worsening backdrop, the index could potentially move lower and test the 29,290 support. On the other side, 29,710 is the level to reclaim. A reclaim there would be a clear sign of strength and could open a move higher to test the upper resistance zone marked on the chart (circled), where the descending trendline of the triangle sits. Given how close price is to the triangle’s completion range, that could potentially be a breakout move.
Trading involves risk.
Author



 Risk Disclaimer
The content provided here is for informational purposes only. It is not intended as personal investment advice and does not constitute a solicitation or invitation to engage in any financial transactions, investments, or related activities. Past performance is not a reliable indicator of future results.
The financial products offered by the Company are complex and come with a high risk of losing money rapidly due to leverage. These products may not be suitable for all investors. Before engaging, you should consider whether you understand how these leveraged products work and whether you can afford the high risk of losing your money.
The Company does not accept clients from the Restricted Jurisdictions as indicated in our website/ T&C. Some services or products may not be available in your jurisdiction.
The applicable legal entity and its respective products and services depend on the client’s country of residence and the entity with which the client has established a contractual relationship during registration.