14 min read
 Tezos (XTZ) trades near $0.20 in early August 2026, roughly 98% below the record high it set during the 2021 bull market. Tezos is a layer-1 smart-contract blockchain built around on-chain governance: the network rewrites its own rules through stakeholder votes instead of contentious hard forks, and holders earn rewards by “baking” or delegating their coins to help secure it. This page sets out PrimeXBT’s price outlook for Tezos through 2030 and into the following decade, the levels traders are watching now, and the events that could move the price. Figures are presented as ranges; where the evidence points to a direction rather than a number, the text says so plainly.
Tezos outlook at a glance
- Current price: $0.308 per XTZ.
- 2026 base case: $0.184–$0.235, a year of consolidation close to current levels rather than a trend reversal.
- Main bullish catalyst: a broader layer-1 recovery paired with real traction for Etherlink and the Tezos X EVM rollout.
- Biggest downside risk: a sustained close below the $0.197 support while the wider altcoin market stays weak.
- Long-term view: a slow grind higher is the base case, but figures past 2030 read as scenarios, not targets, and none of them assume a return to the 2021 peak.
Live Tezos price chart
Today (11 October 2026) Tezos (XTZ/USD) is trading at $0.308 per XTZ, with a market cap of $339,150,354 USD. The 24-hour trading volume amounts to $5,322,712 USD. XTZ price has changed by 4.05% in the last 24 hours. Tezos’s circulating supply is 1,098,571,957 XTZ.
Trading involves risk.
Tezos price prediction 2026–2030 (yearly forecast)
The table below gives our expected range for each year to 2030. It reflects a coin that has lost the market position it held in 2021 and now trades as a small-cap layer-1, so the path is gradual rather than explosive. Higher institutional-style targets that assume a full-cycle recovery are kept in the analyst section, where their assumptions can be judged on their own.
| Year | Minimum | Average | Maximum |
|---|---|---|---|
| 2026 | $0.184 | $0.206 | $0.235 |
| 2027 | $0.201 | $0.258 | $0.326 |
| 2028 | $0.260 | $0.321 | $0.381 |
| 2029 | $0.227 | $0.294 | $0.365 |
| 2030 | $0.207 | $0.271 | $0.331 |
Tezos price prediction 2026
Our 2026 outlook holds Tezos close to where it starts the year, a range of $0.184–$0.235 with an average near $0.21. That is consolidation, not recovery: XTZ has spent months pinned to its moving averages, and nothing in the current data argues for a breakout before the wider altcoin market turns.
| Month (2026) | Minimum | Average | Maximum |
|---|---|---|---|
| August | $0.184 | $0.200 | $0.216 |
| September | $0.186 | $0.203 | $0.219 |
| October | $0.187 | $0.205 | $0.223 |
| November | $0.192 | $0.210 | $0.228 |
| December | $0.195 | $0.215 | $0.235 |
Tezos price prediction 2027
2027 is where a modest recovery could begin. Our view puts the full-year range at $0.201–$0.326, averaging near $0.26, on the assumption that capital rotates back toward smaller layer-1s as risk appetite returns. The step up rests on the broader cycle rather than any single Tezos headline.
| Month (2027) | Minimum | Average | Maximum |
|---|---|---|---|
| January | $0.201 | $0.222 | $0.243 |
| February | $0.207 | $0.229 | $0.251 |
| March | $0.212 | $0.236 | $0.259 |
| April | $0.218 | $0.243 | $0.267 |
| May | $0.224 | $0.250 | $0.276 |
| June | $0.229 | $0.257 | $0.284 |
| July | $0.234 | $0.263 | $0.292 |
| August | $0.238 | $0.268 | $0.298 |
| September | $0.242 | $0.274 | $0.305 |
| October | $0.246 | $0.279 | $0.312 |
| November | $0.250 | $0.285 | $0.319 |
| December | $0.254 | $0.290 | $0.326 |
Tezos price prediction 2028
2028 marks the high point of our five-year path. The range runs to $0.260–$0.381 with an average near $0.33, placing the cyclical top in this window if a market-wide upswing arrives on the usual schedule. Even at the top of the band, XTZ stays far below its former highs, which is the honest read for a token whose relevance has narrowed.
| Month (2028) | Minimum | Average | Maximum |
|---|---|---|---|
| January | $0.260 | $0.297 | $0.334 |
| February | $0.265 | $0.304 | $0.343 |
| March | $0.270 | $0.311 | $0.352 |
| April | $0.275 | $0.318 | $0.360 |
| May | $0.280 | $0.325 | $0.369 |
| June | $0.285 | $0.332 | $0.378 |
| July | $0.286 | $0.334 | $0.381 |
| August | $0.283 | $0.331 | $0.379 |
| September | $0.280 | $0.328 | $0.377 |
| October | $0.277 | $0.325 | $0.374 |
| November | $0.273 | $0.323 | $0.372 |
| December | $0.270 | $0.320 | $0.370 |
Tezos price prediction 2029
2029 cools off after the peak. We see the range easing to $0.227–$0.365, averaging near $0.29, as the momentum from the prior year fades and the market digests its gains. A drift lower, not a collapse.
| Month (2029) | Minimum | Average | Maximum |
|---|---|---|---|
| January | $0.266 | $0.315 | $0.365 |
| February | $0.261 | $0.311 | $0.361 |
| March | $0.256 | $0.306 | $0.356 |
| April | $0.251 | $0.302 | $0.352 |
| May | $0.247 | $0.297 | $0.347 |
| June | $0.242 | $0.292 | $0.342 |
| July | $0.239 | $0.289 | $0.339 |
| August | $0.236 | $0.287 | $0.338 |
| September | $0.234 | $0.285 | $0.337 |
| October | $0.232 | $0.284 | $0.335 |
| November | $0.230 | $0.282 | $0.334 |
| December | $0.227 | $0.280 | $0.333 |
Tezos price prediction 2030
By 2030 our outlook settles into $0.207–$0.331, an average near $0.27. Five years out, the shape of the path matters more than any single monthly figure, so treat the numbers below as a trajectory that could shift with the next market cycle rather than dated price targets.
| Month (2030) | Minimum | Average | Maximum |
|---|---|---|---|
| January | $0.225 | $0.278 | $0.331 |
| February | $0.223 | $0.277 | $0.330 |
| March | $0.221 | $0.275 | $0.329 |
| April | $0.219 | $0.274 | $0.328 |
| May | $0.218 | $0.272 | $0.327 |
| June | $0.216 | $0.271 | $0.326 |
| July | $0.214 | $0.270 | $0.325 |
| August | $0.212 | $0.269 | $0.325 |
| September | $0.211 | $0.268 | $0.324 |
| October | $0.210 | $0.267 | $0.324 |
| November | $0.208 | $0.266 | $0.324 |
| December | $0.207 | $0.265 | $0.323 |
Tezos long-term price prediction: 2035, 2040–2050
Nobody can model a decade of governance votes, technology pivots, and macro regimes that do not yet exist, and any figure that reaches to 2050 is closer to a scenario than a forecast. Read the table below as a slope, not a promise: our long-range path drifts higher without ever pretending Tezos reclaims its 2021 valuation, moving from roughly $0.40 around 2035 toward the $1 area by 2050. The uncertainty compounds with every year added.
| Year | Minimum | Average | Maximum |
|---|---|---|---|
| 2035 | $0.296 | $0.400 | $0.504 |
| 2040 | $0.408 | $0.600 | $0.792 |
| 2050 | $0.600 | $1.000 | $1.400 |
What analysts and models say (compared)
Forecasts for Tezos split into two camps that barely overlap. Algorithmic models anchored to the current $0.20 price project continued weakness, while a handful of editorial forecasts assume a full-cycle recovery back toward the old high. Blending numbers built on such different starting assumptions would mislead, so they sit side by side instead.
| Source | Method | Tezos view |
|---|---|---|
| CoinCodex | Algorithmic | 2026 avg ~$0.19; drifting toward ~$0.08 by 2030 |
| Changelly | Algorithmic | 2026 avg ~$0.19; ~$0.08 by 2030, recovering toward ~$0.93 by 2050 |
| Coinpedia | Editorial | 2026 avg ~$1.45; a retest of the ~$9.20 high by 2030 if adoption strengthens |
| DigitalCoinPrice | Algorithmic | $3–$6 range for 2026–2030 (built on stale price data, well above the live market) |
| PrimeXBT | Synthesis | 2026 avg ~$0.21; ~$0.27 by 2030 |
The gap is the point. CoinCodex and Changelly, both grounded in today’s sub-$0.20 price, see Tezos grinding lower before any recovery. Coinpedia’s numbers imply XTZ multiplies more than sevenfold within a year, which the current tape does not support. DigitalCoinPrice’s figures rest on a price near $1.27 that Tezos last traded in early 2025, so its outputs read high against the live market. Our own path sits between the doom and the moon, closer to the algorithmic models but allowing for a mild cyclical bump rather than a straight-line decline.
Track record of this forecast
This is the first published PrimeXBT price forecast for Tezos. From the next monthly review onward, this section will hold the previous forecast up against XTZ’s actual price on the update date and explain any miss rather than quietly revising it away.
Tezos technical analysis
Tezos is boxed in by its two most-watched moving averages. It trades right on its 50-day simple moving average near $0.20 and just under its 200-day average near $0.206, so the shorter and longer trends are both close to flat. The RSI has held around 40 through late July, below the neutral line but short of oversold, which fits a market with no strong buyer.
The support and resistance that matter now sit close together: support near $0.197, then the round $0.19 handle below it, with resistance at $0.203 and again at the 200-day line around $0.206. Reclaiming that 200-day average would be the first sign the multi-month downtrend has stalled. Until then, the broader technical read stays bearish. PrimeXBT’s guide to crypto technical analysis covers how to read these signals.
Correlation with other assets
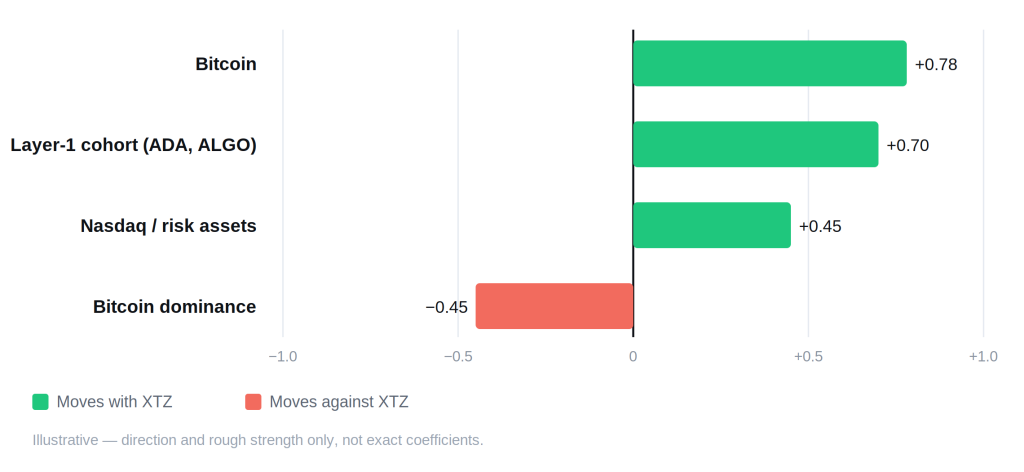
Tezos moves first and foremost as a high-beta bet on Bitcoin. When capital rotates toward Bitcoin and Bitcoin dominance climbs, faded small-cap layer-1s like Tezos are usually the last to catch a bid and the first to be sold. Day to day it also tracks its peer cohort, the older smart-contract alts such as Cardano and Algorand, more tightly than it tracks the market leaders. Where Tezos parts company with the majors is on its own news: because its market position has shrunk, a governance upgrade or an Etherlink milestone can move XTZ on days the rest of crypto barely reacts. Against the US dollar and gold there is no clean story worth trading. These links describe tendencies rather than fixed ratios, and each one can loosen as the market’s mood turns.
Fundamental factors
Tezos’s signature feature is self-amendment. Instead of splitting the community with a hard fork every time the protocol changes, Tezos lets bakers and delegators vote proposals directly onto the chain, and the upgrade installs itself if it passes. That mechanism has delivered a long run of protocol upgrades without a single chain split, and it remains the clearest reason to hold XTZ beyond speculation.
The network runs on Liquid Proof-of-Stake. Validators, called bakers, secure the chain, and ordinary holders can delegate or stake their coins to earn rewards, currently in the range of 7–8% a year. Tezos has no hard cap like Bitcoin’s 21 million; new coins are issued to pay those staking rewards, so the supply climbs steadily, with over a billion XTZ now in circulation. That inflation is the trade-off for the yield, and it is a headwind for price unless demand keeps pace. Tezos also carries a long history: Arthur and Kathleen Breitman launched it after a 2017 token sale that raised around $232 million, one of the largest of its era, though a public governance dispute delayed the mainnet into 2018.
The current story is Etherlink, an EVM-compatible layer-2 that lets Ethereum-style applications run on Tezos infrastructure, and the broader Tezos X effort to put EVM and Tezos’s native Michelson contracts on one ledger. A testnet with both interfaces launched in mid-2026, and a governance vote on the upgrade followed. The bet is that EVM compatibility pulls developers and activity back to a network that lost mindshare after its NFT-driven 2021 peak on marketplaces like Objkt and fx(hash). Whether that bet pays off is the open question hanging over every long-term Tezos forecast. For the mechanics of earning yield on proof-of-stake assets, see PrimeXBT’s guide to staking in crypto.
Upcoming catalysts
Only confirmed, dated events are listed. With Tezos trading as a high-beta risk asset, US monetary policy is the clearest near-term driver, ahead of anything protocol-specific.
| Date | Event | Potential impact |
|---|---|---|
| September 15–16, 2026 | FOMC meeting (with economic projections) | Bull if the Fed signals cuts; bear if it holds rates higher for longer |
| October 27–28, 2026 | FOMC meeting | The rate path steers risk appetite across the alt market |
| December 8–9, 2026 | FOMC meeting (with economic projections) | Year-end policy signal that shapes 2027 positioning |
| H2 2026 (date not yet confirmed) | Next Tezos protocol upgrade via on-chain governance | Continued Etherlink and Tezos X development; no mainnet date announced yet |
FOMC dates follow the Federal Reserve’s published 2026 schedule. The Tezos upgrade is listed without a date because on-chain governance sets the timing by vote, and inventing a mainnet date would be a guess, not information.
Bull case vs bear case
Bull case:
- Risk appetite returns and capital rotates back down the cap scale into older layer-1s, XTZ among them.
- Etherlink and Tezos X draw EVM developers and real usage onto the network, giving XTZ a demand story beyond staking.
- The Fed shifts decisively to rate cuts, lifting the whole crypto complex.
- On-chain governance keeps shipping upgrades without the drama that splits rival chains.
Bear case:
- Tezos stays a legacy name that developers and traders pass over for newer layer-1s and layer-2s.
- Steady coin issuance keeps diluting holders faster than demand grows.
- Bitcoin dominance stays high, leaving small-cap alts starved of flows.
- Sellers push XTZ through the $0.197 floor and the next support gives way, opening room toward the prior lows.
Invalidation levels. The bull case weakens on a decisive close below $0.197, the nearest support. The bear case is invalidated on a sustained reclaim of the 200-day average near $0.206, which would break the pattern of lower highs that has defined the chart for months.
Historical performance
Tezos peaked near $9.12 in October 2021 during the NFT and layer-1 mania, then gave almost all of it back over the following years as the narrative moved on. The 2022 bear market cut it to a fraction of that high, and unlike some peers it never staged a full recovery in the cycles since. Early August 2026 finds XTZ still hugging its lows, below both its long-term average and any level that would suggest the trend has turned. The record shows a coin capable of violent rallies but yet to prove it can hold them.
Is Tezos a good investment in 2026?
Tezos in 2026 is a turnaround bet, not a momentum trade. Our outlook sees XTZ roughly flat into year-end, an average near $0.21, with the wider alt market, not any Tezos headline, likely to decide the next big move. The bull argument leans entirely on Etherlink and Tezos X reviving developer interest in a network that has been fading since 2021; the bear argument is that steady issuance and lost relevance keep a lid on price. Sentiment across crypto has sat in neutral-to-fearful territory, which the Fear and Greed Index tracks. Whether that reads as a discount or a warning depends on how much you believe the upgrade story. PrimeXBT’s overview of the main types of cryptocurrencies puts a smart-contract platform like Tezos in context.
How to trade Tezos on PrimeXBT
On PrimeXBT you can take a position on Tezos in either direction. CFDs on XTZ can be traded long or short, so a falling price is as tradable as a rising one, which matters for a coin still stuck near its lows. Leverage amplifies gains and losses in equal measure, so position sizing and a stop-loss belong on every trade; PrimeXBT’s guide to short selling covers the mechanics of trading the downside. Trade on your own analysis and risk tolerance, and never risk more than you can afford to lose.
Trading involves risk.
How we build this forecast
This outlook is put together by PrimeXBT’s analysts, not lifted from a single price feed. We start from where XTZ trades today, read its position against the 50- and 200-day moving averages and the nearby support and resistance, weigh the fundamentals, staking issuance, on-chain governance, and the Etherlink adoption story, and set all of it against the macro backdrop, chiefly the path of US interest rates. The yearly ranges combine that technical read with the fundamental and macro picture; the long-range figures lean on trajectory rather than precision.
None of this is a guarantee. Crypto is volatile, the inputs shift, and a single macro surprise can move XTZ faster than any model expects. Treat every figure here as a considered estimate, not a promise, and note that we revisit and update the outlook monthly as the data changes.
Author



 Risk Disclaimer
The content provided here is for informational purposes only. It is not intended as personal investment advice and does not constitute a solicitation or invitation to engage in any financial transactions, investments, or related activities. Past performance is not a reliable indicator of future results.
The financial products offered by the Company are complex and come with a high risk of losing money rapidly due to leverage. These products may not be suitable for all investors. Before engaging, you should consider whether you understand how these leveraged products work and whether you can afford the high risk of losing your money.
The Company does not accept clients from the Restricted Jurisdictions as indicated in our website/ T&C. Some services or products may not be available in your jurisdiction.
The applicable legal entity and its respective products and services depend on the client’s country of residence and the entity with which the client has established a contractual relationship during registration.