
 9 min read
 Key takeaways
- The Nasdaq broke below its range lows on Friday but has traded back inside the range today, while the S&P 500 held its range throughout.
- Earnings are strong across the broader index, with 86% of companies beating estimates against a five-year average of 78%, which suggests the pressure is concentrated rather than broad.
- Last week’s Nasdaq weekly candle closed on the weekly 20 EMA, and the accumulation and distribution indicator has not broken down on either index.
- The Fed decides on Wednesday and four megacaps report this week, with 28,600 on the Nasdaq and the S&P 500 range EQ the levels to watch.
Two indices, two different Fridays
Friday produced three different outcomes across the three main US indices. The Dow finished higher, helped by a 3.5% rise in Apple, the S&P 500 closed all but unchanged, and the Nasdaq 100 fell 1.15% to complete its first back-to-back weekly loss since late March. The pressure came from two directions at once. Oil had spent the week climbing on the conflict between the US and Iran, lifting bond yields and the inflation risk attached to them, while the AI spending question that had knocked Alphabet and Tesla the day before was still working through the chip and megacap names. Intel gave up an early gain to close 7.89% lower despite guiding revenue above expectations.
None of that pressure has shown up in the results themselves. With just over a quarter of the S&P 500 reported, 86% have beaten earnings estimates against a five-year average of 78%, and 80% have beaten on revenue against an average of 70%. Blended earnings growth for the quarter sits at 37.9%, though that number is flattered by a one-off gain of roughly $98bn inside Alphabet’s reported earnings per share. Excluding it, growth is 25.9%, still a second consecutive quarter above 20% and a seventh consecutive quarter of double-digit growth. Revenue growth of 13.2% would be the strongest since 2022, ten of the eleven sectors are growing earnings, and the equal-weighted version of the index has outperformed the standard cap-weighted one so far this year.
What is being repriced is not whether the results are good, but what the AI build costs and how it gets paid for. US 10-year yields pushed toward 4.70% as crude moved above $100 last week, and margin debt has been running close to 50% above where it sat a year ago, concentrated in the same names now under pressure. Some of that has come off today. The US paused its strikes on Iran late on Friday and Tehran signalled it would hold while the pause lasts, sending Brent down by as much as 7.4% before it recovered about half the move, with yields easing back toward 4.63% and the dollar softening alongside. How much of it returns depends on this week: the Fed announces on Wednesday and is widely expected to hold, though a meaningful minority of traders are positioned for a hike and the argument has largely shifted to September, 177 S&P 500 companies report including three of the largest cloud providers and Apple, and second-quarter GDP and June inflation both land on Thursday.
Nasdaq weekly chart
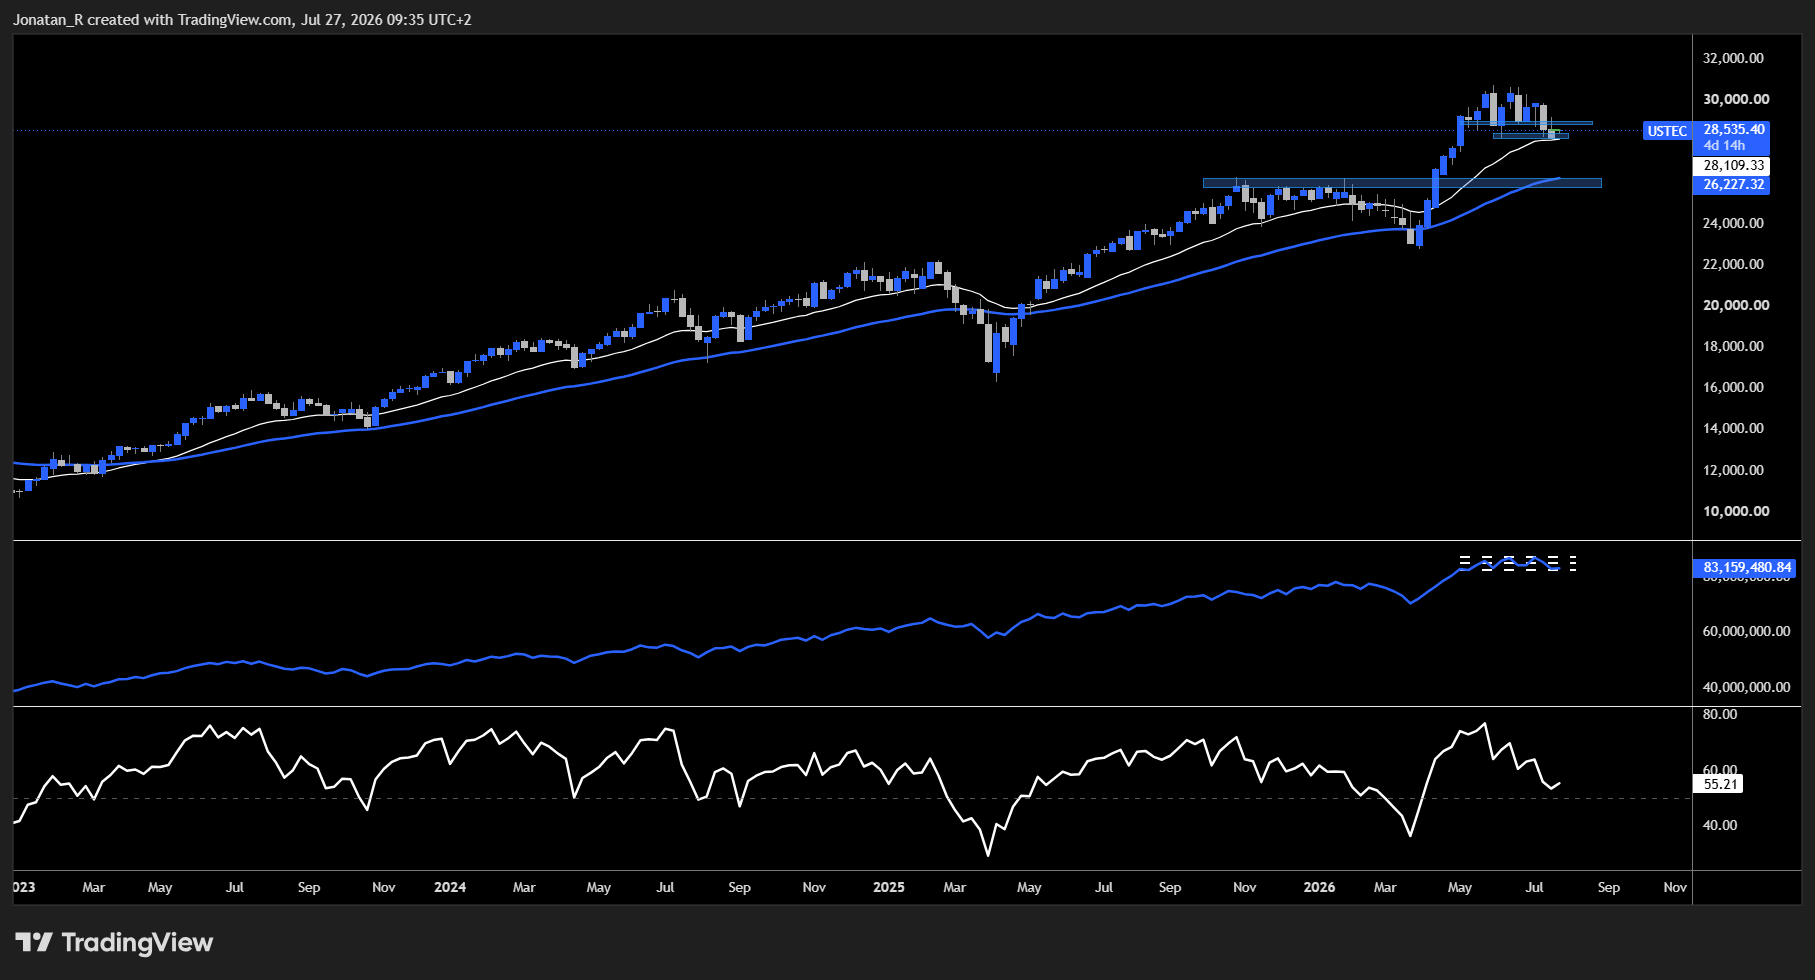
The weekly candle closing on the 20 EMA with the 50 EMA and a high timeframe level below.
Starting on the weekly, last week’s candle closed right on the weekly 20 EMA, the white line. The blue 50 EMA sits below and is confluent with the high timeframe level underneath it, so if we were to fail to hold the 20 EMA we could potentially come down and test that area. The weekly RSI is bouncing around 50, the midpoint, and the accumulation and distribution indicator, the blue line, has consolidated in the same way price has. Neither has given a clear break to the downside yet. On this timeframe it looks more like a potential dip inside an uptrend than a trend that has clearly broken.
Nasdaq daily chart
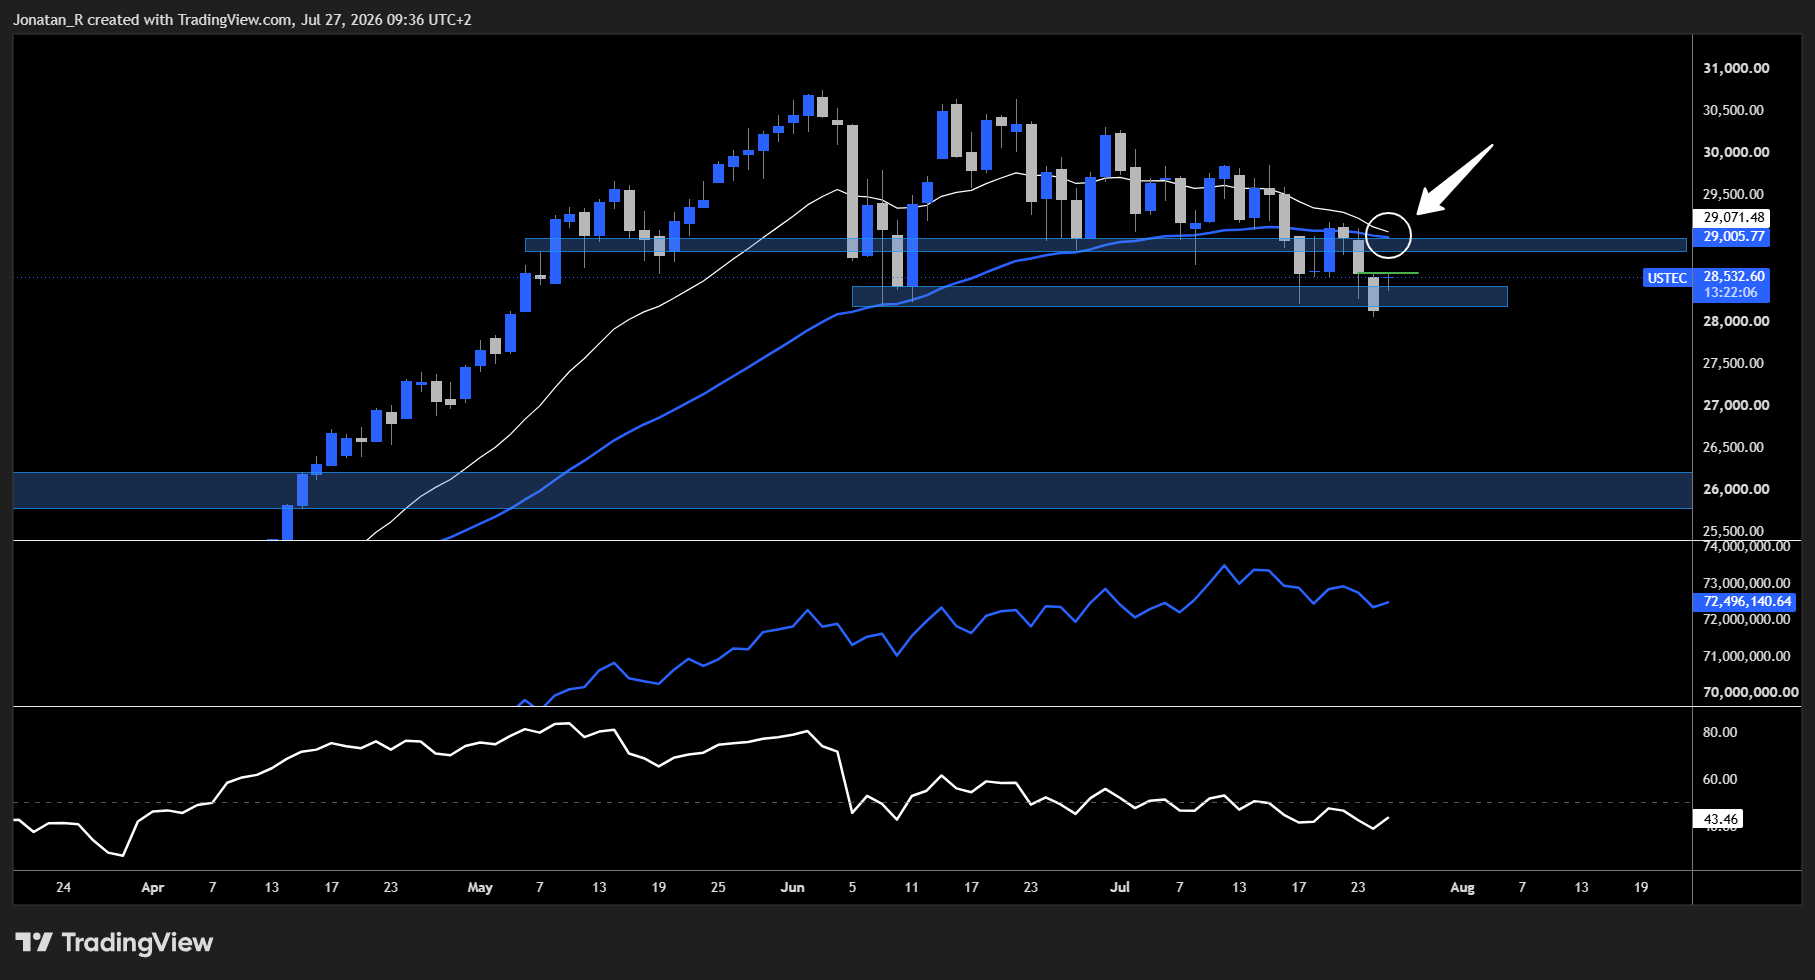
The daily 20 and 50 EMA aligned overhead with the accumulation and distribution line making higher lows.
In our previous coverage of the Nasdaq last week, the high timeframe support zone was the level that would decide whether this remained a consolidation. Friday took price below the range lows, but the break has not been sustained and the index is back inside the range today.
On the daily, the 20 and 50 EMA are now aligned above at around 29,000, where there is a potential resistance zone, marked with the white circle. The blue accumulation and distribution indicator is creating higher lows even while price is in a downtrend. That points to some conviction from buyers, because what the indicator measures is the size of the bullish candles against the size of the bearish ones in relation to volume.
Nasdaq 4H chart
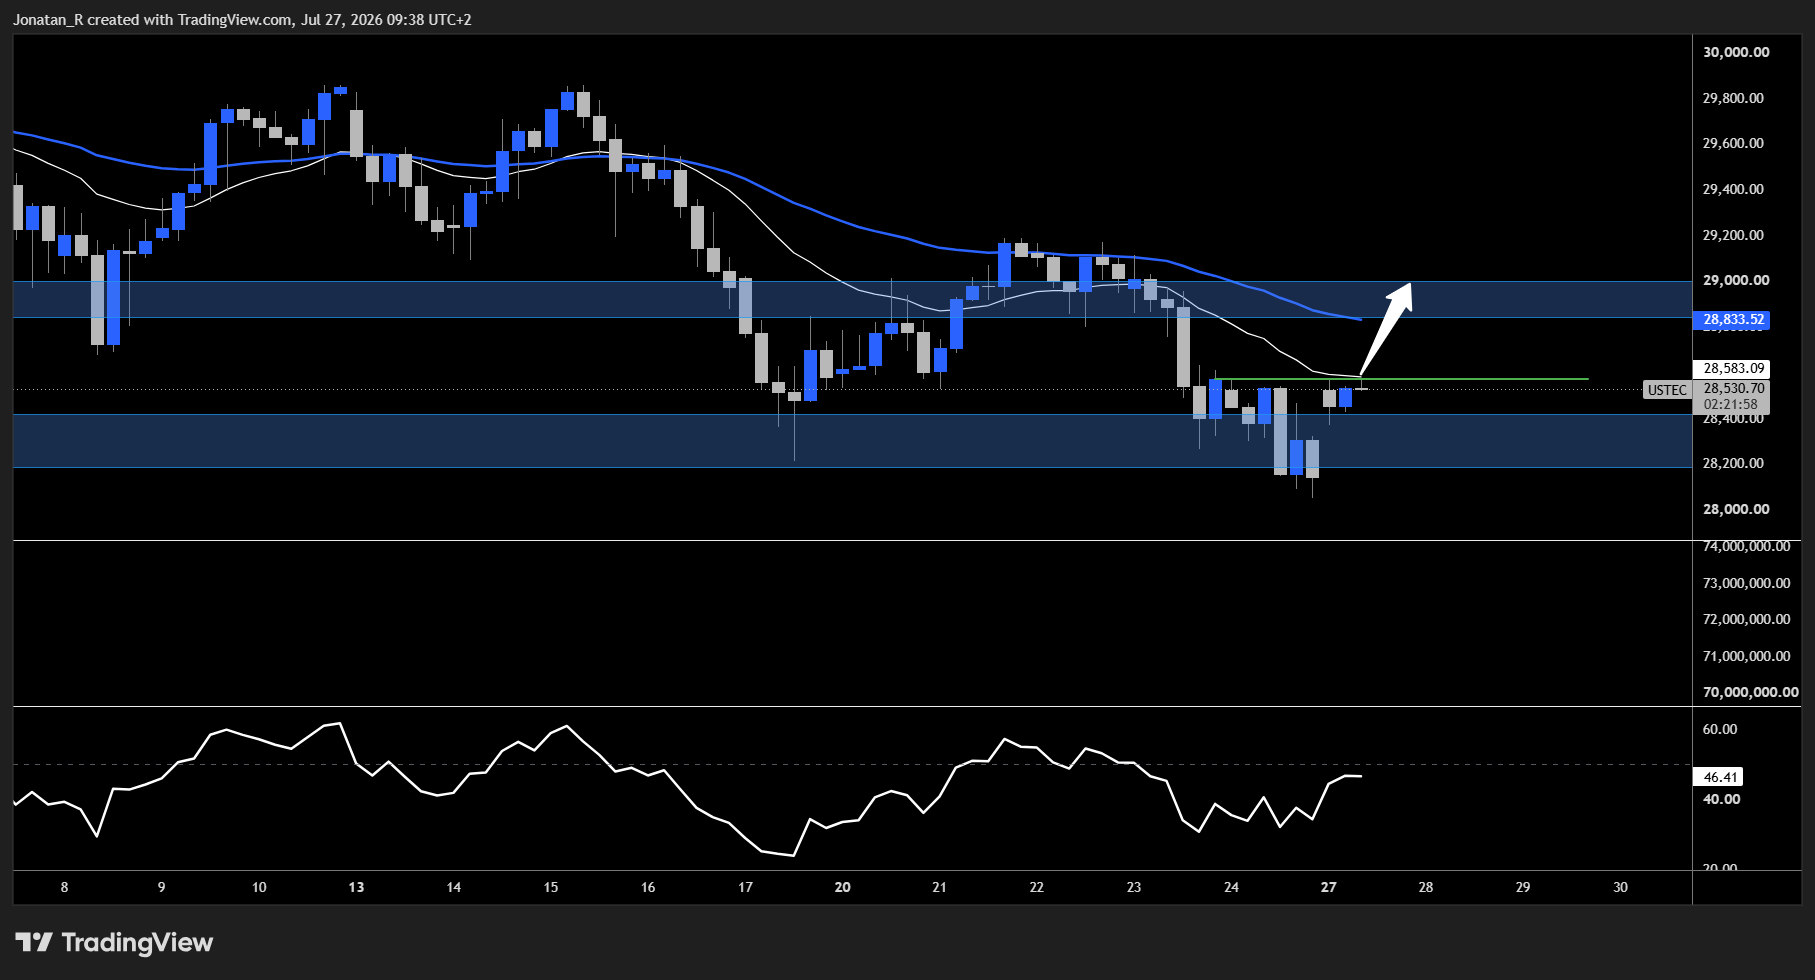
Low timeframe resistance at 28,600 with the daily moving average zone above.
On the 4H there is a clear low timeframe resistance zone at around 28,600, which is also confluent with the 20 EMA on this timeframe. A break above that level could potentially open a move up to test the resistance area at around 29,000, where those daily moving averages are aligned.
S&P 500 weekly chart
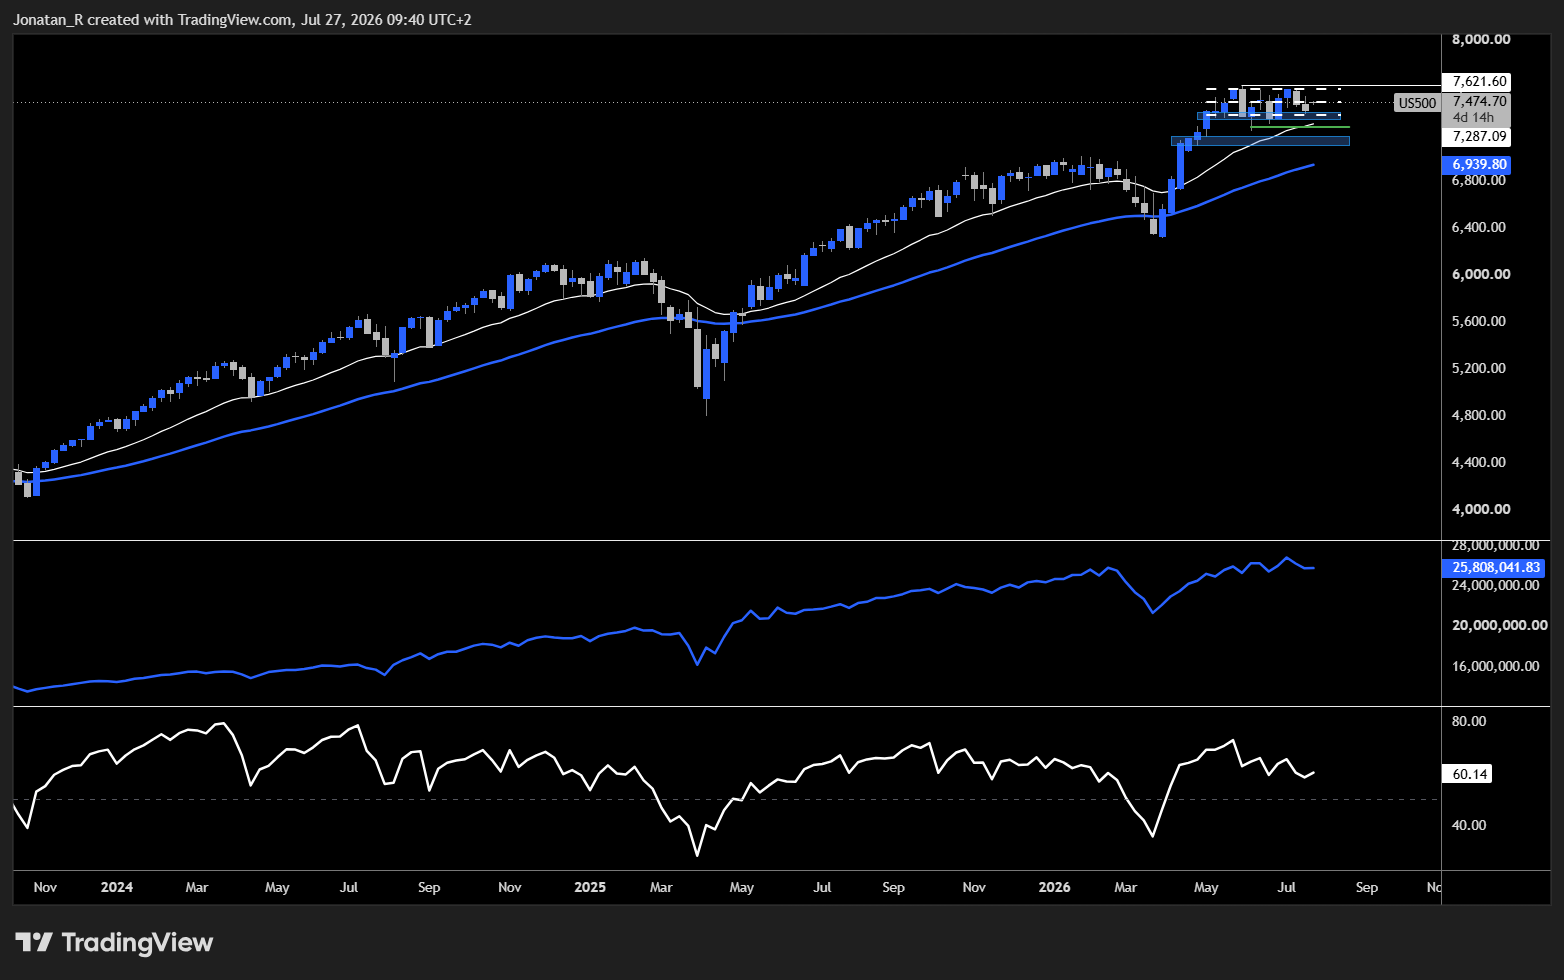
The weekly trend intact with the accumulation and distribution line making higher highs and higher lows.
Comparing the S&P 500 to the Nasdaq on the weekly, we have the same type of high timeframe trend. In bull markets price does occasionally come down and test the white weekly 20 EMA, and that has not happened on the S&P 500 since it reclaimed the level at the beginning of April this year. Price is consolidating here, and the accumulation and distribution indicator is creating higher highs and higher lows, which shows there is still strength from the buyers in terms of the size of the candles in combination with volume.
Looking at this chart alongside the Nasdaq, one could potentially say that the Nasdaq broke down because of earnings-related issues at the big tech companies, given that the Nasdaq is more tech-heavy while the S&P 500 is a broader index. That would suggest there may be more pressure to come within the tech industry, while the overall stock market appears relatively healthy.
S&P 500 daily chart
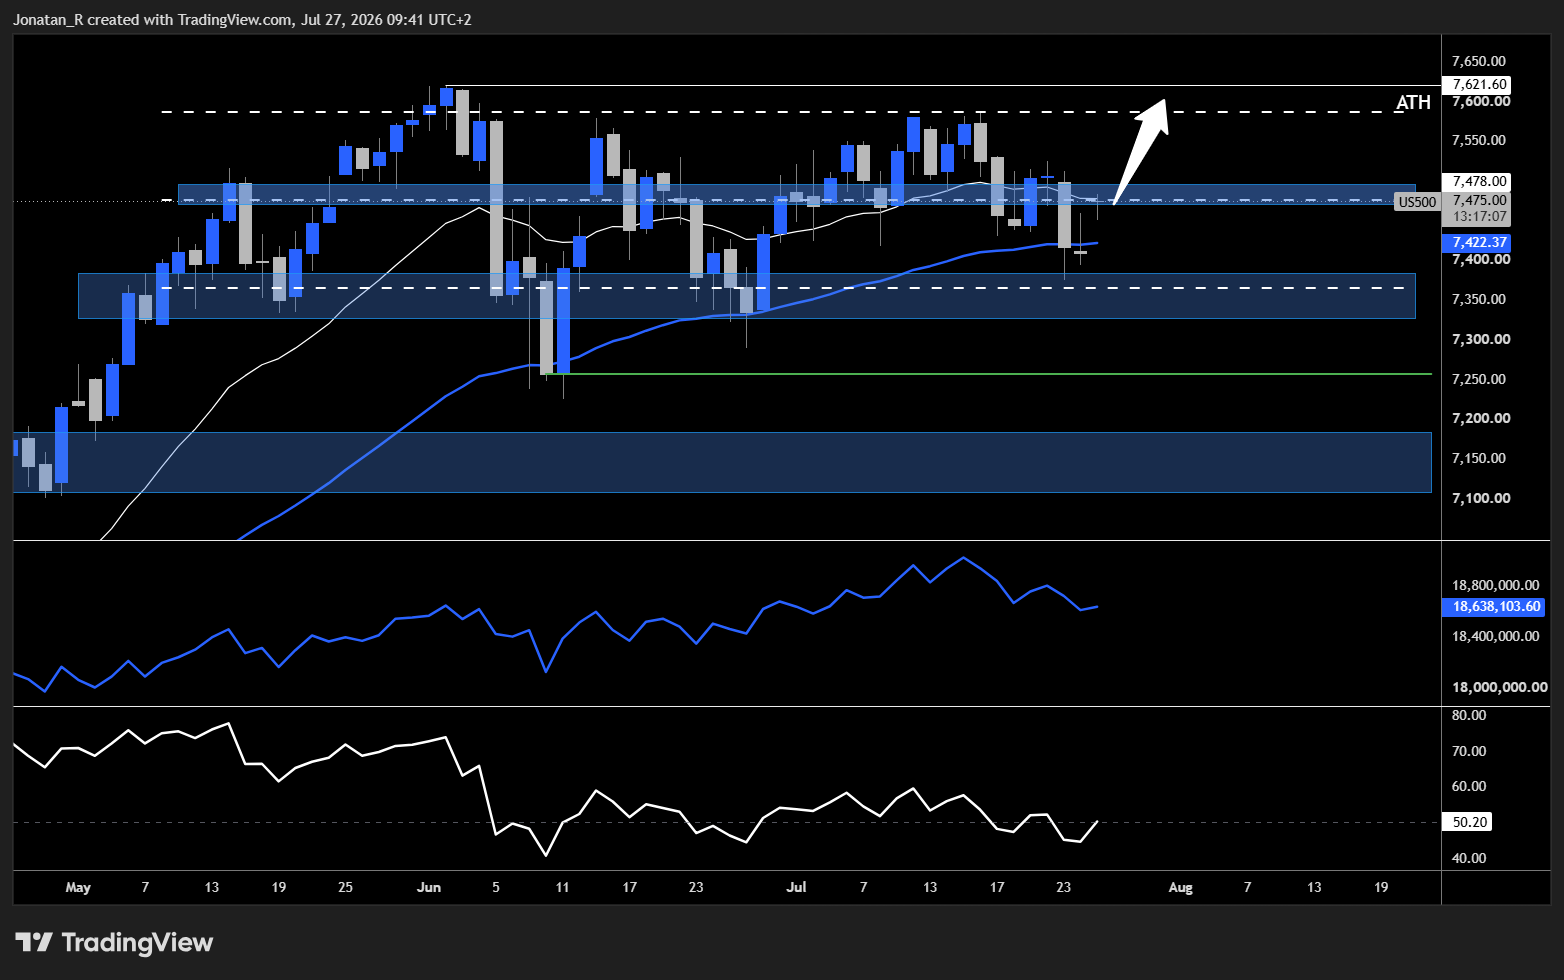
Price testing the range equilibrium after gapping higher, with the previous all-time high region above.
Our previous S&P 500 analysis had buyers defending support ahead of a heavy news week, and the index has spent the time since moving sideways rather than resolving in either direction.
On the daily, the accumulation and distribution indicator has created local lower highs and lower lows, but it is still holding within the current trend. We had a decent gap up this morning, most likely because of the signs of the escalation in Iran easing, which brought risk back on the menu. Price is currently testing the range EQ area. A reclaim of the range EQ would be a significant sign of strength, and could potentially open a move up towards the 7,600 level, which is the previous all-time high region.
Key levels to watch
Nasdaq
- 28,600: low timeframe resistance on the 4H, confluent with the 4H 20 EMA
- 29,000: daily 20 and 50 EMA aligned, potential resistance zone
- Weekly 20 EMA: where last week’s candle closed, the level to hold
- Weekly 50 EMA: confluent with the high timeframe level below, first area of interest if the 20 EMA fails
S&P 500
- Range EQ area: being tested now, a reclaim would be the sign of strength
- 7,600: previous all-time high region, potential upside target on a reclaim
- Weekly 20 EMA: untested since April, the level below if the range gives way
Trading involves risk.
Author



 Risk Disclaimer
The content provided here is for informational purposes only. It is not intended as personal investment advice and does not constitute a solicitation or invitation to engage in any financial transactions, investments, or related activities. Past performance is not a reliable indicator of future results.
The financial products offered by the Company are complex and come with a high risk of losing money rapidly due to leverage. These products may not be suitable for all investors. Before engaging, you should consider whether you understand how these leveraged products work and whether you can afford the high risk of losing your money.
The Company does not accept clients from the Restricted Jurisdictions as indicated in our website/ T&C. Some services or products may not be available in your jurisdiction.
The applicable legal entity and its respective products and services depend on the client’s country of residence and the entity with which the client has established a contractual relationship during registration.








