14 min read
 Uniswap (UNI) is the governance token of the largest decentralized exchange in crypto, an Ethereum-based protocol that lets anyone swap tokens through automated liquidity pools instead of a traditional order book. This page sets out PrimeXBT’s price outlook for UNI through 2030 and out to 2050, the technical levels traders are watching now, and the catalysts that could move the price. Every figure is an estimate expressed as a band rather than a single point, and where the evidence runs thin we flag it plainly instead of inventing precision.
Uniswap outlook at a glance
- Current price: $7.688 per UNI.
- 2026 base case: consolidation around an average near $4.00, holding just above the long-term moving averages rather than starting a new bull run.
- Main bullish catalyst: the newly activated fee switch, which now burns UNI from protocol and Unichain fees and turns network usage into a standing bid on supply.
- Biggest downside risk: a broad DeFi drawdown and a sustained break below the $3.78 support, with sentiment already sitting in “Fear.”
- Long-term view: the multi-year path trends higher as supply thins, but forecasts past 2030 point in a direction rather than at a number.
Live Uniswap price chart
Today (12 October 2026) Uniswap (UNI/USD) is trading at $7.688 per UNI, with a market cap of $4,804,548,515 USD. The 24-hour trading volume amounts to $471,618,442 USD. UNI price has changed by 2.41% in the last 24 hours. Uniswap’s circulating supply is 624,960,422 UNI.
Trading involves risk.
Uniswap price prediction 2026–2030 (yearly forecast)
The table sets PrimeXBT’s expected range for each year, built from a single continuous monthly path so the annual figures and the month-by-month tables below always agree. Longer-horizon institutional and algorithmic targets, which rest on incompatible assumptions and diverge sharply, are kept in the analyst section rather than blended in here.
| Year | Minimum | Average | Maximum |
|---|---|---|---|
| 2026 | $3.66 | $4.01 | $4.41 |
| 2027 | $3.77 | $4.66 | $5.70 |
| 2028 | $4.59 | $5.61 | $6.60 |
| 2029 | $4.18 | $5.25 | $6.35 |
| 2030 | $3.84 | $4.91 | $5.90 |
Uniswap price prediction 2026
PrimeXBT’s 2026 outlook centers on an average near $4.00, inside a range of $3.66–$4.41 — a year of consolidation close to the current price rather than a decisive move in either direction. UNI trades just above both its 50- and 200-day moving averages, which is constructive, but sentiment sits in “Fear” and the fee-switch burn needs time to show up in the supply data. The forward months for 2026 read as follows:
| Month (2026) | Minimum | Average | Maximum |
|---|---|---|---|
| August | $3.68 | $4.00 | $4.32 |
| September | $3.67 | $4.00 | $4.33 |
| October | $3.66 | $4.00 | $4.34 |
| November | $3.68 | $4.03 | $4.37 |
| December | $3.69 | $4.05 | $4.41 |
Uniswap price prediction 2027
2027 is the recovery year in this outlook, with the average lifting to roughly $4.70 across a range of $3.77–$5.70. The step up leans on two things working together: a broader DeFi upcycle returning liquidity to on-chain trading, and a full year of fee-driven burns steadily removing UNI from circulation.
| Month (2027) | Minimum | Average | Maximum |
|---|---|---|---|
| January | $3.77 | $4.15 | $4.53 |
| February | $3.85 | $4.25 | $4.65 |
| March | $3.93 | $4.35 | $4.77 |
| April | $4.01 | $4.45 | $4.89 |
| May | $4.09 | $4.55 | $5.01 |
| June | $4.17 | $4.65 | $5.13 |
| July | $4.24 | $4.74 | $5.24 |
| August | $4.29 | $4.81 | $5.33 |
| September | $4.34 | $4.88 | $5.42 |
| October | $4.40 | $4.95 | $5.51 |
| November | $4.45 | $5.03 | $5.60 |
| December | $4.50 | $5.10 | $5.70 |
Uniswap price prediction 2028
2028 holds the cyclical high in PrimeXBT’s model, with the average peaking near $5.60 over a range of $4.59–$6.60. This is the window where a maturing burn mechanism and a risk-on macro backdrop are most likely to overlap. It stops well short of the 2021 record, and deliberately so — a return to the old high would need a DeFi mania this outlook does not assume.
| Month (2028) | Minimum | Average | Maximum |
|---|---|---|---|
| January | $4.59 | $5.22 | $5.84 |
| February | $4.68 | $5.33 | $5.98 |
| March | $4.77 | $5.45 | $6.12 |
| April | $4.86 | $5.56 | $6.26 |
| May | $4.95 | $5.68 | $6.41 |
| June | $5.03 | $5.79 | $6.55 |
| July | $5.05 | $5.83 | $6.60 |
| August | $5.00 | $5.78 | $6.56 |
| September | $4.95 | $5.74 | $6.53 |
| October | $4.89 | $5.69 | $6.49 |
| November | $4.84 | $5.65 | $6.45 |
| December | $4.79 | $5.60 | $6.41 |
Uniswap price prediction 2029
2029 cools off after the peak. The average eases to about $5.20 within a range of $4.18–$6.35, a gentle give-back rather than a crash, as the post-peak profit-taking that follows most crypto cycles plays out.
| Month (2029) | Minimum | Average | Maximum |
|---|---|---|---|
| January | $4.72 | $5.54 | $6.35 |
| February | $4.66 | $5.48 | $6.29 |
| March | $4.59 | $5.42 | $6.24 |
| April | $4.53 | $5.35 | $6.18 |
| May | $4.47 | $5.29 | $6.12 |
| June | $4.40 | $5.23 | $6.06 |
| July | $4.35 | $5.19 | $6.02 |
| August | $4.32 | $5.16 | $6.00 |
| September | $4.28 | $5.13 | $5.98 |
| October | $4.25 | $5.10 | $5.96 |
| November | $4.21 | $5.08 | $5.94 |
| December | $4.18 | $5.05 | $5.92 |
Uniswap price prediction 2030
PrimeXBT’s 2030 view settles on an average near $4.90 across a range of $3.84–$5.90. By this point the price rests more on Uniswap’s fee revenue and shrinking float than on any single event, so treat the monthly path below as the shape of a trend, not a set of dated targets.
| Month (2030) | Minimum | Average | Maximum |
|---|---|---|---|
| January | $4.15 | $5.03 | $5.90 |
| February | $4.12 | $5.00 | $5.89 |
| March | $4.09 | $4.98 | $5.87 |
| April | $4.06 | $4.96 | $5.86 |
| May | $4.03 | $4.93 | $5.84 |
| June | $4.00 | $4.91 | $5.83 |
| July | $3.97 | $4.89 | $5.81 |
| August | $3.94 | $4.87 | $5.80 |
| September | $3.92 | $4.85 | $5.79 |
| October | $3.89 | $4.84 | $5.78 |
| November | $3.87 | $4.82 | $5.77 |
| December | $3.84 | $4.80 | $5.76 |
Uniswap long-term price prediction: 2035, 2040–2050
Push the horizon past five years and the honest answer is that nobody can price a decade of DeFi regulation, technology shifts, and macro regimes that have not happened yet. What follows is a trajectory, and the uncertainty widens with every year added. On that basis PrimeXBT’s long-range path climbs gradually — an average near $7.50 in 2035, roughly $10.50 by 2040, and around $16.00 by 2050 — driven mainly by a supply that keeps thinning as the burn compounds:
| Year | Minimum | Average | Maximum |
|---|---|---|---|
| 2035 | $5.70 | $7.50 | $9.30 |
| 2040 | $7.35 | $10.50 | $13.65 |
| 2050 | $9.92 | $16.00 | $22.08 |
What analysts and models say (compared)
Uniswap forecasts split cleanly into two camps, and the gap between them is wide enough that averaging would mislead. Algorithmic models expect UNI to drift lower for years; scenario-based research houses see it climbing. Both are laid out side by side below.
| Source | Method | Uniswap view |
|---|---|---|
| CoinCodex | Algorithmic | 2026 avg ~$3.33; declines toward ~$2.16 by 2030, then ~$15.88 by 2050 |
| Changelly | Algorithmic | 2026 avg ~$3.70; ~$2.38 by 2030, recovering to ~$15.42 by 2050 |
| CoinLore | Scenario-based | Base case ~$3.43 (2027) rising to ~$7.07 (2030); bull case as high as ~$44.90 |
The disagreement is the signal. The purely technical models extrapolate UNI’s long downtrend and see more of the same into the late 2020s, then a slow climb toward the mid-teens by 2050. The scenario models weight the fee switch and DeFi growth far more heavily and reach 2030 numbers several times higher. PrimeXBT’s own path sits between them: above the algorithmic cluster, because a live burn changes UNI’s supply math in a way price-history models struggle to capture, but below the bullish scenarios, because sentiment is fearful and the token still trades more than 90% under its record. Anyone hunting for a single agreed number will not find one here.
Track record of this forecast
This is the first published PrimeXBT price forecast for Uniswap. Each monthly review from here will hold the previous forecast up against UNI’s actual price on the update date and explain any gap in plain terms, rather than quietly revising the numbers and moving on. A forecast that hides its own misses is not worth much.
Uniswap technical analysis
As of publication, UNI trades near $4.00, just above its 50-day simple moving average of $3.46 and its 200-day average of $3.49 — the two sitting almost on top of each other, which marks a market that has stopped falling but has not committed to a trend. The 14-day RSI reads around 56, comfortably neutral, while the crypto Fear & Greed Index sits near 29, in “Fear.”
The support and resistance levels that matter now: immediate support at $3.94, then $3.87 and $3.78, with a deeper liquidity cluster around $5.10 acting as a magnet on any rally. Overhead, resistance starts at $4.10, then $4.20 and $4.27, with a much heavier ceiling near $8.40 — a level UNI has historically needed to clear before any sustained run. Holding above the twin moving averages keeps the near-term picture constructive; losing $3.78 would hand momentum back to sellers. For the basics of reading these signals, see PrimeXBT’s guide to crypto technical analysis.
Correlation with other assets
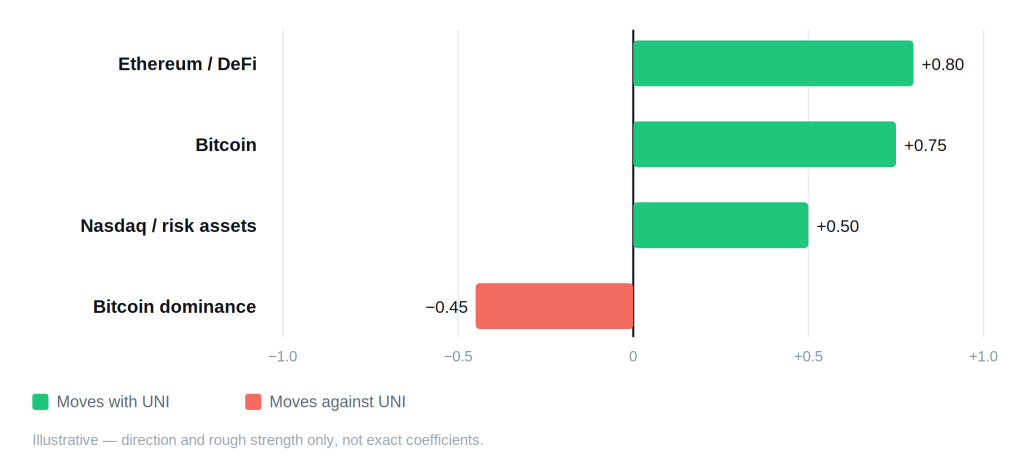
As an ERC-20 token and the flagship of DeFi, UNI trades as a high-beta bet on Ethereum first and Bitcoin second — when the majors rally, UNI tends to move further in the same direction, and it falls harder when they drop. Its demand is also tied to something more specific than the rest of the market: the volume flowing through the Uniswap protocol itself. Busy weeks of on-chain swapping now feed the fee burn directly, so DEX activity and total DeFi liquidity read across to UNI more tightly than to a generic large-cap coin. The token tends to lag when Bitcoin dominance climbs and capital rotates out of alts, and it has tracked risk assets like the Nasdaq more closely since institutions entered crypto, which is why Federal Reserve policy shows up quickly in its price. One extra sensitivity sets UNI apart: governance and regulation. Votes on how the fee switch expands, and any shift in how regulators treat DeFi, can move the token independently of the broader market. Read these as tendencies that drift over time, not fixed numbers.
Fundamental factors
Uniswap is the largest decentralized exchange by volume, built on the automated market maker model: instead of matching buyers and sellers, it prices trades against pooled liquidity that anyone can supply. Hayden Adams launched the protocol in 2018, and the UNI governance token arrived in a September 2020 airdrop to early users. Token holders steer the protocol through the Uniswap DAO, and the codebase has moved from the v2 constant-product pools to v3’s concentrated liquidity and v4’s customizable “hooks,” alongside Unichain, the protocol’s own Ethereum layer-2 network.
The fundamental picture changed in a way that rarely happens for a governance token: the fee switch is now on. After the UNIfication proposal passed governance with near-unanimous support, the protocol executed a one-time burn of 100 million UNI from the treasury and began directing a share of trading fees — including Unichain sequencer fees — into ongoing UNI burns rather than paying them entirely to liquidity providers. For years UNI’s central open question was whether the token would ever capture the value the protocol generates; that question now has an answer, and it makes UNI structurally deflationary as usage rises. Supply is capped at 1 billion UNI, with roughly 630 million in circulation, so the burn works against a fixed ceiling while scheduled emissions and a governance-funded growth budget still add tokens on the other side of the ledger.
Upcoming catalysts
Only confirmed, dated events are listed. With UNI tracking risk assets closely, U.S. monetary policy is the clearest near-term driver; the fee-switch rollout is the clearest crypto-specific one, though its later phases carry no fixed calendar date.
| Date | Event | Potential impact |
|---|---|---|
| September 15–16, 2026 | FOMC meeting (with economic projections) | Bull if the Fed signals cuts; bear if it holds rates higher for longer |
| October 27–28, 2026 | FOMC meeting | Rate path steers risk appetite across DeFi and alts |
| December 8–9, 2026 | FOMC meeting (with economic projections) | Year-end policy signal for 2027 positioning |
| 2026 (dates not fixed) | Phased expansion of the fee switch to further v3/v4 pools, layer-2s, and UniswapX | Wider burn coverage lifts the amount of UNI removed as volume grows |
FOMC dates follow the Federal Reserve’s published 2026 schedule. The fee-switch phases are listed without exact dates because governance has approved the direction but not a fixed timetable for each stage — an invented date would be a guess, not information.
Bull case vs bear case
Bull case:
- Fee-driven burns compound as protocol and Unichain volume grow, shrinking the circulating float.
- The Fed shifts to rate cuts and capital rotates back into DeFi and higher-beta alts.
- Uniswap defends its lead in DEX market share as on-chain trading takes volume from centralized venues.
- Governance keeps widening the fee switch, deepening the link between usage and token value.
Bear case:
- A DeFi-wide drawdown drains liquidity and trading volume, so the burn barely dents supply.
- Regulators tighten the screws on decentralized exchanges, capping Uniswap’s addressable market.
- Competing DEXs and aggregators erode market share and fee income.
- Rates stay higher for longer and UNI, still deep under its record, keeps grinding sideways in “Fear.”
Invalidation levels. The bull case loses its footing if UNI closes below $3.78, the third support and the floor of the current consolidation. The bear case is invalidated on a sustained break above $4.27, and more convincingly on a reclaim of the $5.10 liquidity cluster, which would open the path toward the heavier $8.40 ceiling.
Historical performance
UNI’s chart is a story of one blow-off top and a long descent. The token reached about $44.97 on May 3, 2021, during the first DeFi mania, then gave back the vast majority of that value over the following years and now trades more than 90% below the record. The pattern is a spike-and-drift rather than the steady staircase some larger coins have printed, and the newly live burn is the first structural change to UNI’s supply since launch. Whether that is enough to break the drift is the question the next few years answer.
Is Uniswap a good investment in 2026?
It comes down to what an investor is buying. On PrimeXBT’s numbers UNI looks range-bound into year-end, averaging near $4.00, so anyone expecting a fast repeat of 2021 is likely to be disappointed. The longer case is more interesting: for the first time UNI captures a slice of the fees the largest DEX generates, which ties the token’s value to real usage instead of governance rights alone. Set against that are fearful sentiment, a live regulatory overhang on DeFi, and a price still far under its peak. PrimeXBT’s explainer on what Uniswap is and how it works covers the mechanics behind that trade-off.
How to trade Uniswap on PrimeXBT
On PrimeXBT you can take a position on Uniswap in either direction. CFDs on UNI can be traded long or short, so a view that the price falls is as tradable as a view that it rises — see PrimeXBT’s guide to short selling for how the downside side works. Leverage magnifies gains and losses alike, so position sizing and a stop-loss matter on every trade. Trade on your own analysis and risk tolerance, and never commit more than you can afford to lose.
Trading involves risk.
How we build this forecast
PrimeXBT’s analysts assemble this outlook rather than lifting it from one price feed. We start from where UNI trades today, read its position against the 50- and 200-day moving averages and the live support and resistance levels, weigh the fundamentals — the fee-switch burn, DEX market share, Unichain volume, and supply schedule — and set all of it against the macro backdrop, chiefly the path of U.S. interest rates. The yearly ranges come from a single continuous monthly model so the tables never contradict each other; the long-range figures lean on trajectory over precision.
No part of this is a promise. Crypto is volatile, the inputs move, and a single regulatory or macro surprise can push UNI faster than any model expects. Treat every figure as a considered estimate, and note that we revisit and update this outlook monthly as the data changes.
Author



 Risk Disclaimer
The content provided here is for informational purposes only. It is not intended as personal investment advice and does not constitute a solicitation or invitation to engage in any financial transactions, investments, or related activities. Past performance is not a reliable indicator of future results.
The financial products offered by the Company are complex and come with a high risk of losing money rapidly due to leverage. These products may not be suitable for all investors. Before engaging, you should consider whether you understand how these leveraged products work and whether you can afford the high risk of losing your money.
The Company does not accept clients from the Restricted Jurisdictions as indicated in our website/ T&C. Some services or products may not be available in your jurisdiction.
The applicable legal entity and its respective products and services depend on the client’s country of residence and the entity with which the client has established a contractual relationship during registration.