20 min read
 USD/JPY shows how many Japanese yen one US dollar buys, so a higher number means a weaker yen and a stronger dollar. It is one of the most heavily traded currency pairs in the world, and it trades near 157 in late September 2026, after a year in which the yen touched its weakest level against the dollar in four decades, Japan spent a record sum defending it, and the US Treasury bought yen for the first time since 1998. This page sets out PrimeXBT’s base case through 2030, what named banks and the Reuters poll expect, and what the forward market has already priced. The ranges below shift when the rate outlook on either side shifts; they are not targets.
USD/JPY outlook at a glance
- Current rate: 157.973, -0.01% over the last 24 hours.
- 2026 base case: 150.21 to 163.05 across the remaining months, centred near 156.50 at year-end, which leaves the yen marginally stronger than today.
- What analysts say: named end-2026 calls run from 149 at BofA to 164 at J.P. Morgan, both dated September 2026; the Reuters/LSEG poll published 5 August 2026 had a six-month median of 157.
- What the market is priced for: the 12-month forward sits at 152.55 (FXEmpire, 22 September 2026). That is arithmetic from the interest-rate gap, not a forecast: dollar rates are higher, so the dollar is quoted at a discount forward.
- Biggest risk to the call: a Fed that keeps hiking while the Bank of Japan pauses. A sustained close above Scotiabank’s 160 resistance means renewed yen weakness.
- Long-term view: past two years the inflation gap is the only anchor left, and it points to a slowly stronger yen inside a band wide enough to swallow most of the signal.
Live USD/JPY chart
Trading involves risk.
Today (17 October 2026) USD/JPY is trading at 157.973, -0.01% over the last 24 hours. The USD/JPY chart page carries the live quote and the history behind it.
USD/JPY forecast 2026–2030
PrimeXBT’s base case puts USD/JPY at 156.50 at the end of 2026 and 151.50 at the end of 2027, a gradually stronger yen rather than a reversal. Named bank targets and the market-implied forward are kept separate, further down the page.
| Year | Minimum | Average | Maximum |
|---|---|---|---|
| 2026 (Q4 only) | 150.21 | 156.87 | 163.05 |
| 2027 | 137.34 | 153.99 | 166.11 |
| 2028 | 131.04 | 150.44 | 169.84 |
| 2029 | 126.27 | 149.39 | 172.50 |
| 2030 | 122.12 | 148.34 | 174.56 |
Behind the path is a rate gap that closes slowly and from both ends. The Federal Reserve raised its target range to 3.75–4.00% on 16 September 2026 and its dot plot put the median at 4.10% for year-end, signalling one more quarter-point move. Two days later the Bank of Japan delivered its own rate hike to 1.25% on a 7–2 vote, its highest policy rate since April 1995. That leaves the two rates 275 basis points apart, a spread Societe Generale expects to narrow by only 25 basis points by mid-2027.
A gap that wide keeps the cost of holding a short yen position high, which is why the pair refused to fall far even after the heaviest official intervention in Japanese history. What changes the arithmetic is direction, not level, and every Japanese hike takes yen away from carry traders and hands it back to the currency. In currency terms, the bottom of the 2030 range near 122 would be a yen roughly a fifth stronger than today; the top near 175 would be a yen weaker than anything since the early 1980s.
USD/JPY forecast 2026
PrimeXBT expects USD/JPY to end 2026 near 156.50, about 80 pips below the late-September rate and a fraction stronger for the yen. Two references frame the call. The 3-month forward sits at 156.10, so our year-end anchor is 0.34% above what the interest-rate differential mechanically implies. The median of the named end-2026 bank calls, running 149 at BofA, 155 at National Bank of Canada, 156 at MUFG, 160 at UBS and 164 at J.P. Morgan, also lands at 156. Sitting on top of both is deliberate: the Fed’s remaining hike is a dated, signalled event, while the Bank of Japan’s next step looks more likely in December than October.
| Month (2026) | Minimum | Average | Maximum |
|---|---|---|---|
| October | 153.75 | 157.12 | 160.49 |
| November | 151.72 | 156.87 | 162.03 |
| December | 150.21 | 156.63 | 163.05 |
USD/JPY forecast 2027
PrimeXBT’s 2027 base case ends the year near 151.50, a little under 600 pips below the late-September 2026 rate and a yen stronger by about 3.7%. For that path to hold, the Bank of Japan has to keep delivering into a domestic inflation rate that is not cooperating: Japanese core inflation ran at 1.7% in August 2026, below the 2% target for a seventh consecutive month, and two board members dissented against the September hike. The Fed, meanwhile, has to stop. If the Fed’s extra hikes arrive and Japan’s do not, the path flips.
| Month (2027) | Minimum | Average | Maximum |
|---|---|---|---|
| January | 148.73 | 156.22 | 163.72 |
| February | 147.40 | 155.82 | 164.24 |
| March | 146.28 | 155.46 | 164.63 |
| April | 145.11 | 155.04 | 164.97 |
| May | 144.02 | 154.63 | 165.23 |
| June | 142.95 | 154.20 | 165.46 |
| July | 141.96 | 153.80 | 165.63 |
| August | 140.97 | 153.37 | 165.78 |
| September | 140.01 | 152.95 | 165.90 |
| October | 139.11 | 152.55 | 165.99 |
| November | 138.20 | 152.13 | 166.06 |
| December | 137.34 | 151.73 | 166.11 |
USD/JPY forecast 2028–2030
PrimeXBT’s base case drifts from 150.44 at the end of 2028 to 148.34 at the end of 2030, a slow strengthening of the yen of roughly 0.7% a year. Past 2027 there is no rate path worth modelling and no calendar to hang a number on. What remains is relative purchasing power parity: the currency of the higher-inflation economy tends to lose ground at about the rate of the inflation difference. US core inflation ran at 2.4% in August 2026 against Japan’s 1.7%, and that gap is the whole engine of the path.
Two things could break it. Japan’s real effective exchange rate stood at 61.99 in July 2026 on the Bank for International Settlements narrow index, the cheapest the yen has ever been in real trade-weighted terms since that series began in 1964, and currencies that undervalued tend to correct abruptly. Pulling the other way is Japan’s fiscal position under Prime Minister Takaichi, whose spending plans have already unsettled the government bond market.
USD/JPY long-term outlook: 2035 and 2040
PrimeXBT’s long-term base case puts USD/JPY near 143 in 2035 and near 138 in 2040, a yen roughly 9% and 12% stronger than today. Both illustrate a method rather than forecast a level: over horizons this long, major exchange rates are empirically close to a random walk with a drift set by the inflation differential, and nobody has reliably beaten that.
| Year | Minimum | Average | Maximum |
|---|---|---|---|
| 2035 | 105.93 | 143.22 | 180.51 |
| 2040 | 93.61 | 138.28 | 182.95 |
Watch what the band does. By 2040 it spans plus or minus 32% around the central value, which is another way of saying the method has stopped carrying information.
What analysts expect for USD/JPY
Fifteen yen separated the lowest and highest published end-2026 call in September 2026, and the disagreement is almost entirely about the Federal Reserve rather than about Japan.
| Source | Forecast | Horizon | Date of call | Change |
|---|---|---|---|---|
| BofA | 149 | end-2026 | 11 September 2026 | cut from 152 on 5 August |
| National Bank of Canada | 155 | Q4 2026 | September 2026 | — |
| MUFG | 156 | Q4 2026 | 1 September 2026 | unchanged from 3 August |
| UBS | 160 | December 2026 | 18 September 2026 | — |
| J.P. Morgan | 164 | Q4 2026 | 1 September 2026 | — |
| Goldman Sachs | 165 | 12 months | 11 September 2026 | raised from 155 on 4 July |
| MUFG | 152 | Q2 2027 | 1 September 2026 | — |
| Westpac | 154 | end-2027 | 17 August 2026 | — |
| Reuters/LSEG FX poll | median 157 | 6 months | published 5 August 2026 | — |
| Market-implied forward | 152.55 | 12 months | 22 September 2026 | — |
The forward rate belongs in a class of its own, because it is not a view. Covered interest parity fixes it from the gap between dollar and yen interest rates, so with US rates far above Japanese ones the dollar is automatically quoted at a discount for future delivery. The 12-month forward of 152.55 is the rate already embedded in the cost of money, and it is the neutral benchmark any forecast should be measured against. A call far from it is a claim needing a reason: Goldman Sachs at 165 is betting roughly twelve yen against the forward on the view that US rates stay high, and BofA at 149 is betting the other way.
Two assumptions generate almost the whole range. The first is whether the Fed delivers the extra hike its own dot plot signals; Citi’s Dan Tobon called the repricing of the Fed path “the most important thing” on 2 September 2026, while BNY’s Vincent Reinhart argued the Fed “will not tighten as much as is currently priced”. The second is whether Japan’s pace holds: MUFG’s Derek Halpenny warned on 17 September that with roughly 90 basis points of Japanese hikes priced over twelve months, a cautious Governor Ueda could send the pair “noticeably higher”, which is what happened when the hike landed with dovish guidance.
The poll medians carry a date for a reason. They come from a survey of around 60 strategists conducted between 31 July and 5 August 2026, before both September decisions, and the September poll released no yen medians. A median from two policy meetings ago is a historical fact, not a current consensus.
Track record
This is the first published edition of PrimeXBT’s USD/JPY forecast, so there is no previous call to check. From the next monthly update onward this section will compare the ranges above against what the pair actually did, and against where the forward rate stood when we wrote them. If our base case turns out worse than the forward, we will say so here.
USD/JPY technical analysis
USD/JPY trades near 157 in late September 2026, below both its 50-day moving average at 159.09 and its 200-day at 158.42, with resistance at 160 and support at 155, all as marked by Scotiabank on 18 September 2026. Sitting under both averages while holding above support describes a pair that has stopped falling without starting to rise.
Round numbers matter more in currencies than elsewhere, because option barriers and stop orders cluster on them, and 160 is the roundest number this pair has. It is also a political boundary rather than a technical one: the Japanese Ministry of Finance spent 15,399.3 billion yen defending the currency between 30 July and 26 August 2026, and on 1 August the US Treasury joined in. A level a finance ministry has spent that much money on behaves differently from resistance. It holds until policy changes, and then it does not hold at all. For this pair the intervention record outranks the chart, and our breakdown of what moves USD/JPY covers the mechanics. On a separate series, Pound Sterling Live records a 2026 high of 163.99 on 23 July and a low of 152.10 on 27 January.
What USD/JPY correlates with
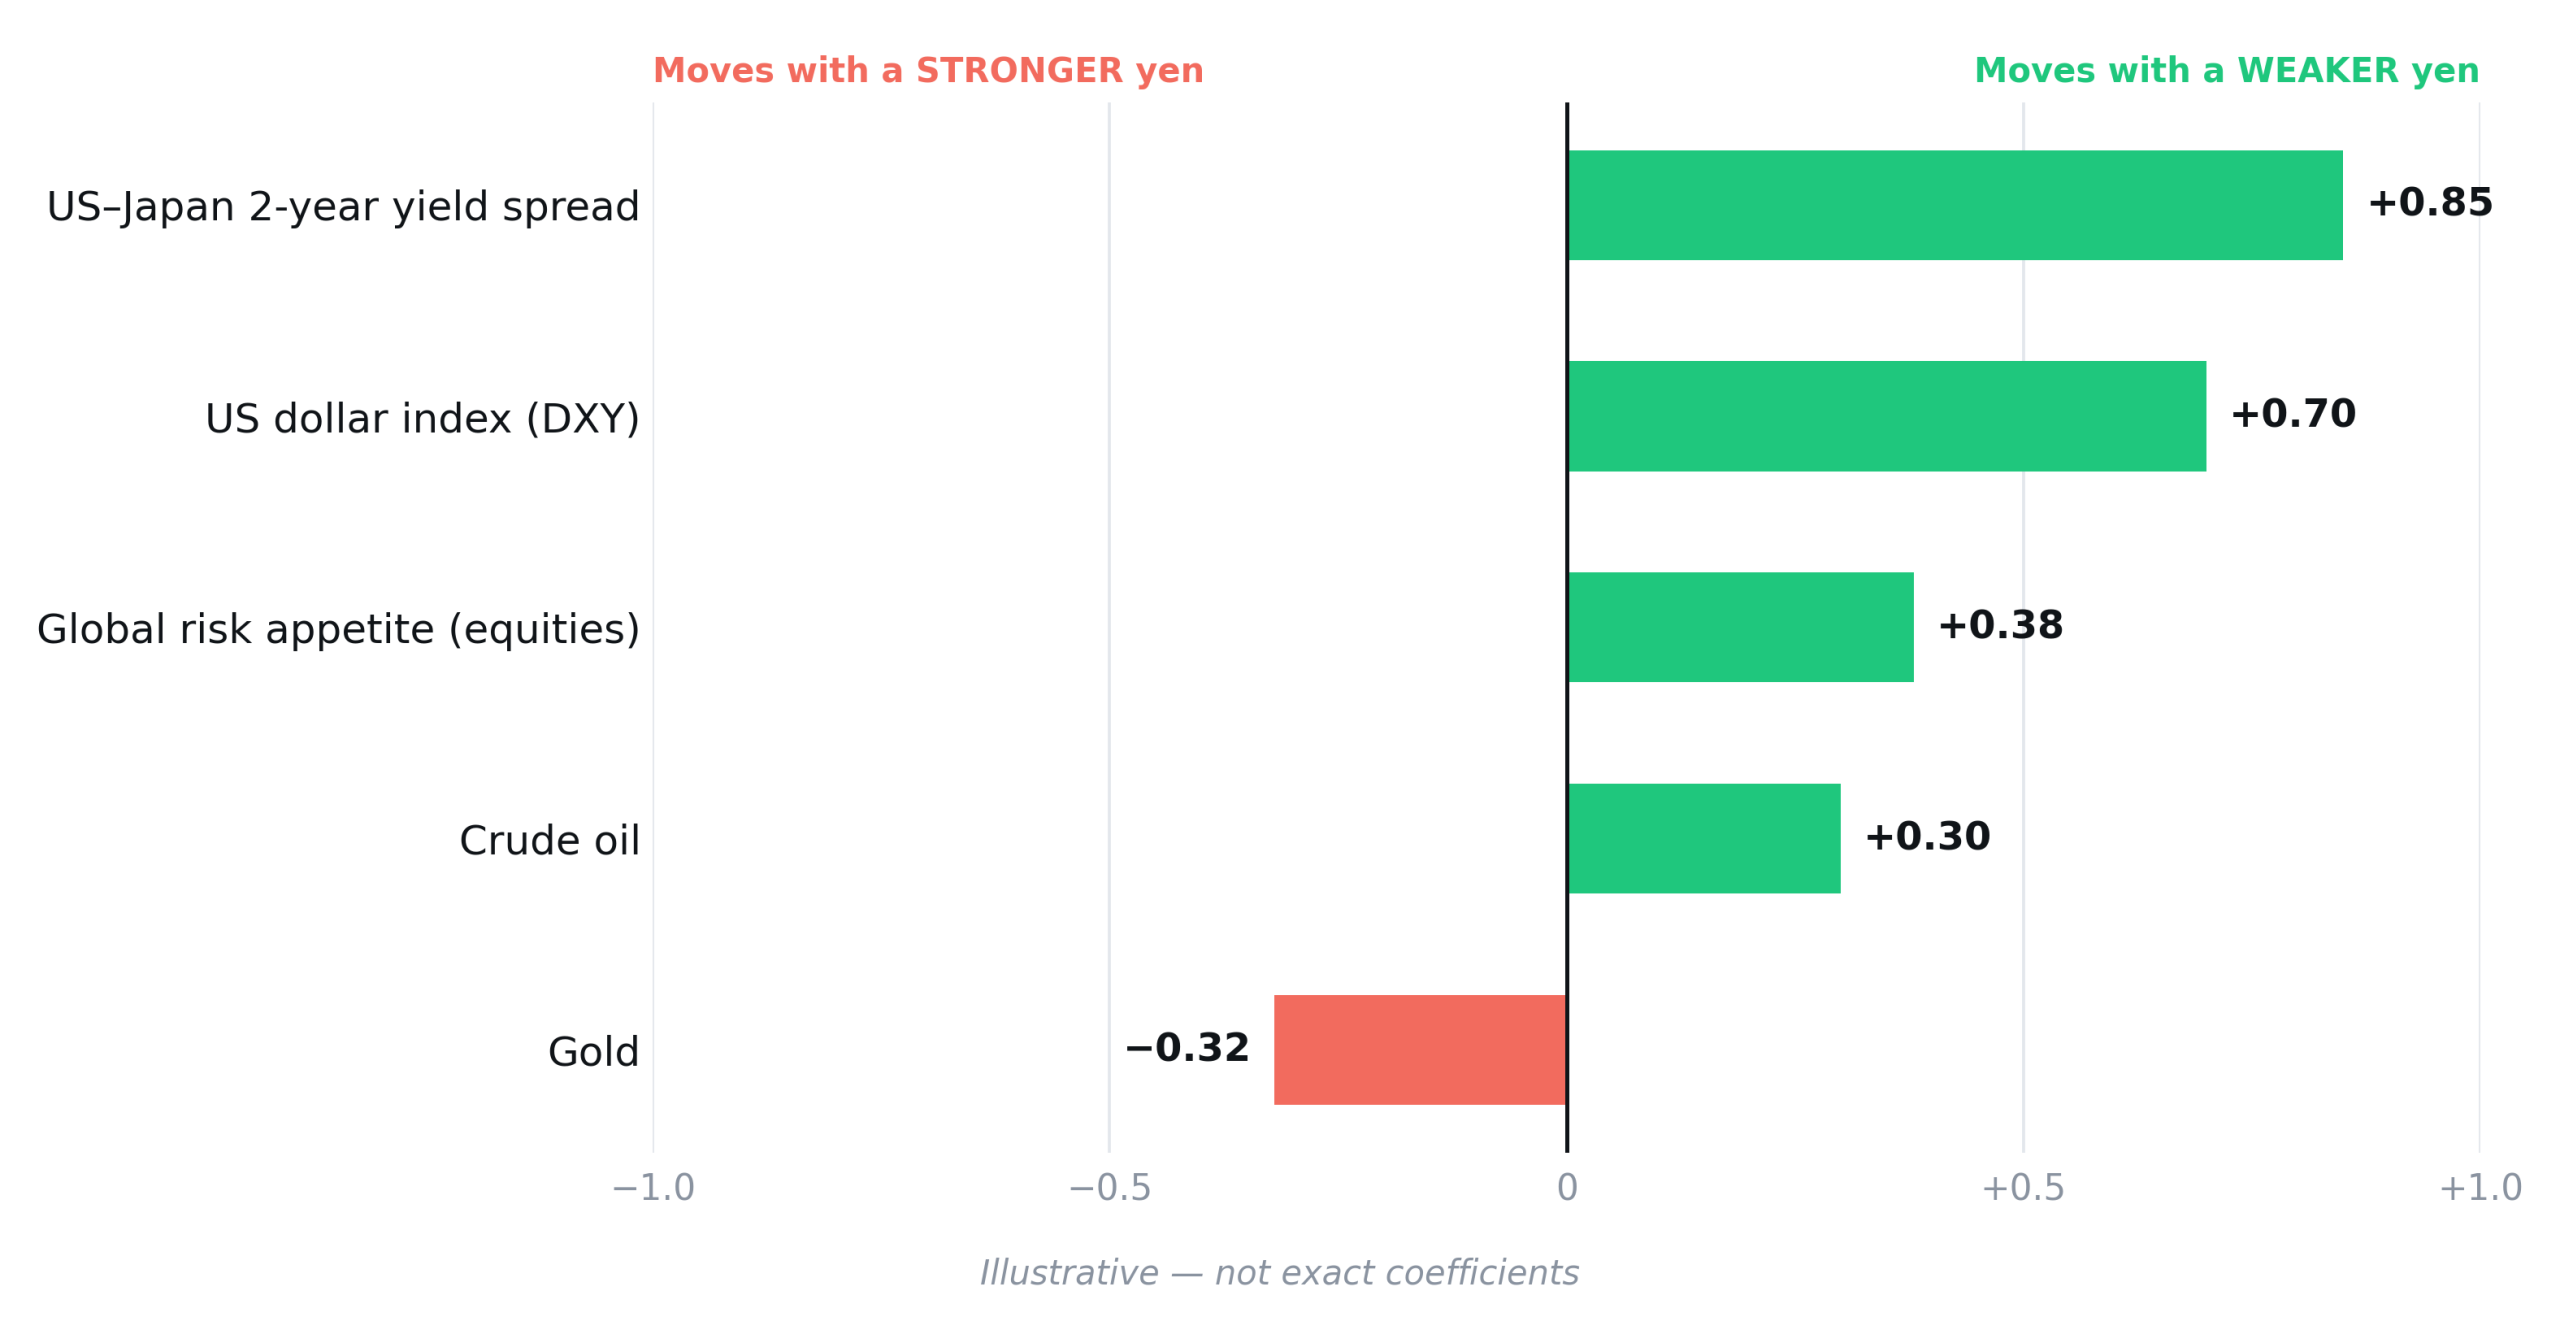
The two-year yield spread between US Treasuries and Japanese government bonds explains more of this pair’s movement than anything else, and it moves before the exchange rate does whenever the market reprices how much more the Fed will do relative to the Bank of Japan.
The yen is the second-largest component of the dollar index, far behind the euro, so USD/JPY and DXY track each other by construction as much as by economics. Useful as a sanity check, not as a signal. Risk appetite is the more interesting relationship: the yen has funded leveraged positions across other markets for years, so a sharp fall in equities forces those positions shut and pushes the yen higher for reasons unrelated to Japan. Energy works the other way, because Japan imports nearly all of its fuel. None of these hold at a fixed strength; they tighten when one story dominates and fall apart when several compete.
What drives USD/JPY
The policy rate gap and its direction. At 275 basis points the spread is what makes a short yen position profitable to hold, but the market trades the change rather than the level. Reuters’ 9 September survey of 68 economists found 89% expecting a Japanese policy rate of at least 1.50% by the end of March 2027, a faster path than they had penned in August. The Fed’s September dot plot put its own median at 4.10% for both end-2026 and end-2027, a plateau rather than the cuts that would close the gap from above.
The inflation gap. US CPI ran at 3.4% in August 2026 with core at 2.4%; Japan’s was 1.9% with core at 1.7%. That difference sets the long-run drift and argues for a slowly stronger yen. It is also the Bank of Japan’s problem, because inflation under target for seven straight months makes every further hike harder to justify at home.
The current account, and why it stopped helping. Japan ran a current account surplus of 17.43 trillion yen in the first half of 2026 and a record 34.52 trillion yen in fiscal 2025. A surplus that size should support the currency. It has not, because the surplus is now overwhelmingly primary income, returns on foreign assets that Japanese companies largely leave invested abroad. A surplus earned in dollars and kept in dollars buys no yen.
Intervention and its limits. The August operation was extraordinary in every dimension: a record monthly total, and the first time since 1998 that the US Treasury bought yen alongside Japan. It bought a 1.4% rally to 155.20 and a period of calm. It did not change the rate gap, and the pair was back above 157 within seven weeks. Around 95% of the strategists Reuters polled in early August said intervention alone would not sustainably curb the yen’s weakness, and Commerzbank’s Thu Lan Nguyen put it plainly on 22 September: the Bank of Japan will have to back the words with action. PrimeXBT covered the coordinated intervention when it happened.
Positioning. CFTC data show speculative accounts swinging from a net short of 92.2K contracts on 4 September to a net long of 120.4K by 18 September. Readings that extreme say more about how crowded a trade has become than about where it goes next, and the series covers only exchange-traded futures.
Upcoming catalysts for USD/JPY
| Date | Event | Leg | Potential impact |
|---|---|---|---|
| 27–28 October 2026 | FOMC meeting (no projections) | USD | First of two 2026 meetings that could deliver the signalled hike |
| 29–30 October 2026 | Bank of Japan meeting, Outlook Report | JPY | Updated inflation projections; the main test of the faster-tightening case |
| 8–9 December 2026 | FOMC meeting with projections | USD | New dot plot sets the 2027 rate path |
| 17–18 December 2026 | Bank of Japan meeting | JPY | The meeting economists most often name for a move to 1.50% |
| 21–22 January 2027 | Bank of Japan meeting, Outlook Report | JPY | First full projections for fiscal 2027 |
| 26–27 January 2027 | FOMC meeting | USD | First read on the Fed’s 2027 stance |
| Monthly, end of month | Ministry of Finance intervention data | JPY | Confirms or rules out official action in the prior month, with a lag |
| Date not yet confirmed | US and Japan CPI releases | Both | Moves the inflation gap that anchors the long-run path |
Only confirmed, dated events are listed. The economic calendar carries the full schedule for both legs.
The case for a stronger yen and the case for a stronger dollar
The case for a stronger yen
- The Bank of Japan is tightening faster than expected. Economists brought their 1.75% call three months forward between the August and September Reuters surveys, and UBS on 18 September put the terminal rate at 1.75%.
- The forward curve already leans this way. At 152.55 for twelve months, the market has priced a stronger yen without anyone forecasting one.
- The yen has never been cheaper in real trade-weighted terms, at 61.99 on the BIS narrow index in July 2026.
- Washington is now an active participant. Secretary Bessent said the US “will not hesitate to participate in further joint intervention”.
The case for a stronger dollar
- The Fed is still raising rates. At the September meeting, 16 of 18 policymakers expected at least one more quarter-point move by the end of 2026.
- Carry still pays, and Societe Generale expects only 25 basis points of narrowing in the 275-basis-point gap by mid-2027.
- Japanese inflation is undershooting. Core at 1.7% for a seventh month below target, with two dissenting board members, is a weak base for a sustained tightening cycle.
- Fiscal expansion under the Takaichi government is pressuring the Japanese government bond market, and a fiscal risk premium works against the currency.
The case for a stronger yen weakens on a sustained close above 160. The case for a stronger dollar is invalidated on a sustained close below 155. Both levels are Scotiabank’s, marked on 18 September 2026.
Will the yen get stronger in 2026?
Probably a little, and much less than the July panic implied. PrimeXBT’s base case has the yen ending 2026 about half a percent stronger than in late September, and the forward market has it about 3% stronger over twelve months. Neither is a recovery. Both are the arithmetic of an interest-rate gap narrowing slowly.
History argues against expecting more. On Pound Sterling Live annual averages, the dollar bought more yen in eight of the thirteen years from 2013 to 2025 than in the year before. The two largest single-year moves on record went against the yen, roughly 24% in 1979 and roughly 22% in 2013; a move of that size in the yen’s favour would have no precedent in the modern floating era. The sceptics are not fringe either. Goldman Sachs raised its twelve-month forecast to 165 on 11 September 2026 and Morgan Stanley put fair value at 165 to 167 on 18 August, both on the point that nothing about Japanese inflation forces the Bank of Japan to match the Fed.
Can USD/JPY go back to 160?
It can, and two named houses expect it to. UBS has 160 for December 2026 and J.P. Morgan has 164 for the fourth quarter, both on the view that the Fed keeps tightening. The pair traded as high as 163.99 in July 2026, so the level is a few weeks of drift away rather than a structural break.
What stands between here and there is not the chart. It is the Japanese Ministry of Finance, which spent 15,399.3 billion yen in a month to prevent exactly that, and the US Treasury, which said it would help again. For USD/JPY to settle above 160 and stay there, the market would have to conclude that the rate gap will not close and that the two treasuries will not act. July showed how fast official selling can move the pair; the seven weeks after showed how fast the move fades when the rate gap is unchanged.
USD/JPY historical performance
The dollar has bought steadily more yen for most of the past fourteen years. Annual averages on Pound Sterling Live data ran 80.02 in 2012, 108.75 in 2016, 106.76 in 2020, 131.52 in 2022, 151.46 in 2024 and 149.65 in 2025, with 2026 to date averaging 158.57. Two bursts of yen weakness dominate: the 2013 collapse under the first wave of Japanese monetary easing, and the 2022 to 2024 stretch when the Fed raised rates and the Bank of Japan did not.
Two cautions. A change in the exchange rate is not a return on a position, because a trader holding USD/JPY through those years also paid or earned the overnight interest differential every night, and in a pair with a gap this wide that financing can rival the price move itself. The nominal series also flatters the story: in real trade-weighted terms the yen’s decline is deeper than the exchange rate alone shows, because Japanese inflation has been lower throughout.
Is USD/JPY a good pair to trade in 2026?
A currency pair is not an investment, and USD/JPY is not something to hold the way you would hold an asset. Nobody’s savings grow because the yen weakens. What a CFD position offers, explained in full in our guide to CFDs and forex, is short to medium-term exposure to the rate differential between two economies, with leverage, an overnight financing cost, and the risk of losing the capital committed to it.
As a trading instrument the pair has real advantages. It is among the most liquid in the market, with the yen on one side of 16.8% of global turnover on Bank for International Settlements data, which keeps the spread tight in normal conditions, and the London and New York overlap produces the largest moves. One pip here is 0.01, not 0.0001, which trips up traders arriving from EUR/USD. The drawbacks are specific: overnight financing is asymmetric while the rate gap is this wide, spreads widen around Bank of Japan announcements, and this is the one major where a finance ministry may intervene without warning.
How to trade USD/JPY on PrimeXBT
Forex CFDs on PrimeXBT let you take a long or a short position on USD/JPY, independent of which way this forecast points. Trading runs around the clock five days a week, which means the pair can gap at the Monday open on news that broke over the weekend.
Leverage magnifies gains and losses alike, so position sizing and a stop-loss matter more than the entry. Never risk more than you can afford to lose. Overnight financing applies in both directions and is worth checking in the conditions before holding a position for weeks. Traders new to currency markets can start with our guide to forex trading or the USD/JPY trading guide, and open the pair in the web terminal. Day-to-day context sits in forex news, and the wider series lives on our price prediction hub.
Trading involves risk.
How we build this forecast
PrimeXBT’s USD/JPY forecast starts from the interest-rate differential between the Federal Reserve and the Bank of Japan and its expected path, then checks every figure against the forward curve, the rate the market has already locked in through the cost of money. Our near-term anchors sit within a fraction of a percent of the 3-month and 12-month forwards, and where they deviate we say why. Beyond two years the path follows the relative inflation differential, taken as 0.7 percentage points a year from August 2026 core CPI on both legs. The uncertainty bands come from the pair’s own volatility, using a one-year figure of 9.5%. Named bank targets and the Reuters/LSEG poll are shown separately rather than blended in. This is a forecast, not a prediction: it is uncertain, it will be wrong in places, and it is reviewed every month.
What will USD/JPY be in 2026?
PrimeXBT's base case puts USD/JPY near 156.50 at the end of 2026, within a range of roughly 150.21 to 163.05 across the final quarter, which would leave the yen marginally stronger than in late September 2026. Named bank calls for year-end run much wider, from 149 at BofA to 164 at J.P. Morgan, and the 12-month forward rate sits at 152.55.
What will USD/JPY be in 2030?
PrimeXBT's base case centres on 148.34 at the end of 2030, within a range of 122.12 to 174.56. At that horizon the forecast rests on the inflation difference between the United States and Japan rather than on any rate decision.
How much does USD/JPY typically move in a year?
A lot, by major-currency standards. The 2026 calendar year so far has spanned 152.10 to 163.99 on Pound Sterling Live data, a range of nearly 12 yen. The largest single-year moves on record were sharper still: the yen weakened around 24% in 1979 and around 22% in 2013.
Can USD/JPY reach 160?
Yes. The pair traded as high as 163.99 in July 2026, and two named houses forecast 160 or above for the fourth quarter: UBS at 160 for December and J.P. Morgan at 164. Getting there needs the Federal Reserve to keep raising rates while the Bank of Japan slows down. Standing against it is the Japanese Ministry of Finance, which spent 15,399.3 billion yen defending the currency in a single month in 2026, joined by the US Treasury.
What is the USD/JPY forecast for today or this week?
This page gives no daily or weekly forecasts. It is reviewed once a month, and a rate that moves on every central bank comment cannot honestly be called a day ahead on a page updated that rarely. For same-day context, follow the forex news section and the live chart.
Is USD/JPY a good pair to trade?
It is among the most liquid pairs in the market, which usually keeps spreads tight. One pip is 0.01 rather than 0.0001, so position sizing works differently from EUR/USD, and overnight financing is asymmetric while US and Japanese interest rates are this far apart. A currency pair is not an investment, and a CFD position in it carries the risk of losing the capital committed.
What moves USD/JPY the most?
The gap between US and Japanese interest rates, and more precisely the market's view of how that gap will change. The two-year yield spread between US Treasuries and Japanese government bonds tracks the pair more closely than any other single variable. After that come risk appetite, because the yen funds leveraged positions elsewhere, and official intervention by the Japanese Ministry of Finance.
Why does the forward rate differ from the forecast?
The forward rate is not a prediction. Covered interest parity fixes it from the difference between dollar and yen interest rates, and because dollar rates are much higher the dollar is quoted at a discount for future delivery, which makes the 12-month forward lower than spot automatically. A forecast is a view about where the market will actually go; the forward is the neutral benchmark that view should be measured against.
Will Japan intervene again to support the yen?
The Ministry of Finance spent 15,399.3 billion yen between 30 July and 26 August 2026, and the US Treasury bought yen alongside it on 1 August for the first time since 1998. Treasury Secretary Bessent said Washington would not hesitate to join further joint action. Around 95% of the strategists Reuters polled in early August said intervention on its own would not sustainably curb the currency's decline without a change in the underlying interest-rate gap.
Author



 Risk Disclaimer
The content provided here is for informational purposes only. It is not intended as personal investment advice and does not constitute a solicitation or invitation to engage in any financial transactions, investments, or related activities. Past performance is not a reliable indicator of future results.
The financial products offered by the Company are complex and come with a high risk of losing money rapidly due to leverage. These products may not be suitable for all investors. Before engaging, you should consider whether you understand how these leveraged products work and whether you can afford the high risk of losing your money.
The Company does not accept clients from the Restricted Jurisdictions as indicated in our website/ T&C. Some services or products may not be available in your jurisdiction.
The applicable legal entity and its respective products and services depend on the client’s country of residence and the entity with which the client has established a contractual relationship during registration.