
 14 min read
 Amp (AMP) trades around $0.0005 in late August 2026, only just above the all-time low it printed on August 19. AMP is an Ethereum-based ERC-20 token that works as collateral for the Flexa payments network: holders stake it into collateral pools that back merchant transactions in real time while those payments wait for on-chain confirmation, and earn rewards for doing so. That single job — insuring settlement risk — is what gives the token its demand, and it also caps how far a price story can run without real payment volume behind it. This page lays out PrimeXBT’s outlook for AMP through 2030 and out to 2050, the levels traders are watching now, and the catalysts that could move it. Figures are shown as ranges, and where the evidence is thin, the text says so rather than inventing precision.
Amp outlook at a glance
- 2026 base case: $0.00043–$0.00059, a year of stabilization near current levels rather than a breakout.
- Main bullish catalyst: Federal Reserve rate cuts reviving small-cap risk appetite, paired with Flexa merchant and collateral-pool growth turning into genuine AMP demand.
- Biggest downside risk: a sustained break below the $0.00036 August all-time low, with higher-for-longer Fed policy draining liquidity from micro-cap alts first.
- Long-term view: a slow, adoption-led recovery is the base case, but every figure past 2030 reads as a directional scenario, not a target.
Live Amp price chart
The live chart below tracks Amp (AMP/USD) in real time; the price right now sits at the top of the chart, and the levels worth watching are set out in the technical section further down.
Trading involves risk.
Amp price prediction 2026–2030 (yearly forecast)
The table below sets PrimeXBT’s expected range for each year. It reads as a shallow recovery that tops out around 2028 and then gives part of it back, with the whole path staying far below AMP’s 2021 record. The wide outlier forecasts from third-party models are handled separately in the analyst section, not blended in here.
| Year | Minimum | Average | Maximum |
|---|---|---|---|
| 2026 | $0.00043 | $0.00050 | $0.00059 |
| 2027 | $0.00049 | $0.00075 | $0.00114 |
| 2028 | $0.00085 | $0.00114 | $0.00147 |
| 2029 | $0.00061 | $0.00091 | $0.00127 |
| 2030 | $0.00052 | $0.00078 | $0.00102 |
Amp price prediction 2026
PrimeXBT’s 2026 outlook keeps AMP close to its late-August level near $0.0005, in a range of $0.00043–$0.00059 and averaging near $0.00050. The token has just set a fresh all-time low, sentiment on it is weak, and nothing in the current picture argues for a sharp move in either direction before year-end. This is a base-building year, not a trend.
| Month (2026) | Minimum | Average | Maximum |
|---|---|---|---|
| August | $0.00043 | $0.00048 | $0.00053 |
| September | $0.00044 | $0.00049 | $0.00054 |
| October | $0.00045 | $0.00050 | $0.00055 |
| November | $0.00046 | $0.00052 | $0.00057 |
| December | $0.00047 | $0.00053 | $0.00059 |
Amp price prediction 2027
2027 is where a recovery could take shape. PrimeXBT models a climb across the year to a full-year range of $0.00049–$0.00114, averaging near $0.00075. The move rests on two things arriving together: a friendlier macro backdrop and measurable growth in Flexa’s collateral pools, since without more payment volume the token has little to price in beyond broad-market beta.
| Month (2027) | Minimum | Average | Maximum |
|---|---|---|---|
| January | $0.00049 | $0.00056 | $0.00063 |
| February | $0.00052 | $0.00059 | $0.00066 |
| March | $0.00054 | $0.00062 | $0.00070 |
| April | $0.00056 | $0.00065 | $0.00073 |
| May | $0.00059 | $0.00068 | $0.00077 |
| June | $0.00061 | $0.00071 | $0.00080 |
| July | $0.00064 | $0.00074 | $0.00085 |
| August | $0.00068 | $0.00079 | $0.00091 |
| September | $0.00071 | $0.00084 | $0.00096 |
| October | $0.00075 | $0.00089 | $0.00102 |
| November | $0.00079 | $0.00093 | $0.00108 |
| December | $0.00082 | $0.00098 | $0.00114 |
Amp price prediction 2028
2028 holds the high of this cycle in PrimeXBT’s view. The path peaks mid-year before easing, for a range of $0.00085–$0.00147 and an average near $0.00114 — roughly where AMP’s 200-day moving average sat in mid-2026, which makes reclaiming that zone the pivotal test of whether the recovery is real. Even at the top of this range, AMP would remain more than 98% below its 2021 record.
| Month (2028) | Minimum | Average | Maximum |
|---|---|---|---|
| January | $0.00085 | $0.00102 | $0.00119 |
| February | $0.00088 | $0.00106 | $0.00124 |
| March | $0.00091 | $0.00110 | $0.00130 |
| April | $0.00094 | $0.00115 | $0.00135 |
| May | $0.00097 | $0.00119 | $0.00140 |
| June | $0.00100 | $0.00123 | $0.00146 |
| July | $0.00100 | $0.00123 | $0.00147 |
| August | $0.00097 | $0.00120 | $0.00144 |
| September | $0.00094 | $0.00117 | $0.00140 |
| October | $0.00091 | $0.00114 | $0.00137 |
| November | $0.00088 | $0.00111 | $0.00134 |
| December | $0.00086 | $0.00108 | $0.00130 |
Amp price prediction 2029
2029 cools off after the peak. PrimeXBT expects a gradual slide rather than a crash, with a range of $0.00061–$0.00127 and an average near $0.00088. Small-cap tokens tend to bleed value in the year after a cycle top as speculative flows rotate out, and AMP has less structural demand to cushion that than larger assets do.
| Month (2029) | Minimum | Average | Maximum |
|---|---|---|---|
| January | $0.00083 | $0.00105 | $0.00127 |
| February | $0.00080 | $0.00102 | $0.00124 |
| March | $0.00077 | $0.00099 | $0.00120 |
| April | $0.00074 | $0.00096 | $0.00117 |
| May | $0.00072 | $0.00093 | $0.00114 |
| June | $0.00069 | $0.00090 | $0.00110 |
| July | $0.00067 | $0.00087 | $0.00108 |
| August | $0.00066 | $0.00086 | $0.00107 |
| September | $0.00065 | $0.00085 | $0.00106 |
| October | $0.00063 | $0.00084 | $0.00105 |
| November | $0.00062 | $0.00083 | $0.00104 |
| December | $0.00061 | $0.00082 | $0.00103 |
Amp price prediction 2030
The 2030 view spans $0.00052–$0.00102, averaging near $0.00078. Five years out, the honest read is a shape rather than a schedule: the direction depends on whether Flexa is settling meaningfully more payment volume by then, and that is a bet on adoption more than on charts. Treat the month-by-month figures below as a trajectory.
| Month (2030) | Minimum | Average | Maximum |
|---|---|---|---|
| January | $0.00060 | $0.00081 | $0.00102 |
| February | $0.00060 | $0.00081 | $0.00102 |
| March | $0.00059 | $0.00080 | $0.00101 |
| April | $0.00058 | $0.00080 | $0.00101 |
| May | $0.00057 | $0.00079 | $0.00100 |
| June | $0.00057 | $0.00078 | $0.00100 |
| July | $0.00056 | $0.00078 | $0.00100 |
| August | $0.00055 | $0.00077 | $0.00099 |
| September | $0.00055 | $0.00077 | $0.00099 |
| October | $0.00054 | $0.00076 | $0.00098 |
| November | $0.00053 | $0.00076 | $0.00098 |
| December | $0.00052 | $0.00075 | $0.00098 |
Amp long-term price prediction: 2035, 2040–2050
Numbers this far out are best read as scenarios with very wide error bars. No model can price a decade of Flexa adoption, ERC-20 competition, and macro cycles that have not happened yet, so the figures below trace a slow upward drift rather than a promise, and the uncertainty grows with every year added. On that basis PrimeXBT’s long-range path climbs gradually without ever pretending AMP retraces its old peak:
| Year | Minimum | Average | Maximum |
|---|---|---|---|
| 2035 | $0.00069 | $0.00105 | $0.00141 |
| 2040 | $0.00090 | $0.00150 | $0.00210 |
| 2050 | $0.00125 | $0.00240 | $0.00355 |
What analysts and models say (compared)
Third-party AMP forecasts disagree more than they agree, which is the most useful thing about them. Algorithmic models cluster in the sub-$0.0005 zone for 2026 and mostly project decline into 2030; one editorial forecast sees mild growth; and one model prints figures orders of magnitude above the rest. Averaging outputs built on incompatible assumptions would mislead, so they sit side by side instead.
| Source | Method | AMP view |
|---|---|---|
| CoinCodex | Algorithmic | 2026 avg ~$0.00039; declines to ~$0.00009 by 2030 |
| Changelly | Algorithmic | 2026 avg ~$0.00043; declines to ~$0.00008 by 2030 |
| CoinDataFlow | Algorithmic | ~$0.00043 through 2026 |
| Cryptonews | Editorial roundup | 2026 avg ~$0.00043; ~$0.00081 by 2030; bullish 2040 case |
| DigitalCoinPrice | Algorithmic | ~$0.03 in 2026 rising past $0.05 by 2030 (extreme outlier) |
The spread is the point. CoinCodex and Changelly both extrapolate the recent downtrend and see AMP roughly halving every year or two into the decade. Cryptonews leans on Flexa’s payment thesis and pencils in slow appreciation instead. DigitalCoinPrice’s numbers sit around sixty times current price for 2026 alone, which no other model, and no read of AMP’s liquidity, supports. Anyone looking for a clean consensus on this token will not find one.
Track record of this forecast
This is the first AMP price forecast PrimeXBT has published. Starting with the next monthly review, this section will hold the previous forecast against AMP’s actual price on the update date and account for any gap plainly, rather than quietly re-drawing the target.
Amp technical analysis
As of mid-August 2026, AMP trades below both of its most-watched moving averages. It sits under the 200-day simple moving average near $0.00094 — a sign the longer trend is still down — and around the 50-day average near $0.00043, so it has not even reclaimed the shorter-term line convincingly. The RSI printed close to 29 in mid-August, in oversold territory, which fits a token that just tagged a record low.
The support and resistance levels that matter now: support at the August all-time low near $0.00036, with the 50-day line at $0.00043 acting as the first hurdle above spot; resistance then runs at the recent local high near $0.00062, and more importantly at the 200-day average near $0.00094, a reclaim of which would be the clearest evidence the downtrend has broken. Broad-market sentiment tells a split story — the crypto Fear & Greed Index sat around 73 (Greed) in late August even as AMP itself traded oversold, a gap that often marks a small-cap lagging the majors. For the mechanics behind these signals, see PrimeXBT’s guide to crypto technical analysis.
Correlation with other assets
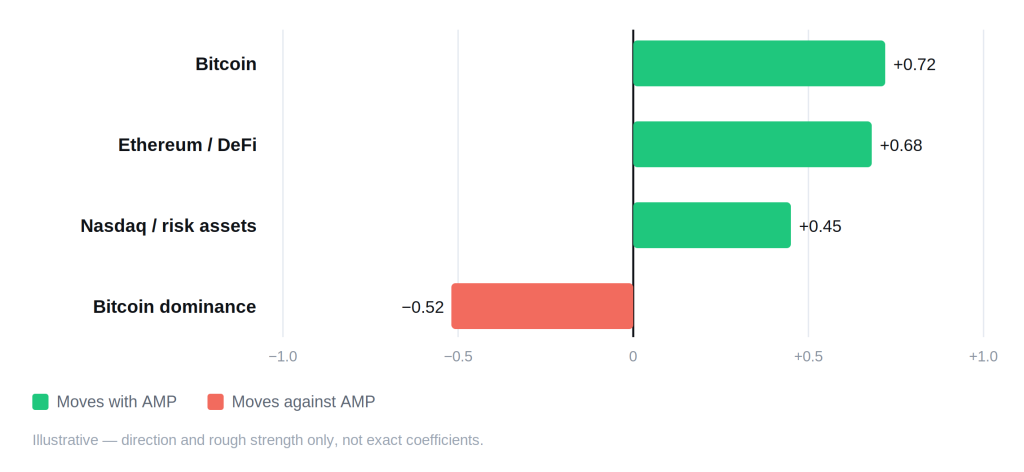
Amp behaves like a high-beta expression of the broader crypto market rather than an asset with its own gravity. When Bitcoin and Ethereum rise, a micro-cap like AMP tends to rise faster; when they fall, it falls harder, because thin liquidity magnifies every move. Its tie to Ethereum and the wider DeFi complex is close, given AMP is an ERC-20 collateral asset that lives or dies by on-chain activity. It also tracks risk assets such as the Nasdaq, which is why Fed policy reaches it quickly. The one relationship that runs the other way is Bitcoin dominance: when capital crowds into Bitcoin, small alts like AMP are usually the first to be sold. What sets AMP slightly apart is that a genuine Flexa adoption headline can briefly pull it out of lockstep with the majors, though those decouplings rarely last. None of these are fixed coefficients; they drift with liquidity and market regime.
Fundamental factors
AMP launched in September 2020, replacing the earlier FlexaCoin (FXC) at a 1:1 migration, and was built through a collaboration between Flexa, a New York payments company founded in 2018, and ConsenSys. Its purpose is narrow and specific: AMP is collateral. Stakers lock it into pools that guarantee Flexa merchant payments during the seconds a transaction waits for confirmation, and in exchange they collect a share of network fees. The token also carries a governance role in the Amp community. That utility is real, but it is also the ceiling — AMP’s demand scales with how much value Flexa actually settles, not with hype.
Supply is the other half of the story. AMP has a maximum of 100 billion tokens, with roughly 89.8 billion circulating in August 2026, so most of the supply is already live and dilution is not the overhang it is for younger tokens. Market cap sits near $40–50 million, which places AMP firmly in micro-cap territory: easy to move on modest flows, and dependent on broad crypto risk appetite for direction. The investment case rests almost entirely on whether crypto-linked payments find real traction and whether Flexa captures a meaningful slice of that — a payments-adoption bet with modest traction so far, not a settled growth story. For context on where a token like this fits, see PrimeXBT’s overview of the types of cryptocurrencies.
Upcoming catalysts
Only confirmed, dated events are listed. For a micro-cap that trades on risk appetite, macro policy is the clearest near-term driver; AMP-specific catalysts like new collateral pools rarely come with fixed dates and so are not tabled here.
| Date | Event | Potential impact |
|---|---|---|
| September 15–16, 2026 | FOMC meeting (with economic projections) | Bull if the Fed signals cuts; bear if it holds rates higher for longer |
| October 27–28, 2026 | FOMC meeting | Rate path steers risk appetite, which micro-caps feel first |
| December 8–9, 2026 | FOMC meeting (with economic projections) | Year-end policy signal that frames 2027 positioning |
FOMC dates follow the Federal Reserve’s published 2026 schedule. Flexa network milestones are omitted because none carries a confirmed public date at the time of writing, and an estimated date would be a guess rather than information.
Bull case vs bear case
Bull case:
- The Fed pivots to cuts and liquidity rotates back down the risk curve into micro-caps.
- Flexa signs merchants and spins up new collateral pools, converting narrative into actual staking demand for AMP.
- A broad crypto upcycle lifts high-beta alts disproportionately, and AMP amplifies the move.
- Most of the supply is already circulating, so a demand pickup meets limited fresh dilution.
Bear case:
- Rates stay higher for longer and speculative liquidity avoids the smallest tokens.
- Flexa adoption stalls, leaving AMP with little demand beyond broad-market beta.
- AMP keeps trading below its 200-day average, and algorithmic models extend their decline forecasts.
- The August all-time low fails to hold, opening room to fresh lows.
Invalidation levels. The bull case loses its footing if AMP closes decisively below the $0.00036 August low, since that would confirm the downtrend rather than a base. The bear case is invalidated on a sustained reclaim of the 200-day average near $0.00094 — roughly double the late-August price, and the line that would mark the multi-year downtrend as broken. Between them, the 50-day average near $0.00043 is the nearer tell of short-term momentum.
Historical performance
AMP’s chart is a single boom and a long fade. It ran to a record near $0.12 in June 2021 during the last bull market, then spent the following years grinding lower, and by August 2026 it had set a fresh all-time low near $0.00036 — more than 99% beneath that peak. The token has never reclaimed its old highs, and its recovery attempts have been shallow and short. That history argues for treating any rebound as cyclical until proven otherwise, not as a return to 2021.
Is Amp a good investment in 2026?
AMP is a leveraged bet on two things at once: a broad crypto recovery, and Flexa turning crypto payments into real settlement volume. PrimeXBT’s outlook sees the token roughly flat into year-end, averaging near $0.00050, with the sharper upside deferred to a possible 2027–2028 recovery that still leaves it far below its record. The facts underneath are plain: AMP trades near all-time lows, below both key moving averages, with real but narrow utility and a micro-cap’s sensitivity to market swings. Whether that reads as a discounted option or a value trap depends on how much weight a reader puts on Flexa’s adoption curve. Position sizing matters more here than on larger, more liquid coins. PrimeXBT’s guide to volatility is worth a read before taking a view.
How to trade Amp on PrimeXBT
Amp is not currently listed on PrimeXBT, but the platform lets you take a position on a wide range of crypto markets in either direction. CFDs can be traded long or short, so a trader can express a bearish or bullish view without owning the underlying token. Leverage magnifies gains and losses alike, which is why position sizing and a stop-loss carry more weight than any forecast. Trade on your own analysis and risk tolerance, and never risk more than you can afford to lose.
Trading involves risk.
How we build this forecast
PrimeXBT’s analysts assemble this outlook rather than lifting it from one price feed. The starting point is where AMP trades today, read against its 50- and 200-day moving averages and the support and resistance levels that frame the current range. On top of that sits the fundamental picture — Flexa’s collateral mechanics, staking demand, and AMP’s fixed micro-cap supply — and the macro backdrop, chiefly the path of U.S. interest rates that governs appetite for the smallest tokens. The yearly ranges fuse that technical read with the fundamental and macro view; the long-range figures lean on trajectory rather than precision.
None of this is a guarantee. AMP is a thin, high-beta token, its inputs shift quickly, and a single adoption headline or macro surprise can move it faster than any model expects. Read every number here as a considered estimate, not a promise — PrimeXBT revisits and updates the outlook monthly as the data changes.
How much will Amp be worth in 2026?
PrimeXBT's outlook is $0.00043–$0.00059 for 2026, averaging near $0.00050 — essentially a base-building year near current levels.
How much will Amp be worth in 2030?
The 2030 view is $0.00052–$0.00102, averaging near $0.00078. On a five-year horizon, read that as a direction set by Flexa adoption, not a fixed target.
Will Amp reach $0.01?
Not on PrimeXBT's numbers. At $0.01, AMP's roughly 89.8 billion circulating tokens would carry a market cap near $900 million — around twenty times the current $40–50 million — which would require a sustained jump in Flexa settlement volume well beyond anything visible today. The top of PrimeXBT's modeled range is about $0.0014 in mid-2028. Reclaiming the 2021 high near $0.12 would imply a market cap above $10 billion, which the current picture does not support.
What is Amp used for?
AMP is the collateral token for the Flexa payments network. Holders stake it into pools that guarantee merchant transactions while they wait for confirmation, and earn a share of network fees in return. It is an Ethereum-based ERC-20 token with a maximum supply of 100 billion.
Author



 Risk Disclaimer
The content provided here is for informational purposes only. It is not intended as personal investment advice and does not constitute a solicitation or invitation to engage in any financial transactions, investments, or related activities. Past performance is not a reliable indicator of future results.
The financial products offered by the Company are complex and come with a high risk of losing money rapidly due to leverage. These products may not be suitable for all investors. Before engaging, you should consider whether you understand how these leveraged products work and whether you can afford the high risk of losing your money.
The Company does not accept clients from the Restricted Jurisdictions as indicated in our website/ T&C. Some services or products may not be available in your jurisdiction.
The applicable legal entity and its respective products and services depend on the client’s country of residence and the entity with which the client has established a contractual relationship during registration.








