7 min read
 Key takeaways
- Bitcoin pushed up to the $65,555 resistance area after a much softer than expected June inflation print, before printing a daily indecision candle and turning lower.
- A soft June CPI and a soft June PPI have unwound the near-term Fed rate-hike trade, easing the dollar and Treasury yields and supporting risk appetite.
- Japan’s parliament passed a landmark bill reclassifying crypto as financial instruments, opening a path to spot Bitcoin ETFs, although the change is not due to take effect until 2027.
- Price is now testing $64,000 support. A hold could keep the structure constructive, while a failure could open the range lows toward the $60,000 to $62,400 band.
The macro backdrop
The backdrop behind Bitcoin’s move has shifted, and the shift is mostly about the Fed. June CPI, released on Tuesday, came in far softer than expected. Headline prices fell 0.4% on the month, the biggest monthly drop since 2020, bringing the annual rate down to 3.5% from 4.2% in May. Core inflation was flat on the month at 2.6% year on year. June PPI the following day was soft too, with headline wholesale prices down 0.3%. Two cool prints back to back.
The effect has been to unwind the near-term rate-hike trade that had been building into the summer. Markets have moved back toward the Fed holding at its July meeting, with a September move now looking closer to a coin flip. Fed Chair Kevin Warsh pushed back on the idea that the job is done, so the hawkish posture has not disappeared, but the immediate pressure has eased. The dollar reflected it, with the dollar index slipping below 101 for a second session and Treasury yields easing. A softer dollar and lower yields tend to support non-yielding assets like Bitcoin, and that is the channel that appears to be doing the work here.
Alongside the macro, there was a crypto-specific catalyst. Japan’s Upper House passed a bill reclassifying crypto as financial instruments, moving it under the same framework as stocks and bonds. The reform opens a legal path to spot Bitcoin ETFs on the Tokyo exchange and replaces a tax rate of up to around 55% with a flat 20% on qualifying gains. It is worth being precise about the timeline, because the headlines have run ahead of it. The bill does not approve any ETF by itself. The reclassification is due to take effect in fiscal 2027 and the tax change in 2028, so this removes a hurdle rather than delivering a product.
The risk to all of this sits in the same place it has for months. June’s soft inflation reflects ceasefire-era energy prices from last month. With the Strait of Hormuz situation re-escalating and oil pushing higher again, July’s inflation data could look materially different, which could revive the very hike trade that has just been unwound. The FOMC meeting on 28 to 29 July is the next hard checkpoint.
Bitcoin daily chart
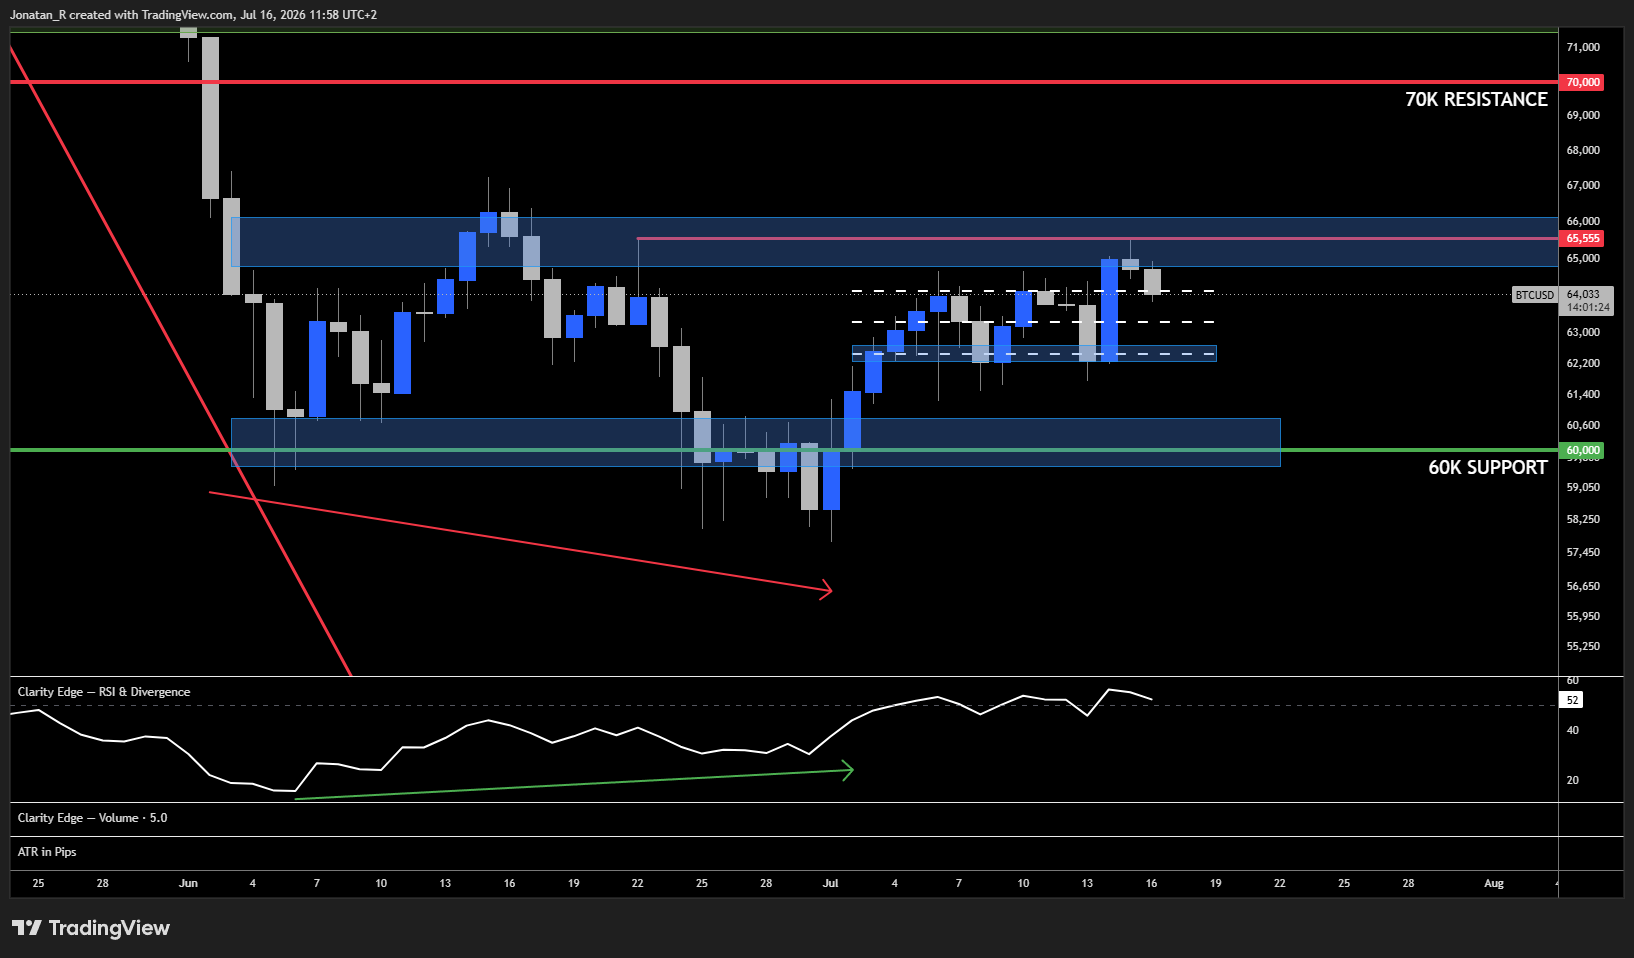
Starting on the daily, the setup we flagged in our last Bitcoin analysis has played out. We had a bullish divergence connecting the price lows at the start of June and the end of June with higher lows on RSI, and that resolved to the upside. From there we built a range, consolidating between lows around $62,500 and highs around $64,500.
On Tuesday, into the CPI print, we broke above the range highs and pushed up to tag the $65,555 resistance area. We then printed a daily indecision candle, a doji, right at that level. Today we are seeing a bearish divergence follow through to the downside, and price is now testing the $64,000 support area.
This is the level that matters here. If $64,000 holds, the structure stays constructive. If this support fails, price could slip back into the range, and the range lows in the $60,000 to $62,400 band could come back into play. Above, $65,555 remains the immediate ceiling, with the larger $70,000 resistance sitting overhead.
Bitcoin 4-hour chart
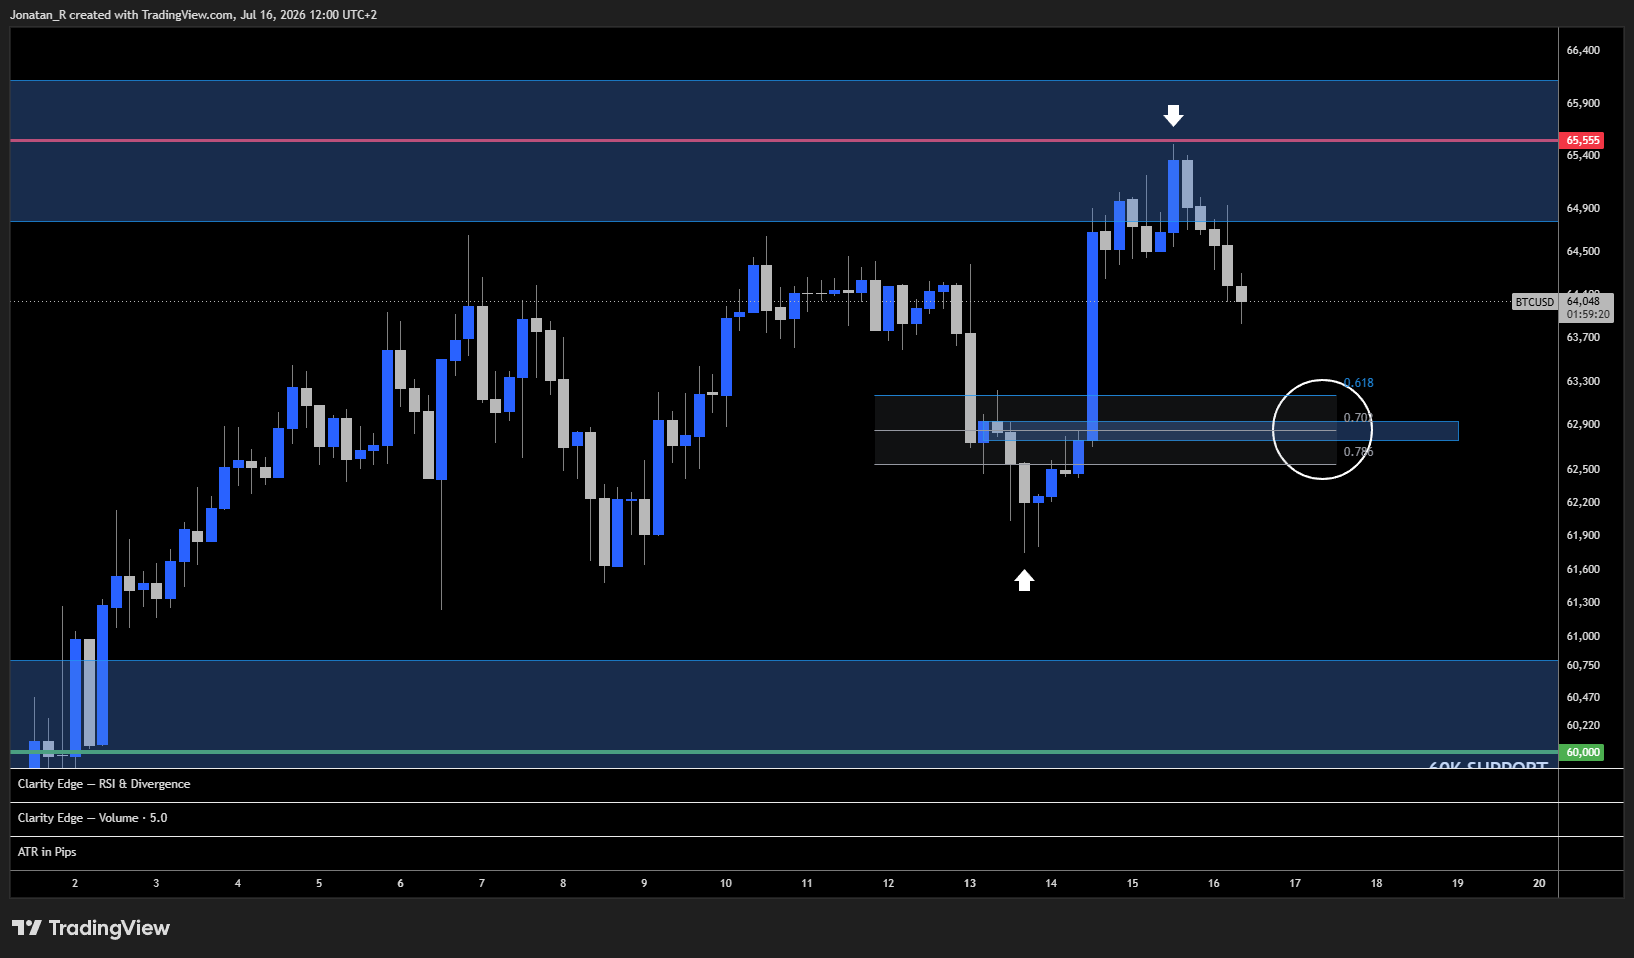
On the 4H, we are watching for a cleaner support level below current price, around $62,800. Anchoring fibs from the recent swing low up to the swing high puts the 0.618 to 0.786 retracement zone right at that area.
A move down into that zone could mark a test of an untested support area inside the long reload zone, one that also lines up with where the CPI move originated from. If we see continuous selling pressure from here, that $62,800 area appears to be the logical next immediate support.
Beneath the surface: is demand actually returning?
Part of the bull case doing the rounds is that large holders have quietly flipped from distribution back into accumulation. It is worth being honest about how firm that actually is. There are reports that some large wallets have started accumulating, but it is not obvious in the underlying research, and the information is conflicting. Different data sets point in different directions over the same window, and the clean version of the story does not hold up to close reading.
What we can say with more confidence is the simpler point. On the higher timeframes, Bitcoin remains in an overall downtrend, well below where it traded earlier in the year, and the selling pressure into resistance appears very real. Until that changes, the constructive read stays dependent on price holding its levels rather than on a demand signal that the data does not clearly support.
Key levels to watch
Resistance
- $65,555: the level Bitcoin tagged before printing the daily doji, and the immediate ceiling on any recovery attempt.
- $70,000: the larger resistance sitting overhead.
Support
- $64,000: the level being tested now. A hold here keeps the structure constructive.
- $62,800: the 4H reload zone, aligning with the 0.618 to 0.786 fib retracement and the origin of the CPI move.
- $60,000 to $62,400: the range lows, in play if $64,000 fails.
- $60,000: the major support floor beneath the range.
Trading involves risk.
Author



 Risk Disclaimer
The content provided here is for informational purposes only. It is not intended as personal investment advice and does not constitute a solicitation or invitation to engage in any financial transactions, investments, or related activities. Past performance is not a reliable indicator of future results.
The financial products offered by the Company are complex and come with a high risk of losing money rapidly due to leverage. These products may not be suitable for all investors. Before engaging, you should consider whether you understand how these leveraged products work and whether you can afford the high risk of losing your money.
The Company does not accept clients from the Restricted Jurisdictions as indicated in our website/ T&C. Some services or products may not be available in your jurisdiction.
The applicable legal entity and its respective products and services depend on the client’s country of residence and the entity with which the client has established a contractual relationship during registration.