
 12 min read
 Chainlink (LINK) trades near $8.20 in early August 2026, roughly 84% below the record it set in 2021 and pinned beneath its own 200-day average. Chainlink is a decentralized oracle network: it pulls off-chain data — asset prices, interest rates, proof of reserves — onto blockchains so smart contracts can act on it, and its price feeds underpin most of decentralized finance. This page sets out PrimeXBT’s outlook for LINK through 2030 and out to 2050, the levels traders are watching now, and the events that could push the token either way. Every number here is an estimate, not a promise; where the data thins out, especially past 2030, the page says so plainly.
Chainlink outlook at a glance
- Current price: $13.589 per LINK.
- 2026 base case: $7.54–$11.76, a holding pattern rather than a fresh bull run.
- Main bullish catalyst: real bank and asset-manager adoption of Chainlink’s oracle and cross-chain infrastructure, led by the SWIFT and CCIP tokenization work.
- Biggest downside risk: a stalled altcoin market and a sustained break below the $7.18 support.
- Long-term view: the multi-year path bends higher on adoption, but anything past 2030 reads as a direction, not a target.
Live Chainlink price chart
Today (7 October 2026) Chainlink (LINK/USD) is trading at $13.589 per LINK, with a market cap of $10,172,599,887 USD. The 24-hour trading volume amounts to $298,685,805 USD. LINK price has changed by -1.32% in the last 24 hours. Chainlink’s circulating supply is 748,099,970 LINK.
Trading involves risk.
Chainlink price prediction 2026–2030 (yearly forecast)
The table below is PrimeXBT’s expected range for each year, built up from the month-by-month path further down. The far more bullish institutional targets floating around the market rest on different assumptions and sit in the analyst section, not blended into these figures.
| Year | Minimum | Average | Maximum |
|---|---|---|---|
| 2026 | $7.54 | $9.50 | $11.76 |
| 2027 | $10.19 | $13.56 | $17.87 |
| 2028 | $14.63 | $18.80 | $22.56 |
| 2029 | $12.83 | $16.80 | $21.35 |
| 2030 | $11.20 | $14.59 | $18.03 |
Chainlink price prediction 2026
Our 2026 view keeps LINK close to where it trades now — an average near $9.50 across a $7.54–$11.76 band. That reads as consolidation: fear-driven sentiment, price below the 200-day average, and no catalyst yet large enough to force a trend. The rest of the year drifts sideways with a mild upward tilt.
| Month (2026) | Minimum | Average | Maximum |
|---|---|---|---|
| August | $7.54 | $8.20 | $8.86 |
| September | $8.12 | $8.85 | $9.58 |
| October | $8.70 | $9.50 | $10.30 |
| November | $9.27 | $10.15 | $11.03 |
| December | $9.84 | $10.80 | $11.76 |
Chainlink price prediction 2027
2027 is the turn. The path climbs off the 2026 base toward the low-to-mid teens, an average near $13.50 over a $10.19–$17.87 range. The lift rests on wider use of Chainlink’s oracle and cross-chain services rather than one headline event.
| Month (2027) | Minimum | Average | Maximum |
|---|---|---|---|
| January | $10.19 | $11.22 | $12.24 |
| February | $10.54 | $11.63 | $12.72 |
| March | $10.89 | $12.05 | $13.20 |
| April | $11.23 | $12.46 | $13.69 |
| May | $11.58 | $12.88 | $14.17 |
| June | $11.92 | $13.29 | $14.66 |
| July | $12.28 | $13.73 | $15.17 |
| August | $12.65 | $14.18 | $15.71 |
| September | $13.03 | $14.64 | $16.25 |
| October | $13.40 | $15.09 | $16.79 |
| November | $13.76 | $15.55 | $17.33 |
| December | $14.13 | $16.00 | $17.87 |
Chainlink price prediction 2028
2028 marks the cycle top in our outlook, with an average near $19.00 and a $14.63–$22.56 range. Both of the algorithmic models we track independently place LINK’s local peak in this window, which is why the shape crests here before easing.
| Month (2028) | Minimum | Average | Maximum |
|---|---|---|---|
| January | $14.63 | $16.62 | $18.60 |
| February | $15.14 | $17.23 | $19.32 |
| March | $15.64 | $17.85 | $20.06 |
| April | $16.13 | $18.46 | $20.79 |
| May | $16.63 | $19.08 | $21.53 |
| June | $17.12 | $19.69 | $22.27 |
| July | $17.26 | $19.91 | $22.56 |
| August | $17.06 | $19.73 | $22.40 |
| September | $16.85 | $19.55 | $22.24 |
| October | $16.65 | $19.36 | $22.07 |
| November | $16.45 | $19.18 | $21.91 |
| December | $16.25 | $19.00 | $21.75 |
Chainlink price prediction 2029
2029 cools from the peak. The average settles near $16.50 across a $12.83–$21.35 band as the market digests the prior year’s run rather than extending it.
| Month (2029) | Minimum | Average | Maximum |
|---|---|---|---|
| January | $15.88 | $18.62 | $21.35 |
| February | $15.51 | $18.23 | $20.95 |
| March | $15.14 | $17.85 | $20.55 |
| April | $14.78 | $17.46 | $20.15 |
| May | $14.41 | $17.08 | $19.74 |
| June | $14.05 | $16.69 | $19.34 |
| July | $13.77 | $16.41 | $19.05 |
| August | $13.58 | $16.23 | $18.87 |
| September | $13.39 | $16.05 | $18.70 |
| October | $13.20 | $15.86 | $18.52 |
| November | $13.02 | $15.68 | $18.35 |
| December | $12.83 | $15.50 | $18.17 |
Chainlink price prediction 2030
By 2030 the outlook steadies near a $14.50 average over a $11.20–$18.03 range. This far out the monthly path is a trajectory, not a schedule of dated prices, so read the table below for its slope rather than any single cell.
| Month (2030) | Minimum | Average | Maximum |
|---|---|---|---|
| January | $12.67 | $15.35 | $18.03 |
| February | $12.50 | $15.19 | $17.88 |
| March | $12.34 | $15.04 | $17.73 |
| April | $12.18 | $14.88 | $17.59 |
| May | $12.02 | $14.73 | $17.44 |
| June | $11.86 | $14.58 | $17.29 |
| July | $11.73 | $14.45 | $17.18 |
| August | $11.62 | $14.36 | $17.10 |
| September | $11.52 | $14.27 | $17.03 |
| October | $11.41 | $14.18 | $16.95 |
| November | $11.31 | $14.09 | $16.88 |
| December | $11.20 | $14.00 | $16.80 |
Chainlink long-term price prediction: 2035, 2040–2050
Push the horizon to 2035 and beyond and precision collapses. No model can price a decade of DeFi cycles, oracle competition, and regulatory regimes that do not exist yet, so the figures below trace a broad upward drift rather than fixed targets — and the error widens with every year added.
| Year | Minimum | Average | Maximum |
|---|---|---|---|
| 2035 | $16.72 | $22.00 | $27.28 |
| 2040 | $19.60 | $28.00 | $36.40 |
| 2050 | $21.08 | $34.00 | $46.92 |
What analysts and models say (compared)
Forecasts for Chainlink split along a wide seam. Algorithmic models sit in single digits to low teens for 2026, while editorial and institutional outlooks reach for multiples of that. Blending numbers built on such different assumptions would flatter the picture, so they sit side by side here.
| Source | Method | Chainlink view |
|---|---|---|
| CoinCodex | Algorithmic | 2026 avg ~$10.21; 2030 avg ~$12.26 |
| Changelly | Algorithmic | 2026 avg ~$8.73; 2030 avg ~$13.40 |
| Standard Chartered | Institutional | $25–$45 range tied to CCIP transfer volume |
| Coinpedia | Editorial | 2026 avg ~$50; 2030 avg ~$170 |
The gap is the point. Standard Chartered frames its $25–$45 range around Chainlink’s cross-chain transfer volume rather than chart patterns, while editorial desks such as Coinpedia model triple-digit prices by 2030 on full-scale adoption. The algorithmic aggregators, working from price history, stay far more conservative. No single figure survives that spread as a consensus, and pretending otherwise would mislead.
Track record of this forecast
This is PrimeXBT’s first published Chainlink forecast. Beginning with the next monthly update, this section will hold the previous outlook against LINK’s actual price on the review date and account for any gap instead of quietly dropping it.
Chainlink technical analysis
LINK sits between its two most-watched moving averages. It trades just above the 50-day simple moving average near $8.00, which shows it has steadied off recent lows, but below the 200-day average near $8.90 — the longer trend still points down. The RSI has hovered around the neutral 50 mark through early August, neither overbought nor oversold.
The support and resistance levels in play now: first support at $7.18, with heavier demand below that; resistance at $10.56, the level LINK has to clear to change the short-term picture. Reclaiming the 200-day average near $8.90 would be the first real signal the downtrend has broken. Sentiment backs the caution — the Fear & Greed Index reads in fear territory. PrimeXBT’s guide to crypto technical analysis covers how these signals fit together.
Correlation with other assets
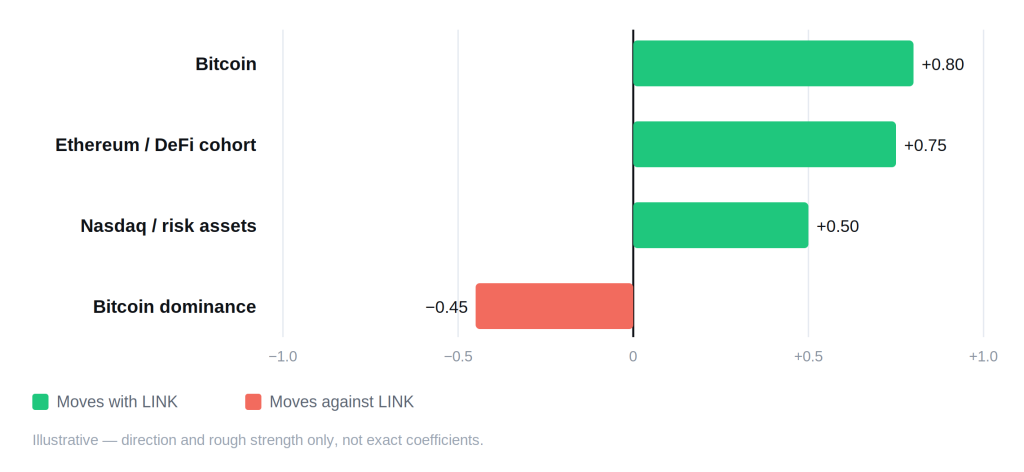
Chainlink trades as a high-beta member of the altcoin cohort. When Bitcoin rallies it tends to run harder, and when Bitcoin dominance climbs — capital crowding into BTC — LINK usually lags with the rest of the alt market. Its tightest link is to Ethereum and the wider smart-contract economy: Chainlink oracles secure the bulk of DeFi, so LINK demand rises and falls with total DeFi activity, tokenization volume, and the amount of real-world value moving on-chain. Since institutions arrived, LINK has also tracked risk assets like the Nasdaq more closely, which is why Federal Reserve policy reaches its price quickly. What increasingly sets Chainlink apart is its sensitivity to enterprise and traditional-finance headlines — a SWIFT milestone or a fresh bank tokenization pilot can lift LINK on adoption grounds while the broader alt market stays flat. None of these are locked ratios; they strengthen and fade as the market’s structure changes.
Fundamental factors
Chainlink is the dominant oracle network, the middleware that lets blockchains read data they cannot fetch on their own. Sergey Nazarov co-founded the project as SmartContract and raised funds in a 2017 ICO; LINK is the token node operators are paid in and, increasingly, the asset they stake to back their service. Its products span Data Feeds and Data Streams for market prices, Proof of Reserve for asset backing, and VRF for verifiable randomness, with CCIP — the Cross-Chain Interoperability Protocol — moving messages and tokens between networks. For a fuller primer, see PrimeXBT’s explainer on what Chainlink is.
Supply is capped at 1 billion LINK, of which roughly 748 million circulates — about three-quarters of the total. A large share was allocated at launch and is released over time, so distribution remains an ongoing overhang rather than a fixed float. Staking, now on version 0.2 with a pool of around 45 million LINK, locks up a slice of supply in exchange for helping secure oracle services.
The adoption thesis leans on traditional finance. In September 2025 Chainlink, SWIFT, and UBS demonstrated tokenized-fund subscriptions and redemptions driven through SWIFT’s existing ISO 20022 messaging and the Chainlink Runtime Environment — a route for banks to reach blockchains without ripping out the plumbing they already run. How much of that pipeline converts into recurring on-chain volume, and therefore LINK demand, is the open question the price ultimately answers.
Upcoming catalysts
Only confirmed, dated events appear here. With LINK now tracking risk assets, U.S. monetary policy is the clearest near-term driver.
| Date | Event | Potential impact |
|---|---|---|
| September 15–16, 2026 | FOMC meeting (with economic projections) | Bull on a dovish signal; bear if rates stay higher for longer |
| October 27–28, 2026 | FOMC meeting | Rate path steers risk appetite across crypto |
| December 8–9, 2026 | FOMC meeting (with economic projections) | Year-end policy read for 2027 positioning |
Chainlink’s own roadmap — further CCIP rollout and SWIFT-linked tokenization work — is active but carries no fixed public date, so it stays off this table rather than pinned to a guessed one. The FOMC dates follow the Federal Reserve’s published 2026 schedule.
Bull case vs bear case
Bull case:
- Bank and asset-manager tokenization moves from pilot to production, turning CCIP volume into recurring LINK demand.
- The Fed eases, and capital rotates back toward altcoins including LINK.
- Staking expands, thinning the float available to sell.
- DeFi and real-world-asset activity climbs, lifting oracle usage across chains.
Bear case:
- Tokenization headlines stay pilots and never convert into sustained on-chain volume.
- Bitcoin dominance keeps rising and LINK trails the broader alt market.
- Scheduled token distribution adds steady sell pressure.
- LINK stays below its 200-day average with fear sentiment entrenched.
Invalidation levels. The bullish case loses conviction if LINK closes below $7.18, the first support and roughly 13% under the current price. The bearish case breaks on a sustained move back above the 200-day average near $8.90, and more firmly on a clean push through $10.56 resistance — the level that would mark the short-term trend as actually turned.
Historical performance
Chainlink’s chart is a story of violent cycles, not a steady climb. It ran to about $52.70 in the 2021 bull market, surrendered more than 80% in the bear market that followed, and in August 2026 still trades far under that peak and below its own 200-day average. Each past cycle paired a euphoric run with a long drawdown, and nothing obliges the next one to trace the same arc.
Is Chainlink a good investment in 2026?
Whether Chainlink earns a place in a portfolio comes down to what an investor is buying: a bet on oracle infrastructure becoming the settlement layer for tokenized finance, or a volatile altcoin still down 84% from its high. Our outlook has LINK roughly flat into year-end, an average near $9.50 for 2026, with the real tension in the fundamentals — SWIFT and CCIP traction on one side, token distribution and a fearful market on the other. PrimeXBT’s breakdown of whether Chainlink is a good investment works through the case in more depth.
How to trade Chainlink on PrimeXBT
On PrimeXBT you can take a position on Chainlink in either direction. CFDs on LINK trade long or short, so a view that the price falls is as tradable as one that it rises — see PrimeXBT’s guide to short selling. Leverage magnifies gains and losses alike, which is why position sizing and a stop-loss matter on every trade. Trade on your own analysis and risk tolerance, and never risk more than you can afford to lose.
Trading involves risk.
How we build this forecast
This outlook is assembled by PrimeXBT’s analysts rather than copied from one price feed. We start from where LINK trades today, read it against the 50- and 200-day moving averages and the nearest support and resistance, weigh the fundamentals — oracle usage, CCIP and SWIFT adoption, staking, and token distribution — and set the whole picture against the macro backdrop, chiefly U.S. interest-rate policy. The yearly ranges combine that technical read with the fundamental and macro view; the long-range figures lean on direction over precision.
None of this is a guarantee. Chainlink is volatile, the inputs shift, and a single adoption headline or macro surprise can move LINK faster than any model expects. Treat every figure here as a considered estimate, not a promise — we revisit and update this outlook monthly as the data changes.
How much will Chainlink be worth in 2026?
Our outlook is $7.54–$11.76 for 2026, averaging near $9.50.
How much will Chainlink be worth in 2030?
Our long-range view is $11.20–$18.03, averaging near $14.50. Read a five-year number as a direction, not a firm target — confidence drops sharply at this horizon.
Can Chainlink reach $100?
Not within our modeled horizon. Our outlook peaks near a $19 average in 2028, well short of $100. Some editorial forecasts do model triple digits by 2030, but that assumes a far stronger adoption cycle than our numbers price in.
Is Chainlink a good investment in 2026?
It cuts both ways: a roughly flat near-term outlook and a fearful market on one side, real traction in bank and SWIFT tokenization work on the other. The infrastructure case is stronger than the near-term chart.
What makes Chainlink different from other altcoins?
Chainlink runs the dominant oracle network, the infrastructure that feeds off-chain data to smart contracts and secures much of decentralized finance. Its cross-chain protocol, CCIP, and its work with SWIFT and major banks tie its demand to tokenization and real-world-asset adoption more than to any single blockchain.
Author



 Risk Disclaimer
The content provided here is for informational purposes only. It is not intended as personal investment advice and does not constitute a solicitation or invitation to engage in any financial transactions, investments, or related activities. Past performance is not a reliable indicator of future results.
The financial products offered by the Company are complex and come with a high risk of losing money rapidly due to leverage. These products may not be suitable for all investors. Before engaging, you should consider whether you understand how these leveraged products work and whether you can afford the high risk of losing your money.
The Company does not accept clients from the Restricted Jurisdictions as indicated in our website/ T&C. Some services or products may not be available in your jurisdiction.
The applicable legal entity and its respective products and services depend on the client’s country of residence and the entity with which the client has established a contractual relationship during registration.








