14 min read
 Decentraland (MANA) trades near $0.07 in August 2026, about 99% below the record high it printed at the height of the 2021 metaverse craze. Decentraland is a browser-based virtual world built on Ethereum where users buy parcels of virtual LAND as NFTs, build on them, and socialize; MANA is the ERC-20 token spent on that LAND, on wearables, and on unique names, and it is burned when spent on LAND and names. This page sets out PrimeXBT’s price outlook for MANA through 2030 and out to 2050, the levels traders are watching now, and the events that could move it. Every figure here is an estimate expressed as a range, and where the evidence is thin the page says so rather than inventing precision.
Decentraland outlook at a glance
- Current price: $0.0962 per MANA.
- 2026 base case: $0.0603–$0.0726, a year of consolidation near current levels rather than a recovery.
- Main bullish catalyst: a fresh metaverse or AI-avatar narrative, amplified by Fed rate cuts pulling capital back into small-cap risk assets.
- Biggest downside risk: Decentraland’s declining daily user count and a sustained break below the $0.064 support.
- Long-term view: a slow recovery is the base case, but anything past 2030 is a direction of travel, not a target.
Live Decentraland price chart
Today (11 October 2026) Decentraland (MANA/USD) is trading at $0.0962 per MANA, with a market cap of $191,448,153 USD. The 24-hour trading volume amounts to $13,137,548 USD. MANA price has changed by 1.05% in the last 24 hours. Decentraland’s circulating supply is 1,985,909,566 MANA.
Trading involves risk.
Decentraland price prediction 2026–2030 (yearly forecast)
The table gives PrimeXBT’s expected range for each year, drawn from a single continuous monthly path so the yearly numbers and the month-by-month tables below agree by construction. Longer-horizon third-party targets, which scatter from near-zero to well above $1, are kept out of this table and shown separately in the analyst section.
| Year | Minimum | Average | Maximum |
|---|---|---|---|
| 2026 | $0.0603 | $0.0665 | $0.0726 |
| 2027 | $0.0609 | $0.0718 | $0.0858 |
| 2028 | $0.0669 | $0.0827 | $0.1026 |
| 2029 | $0.0739 | $0.0940 | $0.1191 |
| 2030 | $0.0794 | $0.1055 | $0.1364 |
Decentraland price prediction 2026
The 2026 outlook keeps MANA close to its August level of roughly $0.07, an average near $0.066 across a full-year band of $0.0603–$0.0726. That is a coin marking time, not turning: the metaverse bid that drove 2021 has not returned, and nothing in current network activity argues for a breakout this year.
For the rest of 2026 the month-by-month path stays flat, drifting within a few tenths of a cent of the current price:
| Month (2026) | Minimum | Average | Maximum |
|---|---|---|---|
| August | $0.0616 | $0.0670 | $0.0724 |
| September | $0.0610 | $0.0665 | $0.0720 |
| October | $0.0603 | $0.0660 | $0.0717 |
| November | $0.0603 | $0.0663 | $0.0722 |
| December | $0.0604 | $0.0665 | $0.0726 |
Decentraland price prediction 2027
2027 is the first year with a visible upward tilt, an average near $0.072 over a range of $0.0609–$0.0858. The lift is modest and rests on the broader crypto cycle turning rather than on anything specific to Decentraland — MANA tends to rise late, after Bitcoin and the majors have already run.
| Month (2027) | Minimum | Average | Maximum |
|---|---|---|---|
| January | $0.0609 | $0.0673 | $0.0738 |
| February | $0.0615 | $0.0682 | $0.0749 |
| March | $0.0620 | $0.0690 | $0.0760 |
| April | $0.0626 | $0.0699 | $0.0772 |
| May | $0.0631 | $0.0707 | $0.0783 |
| June | $0.0636 | $0.0716 | $0.0795 |
| July | $0.0641 | $0.0724 | $0.0806 |
| August | $0.0645 | $0.0731 | $0.0816 |
| September | $0.0650 | $0.0738 | $0.0827 |
| October | $0.0654 | $0.0745 | $0.0837 |
| November | $0.0658 | $0.0753 | $0.0848 |
| December | $0.0662 | $0.0760 | $0.0858 |
Decentraland price prediction 2028
2028 carries the recovery further, averaging near $0.083 across $0.0669–$0.1026. A Bitcoin halving falls in this window, and metaverse tokens have historically caught a late-cycle bid when speculative appetite spills down the risk curve into small caps. The path assumes participation in that move, not leadership of it.
| Month (2028) | Minimum | Average | Maximum |
|---|---|---|---|
| January | $0.0669 | $0.0771 | $0.0873 |
| February | $0.0676 | $0.0782 | $0.0887 |
| March | $0.0683 | $0.0792 | $0.0902 |
| April | $0.0689 | $0.0803 | $0.0917 |
| May | $0.0696 | $0.0814 | $0.0932 |
| June | $0.0703 | $0.0825 | $0.0946 |
| July | $0.0709 | $0.0835 | $0.0960 |
| August | $0.0714 | $0.0844 | $0.0973 |
| September | $0.0719 | $0.0853 | $0.0987 |
| October | $0.0724 | $0.0862 | $0.1000 |
| November | $0.0729 | $0.0871 | $0.1013 |
| December | $0.0734 | $0.0880 | $0.1026 |
Decentraland price prediction 2029
2029 holds the gains and adds to them slowly, an average near $0.094 over $0.0739–$0.1191. By this point the outlook leans more on trend than on any datable event, so treat the monthly figures as a slope rather than a schedule.
| Month (2029) | Minimum | Average | Maximum |
|---|---|---|---|
| January | $0.0739 | $0.0889 | $0.1040 |
| February | $0.0744 | $0.0898 | $0.1053 |
| March | $0.0748 | $0.0908 | $0.1067 |
| April | $0.0753 | $0.0917 | $0.1081 |
| May | $0.0758 | $0.0926 | $0.1094 |
| June | $0.0763 | $0.0935 | $0.1108 |
| July | $0.0767 | $0.0945 | $0.1122 |
| August | $0.0772 | $0.0954 | $0.1136 |
| September | $0.0776 | $0.0963 | $0.1149 |
| October | $0.0780 | $0.0972 | $0.1163 |
| November | $0.0785 | $0.0981 | $0.1177 |
| December | $0.0789 | $0.0990 | $0.1191 |
Decentraland price prediction 2030
The 2030 view spans $0.0794–$0.1364, averaging near $0.106 — the high point of the five-year window, and still a fraction of the 2021 peak. Five years out, the number matters less than the shape: a grind back toward a dime, not a return to the old highs. Read the month-by-month path below as a trajectory, not dated targets.
| Month (2030) | Minimum | Average | Maximum |
|---|---|---|---|
| January | $0.0794 | $0.1001 | $0.1207 |
| February | $0.0800 | $0.1012 | $0.1223 |
| March | $0.0805 | $0.1022 | $0.1239 |
| April | $0.0811 | $0.1033 | $0.1256 |
| May | $0.0816 | $0.1044 | $0.1272 |
| June | $0.0821 | $0.1055 | $0.1288 |
| July | $0.0825 | $0.1064 | $0.1303 |
| August | $0.0827 | $0.1071 | $0.1315 |
| September | $0.0829 | $0.1078 | $0.1327 |
| October | $0.0832 | $0.1085 | $0.1339 |
| November | $0.0834 | $0.1093 | $0.1352 |
| December | $0.0836 | $0.1100 | $0.1364 |
Decentraland long-term price prediction: 2035, 2040–2050
Push the horizon past 2030 and the honest answer is that no model can price a decade of shifting narratives, VR hardware cycles, and macro regimes that don’t exist yet. The figures below are a direction, not a destination, and the error band widens with every year. On that basis the long-range path drifts higher without ever reclaiming the 2021 blow-off top:
| Year | Minimum | Average | Maximum |
|---|---|---|---|
| 2035 | $0.1152 | $0.1600 | $0.2048 |
| 2040 | $0.1584 | $0.2400 | $0.3216 |
| 2050 | $0.2204 | $0.3800 | $0.5396 |
What analysts and models say (compared)
Third-party forecasts for MANA disagree more than they agree. Most algorithmic models expect the price to stay near current levels or fall through 2030; one projects a recovery back above $1. Averaging outputs built on such different assumptions would hide the real picture, so they are laid out side by side.
| Source | Method | Decentraland view |
|---|---|---|
| CoinCodex | Algorithmic | 2026 around $0.051; drifts toward ~$0.033 by 2030 |
| Changelly | Algorithmic | 2026 avg ~$0.066; declines to ~$0.027 avg by 2030, ~$0.059 by 2035 |
| CoinPriceForecast | Statistical trend | ~$0.08 end-2026, mild rise to ~$0.12 by 2030, ~$0.21 by 2035 |
| DigitalCoinPrice | Algorithmic | Outlier: ~$0.73 in 2026, ~$1.59 by 2030 |
The gap between the bearish models and the lone bull is enormous — a factor of roughly forty on the 2030 line. CoinCodex and Changelly both read MANA’s fading on-chain activity as reason to expect further decline; DigitalCoinPrice extrapolates a full metaverse revival that no current usage data supports. PrimeXBT’s own path sits deliberately between them: a slow recovery that rewards patience without betting on a second mania. Anyone looking for a single agreed number will not find one here.
Track record of this forecast
This is the first published PrimeXBT price forecast for Decentraland. From the next monthly review, this section will hold the previous forecast up against MANA’s actual price on the update date, and where the call was wrong it will say what the model missed.
Decentraland technical analysis
At the time of writing, MANA trades below both of its most-watched moving averages. It sits under the 50-day simple moving average near $0.068 and well under the 200-day average near $0.085 — the standard signature of a downtrend that has not yet turned. The RSI reads about 45, squarely neutral, with neither an oversold washout nor an overbought push to trade against.
The support and resistance levels that matter now sit close together, a symptom of low volatility in a quiet market: support near $0.065, then $0.064, with the next shelf around $0.0641; resistance near $0.067, then $0.0675, with $0.068 capping the range. Reclaiming the 200-day average near $0.085 is the level that would signal the multi-year downtrend has genuinely broken. The Fear & Greed Index reads around 30 — “Fear” — which fits a token trading sideways at a fraction of its former value. For the tools behind these readings, see PrimeXBT’s guide to crypto technical analysis.
Correlation with other assets
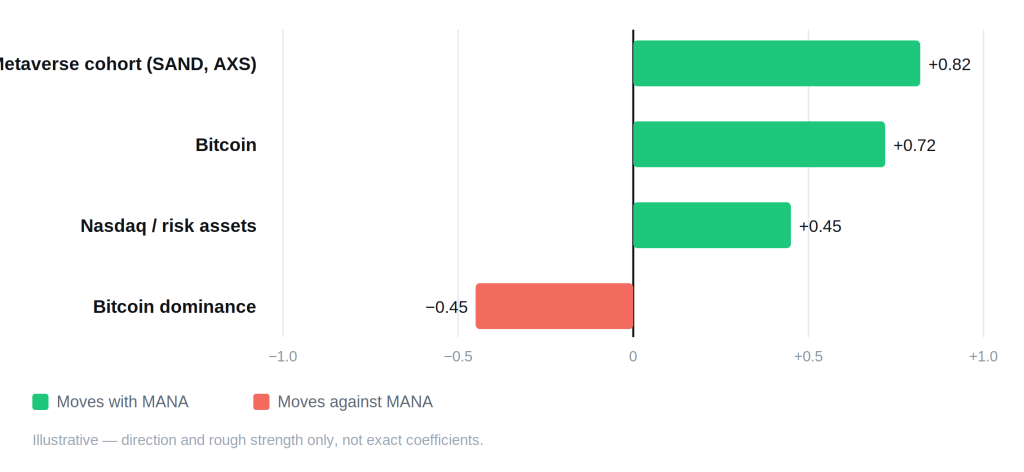
MANA behaves like a high-beta bet on the metaverse theme rather than a market of its own. Its tightest partner is The Sandbox’s SAND — the two virtual-world land tokens rise and fall almost in lockstep, and Axie Infinity’s AXS usually moves with them. Against Bitcoin the link is positive but amplified: MANA tends to lag on the way up and fall harder on the way down. It also flares on headlines, jumping whenever a big-tech VR launch, an AI-avatar demo, or a “metaverse is back” story hits the tape, then giving the move back as the news fades. When Bitcoin dominance climbs, capital concentrates in Bitcoin and thin small caps like MANA bleed. Since institutions moved into crypto, MANA has also tracked the Nasdaq as a risk-on asset, which is why Fed policy reaches its price. What it lacks is any safe-haven story — there is no gold or dollar-hedge angle to MANA, and its floor ultimately depends on whether people keep logging into the world itself.
Fundamental factors
Decentraland is a virtual world you reach through a browser: users buy LAND as NFTs on Ethereum, build scenes, games, and galleries on their parcels, and move around as customizable avatars. MANA is the currency of that economy. Spending it on LAND and on unique names burns the tokens permanently, a deflationary sink that has slowly trimmed supply, so MANA has no fixed cap in Bitcoin’s sense but low net issuance. Around 1.96 billion MANA circulate out of a total near 2.19 billion.
Governance runs through the Decentraland DAO, launched in 2021, where MANA and LAND together confer voting power over the platform’s treasury, policies, and smart contracts. The project came out of an August 2017 ICO and opened to the public in February 2020, built by Argentine engineers Ari Meilich and Esteban Ordano. Its defining moment came in late 2021, when Facebook’s rebrand to Meta lit a metaverse mania and MANA raced to its record high.
The problem since is usage. The virtual-world traffic that justified 2021’s valuation has thinned sharply, and skeptics now question how many people actually inhabit Decentraland day to day. Token burns and DAO governance keep the machinery running, but a land-based metaverse is only worth what its foot traffic implies, and that is the fundamental the price ultimately answers to. For where MANA sits among its peers, see PrimeXBT’s roundup of metaverse crypto.
Upcoming catalysts
Only confirmed, dated events are listed. Because MANA trades as a risk-on small cap, macro policy is the clearest near-term driver; no Decentraland protocol event has a confirmed mainnet date at the time of writing, so none is listed as dated.
| Date | Event | Potential impact |
|---|---|---|
| September 15–16, 2026 | FOMC meeting (with economic projections) | Bull if the Fed signals cuts; bear if it holds higher for longer |
| October 27–28, 2026 | FOMC meeting | Rate path steers risk appetite, which reaches small caps like MANA last |
| December 8–9, 2026 | FOMC meeting (with economic projections) | Year-end policy signal that frames 2027 positioning |
FOMC dates follow the Federal Reserve’s published 2026 schedule. Decentraland’s own calendar of world events and DAO proposals is not fixed far enough ahead to treat as a dated market catalyst, so it is left out rather than guessed at.
Bull case vs bear case
Bull case:
- A new metaverse or AI-avatar narrative revives speculative interest in virtual-world tokens.
- Fed rate cuts push capital down the risk curve, and small caps like MANA catch a late-cycle bid.
- Rising LAND and name activity burns more MANA, tightening an already low-issuance supply.
- A visible rebound in Decentraland’s user numbers restores the fundamental the price leans on.
Bear case:
- Daily active users keep sliding, and the “empty metaverse” narrative hardens.
- Bitcoin dominance stays high, starving thin altcoins of liquidity.
- The metaverse theme cedes attention to AI, leaving MANA without a story to trade.
- Price stays pinned below its 200-day average, and each rally sells off into resistance.
Invalidation levels. The bullish case loses its footing if MANA closes decisively below the $0.064 support, since that would confirm sellers still control the low-volatility range. The bearish case is invalidated on a sustained reclaim of the 200-day average near $0.085 — roughly a quarter above the current price, and the line that has capped every recovery attempt. Both levels come straight from the technical read above.
Historical performance
MANA’s chart is a single spike surrounded by long flat stretches. It went from cents to a record near $5.85 in November 2021 as the Meta rebrand set off a metaverse land rush, then gave almost all of it back over the following years. In August 2026 it trades about 99% below that peak and beneath its own 200-day average. The lesson in the shape is that MANA’s big moves come from narrative, not from steady adoption — and narratives arrive on their own schedule, if at all.
Is Decentraland a good investment in 2026?
It comes down to what a buyer is actually betting on. PrimeXBT’s outlook sees MANA roughly flat into year-end, an average near $0.066, with the market consolidating rather than recovering. The underlying facts are plain: the token trades far below its long-term average, sentiment sits in “Fear,” daily usage has thinned, and the near-term path runs through Fed policy and the metaverse narrative. For a patient buyer, a beaten-down token with a working burn mechanism and a recognizable brand is one kind of opportunity; for anyone expecting a quick round-trip to old highs, the usage data offers little support. PrimeXBT’s comparison of Decentraland and The Sandbox lays out how the two leading metaverse tokens stack up.
How to trade Decentraland on PrimeXBT
On PrimeXBT you can take a position on Decentraland in either direction. CFDs on MANA can be traded long or short, so a view that the price falls is as tradable as a view that it rises — see the guide to short selling for how the downside side works. Leverage magnifies gains and losses alike, and on a thin, headline-driven token like MANA that cuts both ways fast, so position sizing and a stop-loss matter on every trade. Trade on your own analysis and risk tolerance, and never stake more than you can afford to lose.
Trading involves risk.
How we build this forecast
PrimeXBT’s analysts assemble this outlook rather than copy it from a single feed. The starting point is where MANA trades today, read against its 50- and 200-day moving averages and the support and resistance levels around it. On top of that sits the fundamental picture — token burns, DAO governance, and above all the platform’s user activity — and the macro backdrop, chiefly the path of U.S. interest rates and how much appetite the market has for small-cap risk. The yearly ranges blend that technical read with the fundamental and macro view along one continuous monthly path; the long-range figures lean on trajectory rather than precision.
None of this is a guarantee. MANA is volatile and narrative-driven, the inputs change, and one metaverse headline can move it faster than any model expects. Treat every figure here as a considered estimate, not a promise — the outlook is revisited and updated monthly as the data shifts.
How much will Decentraland be worth in 2026?
PrimeXBT's outlook puts MANA at an average near $0.066 for 2026, consolidating close to its current price rather than recovering.
How much will Decentraland be worth in 2030?
Our base case is an average near $0.106 in 2030, the top of the five-year window and still far below the 2021 high. Any five-year crypto forecast should be read as a broad direction, since the plausible range is wide.
Will Decentraland reach $1?
Not on our numbers. MANA last traded near $1 in early 2022, and reaching it again would mean roughly a fifteen-fold rise from today. Our modeled path does not approach $1 even at the 2050 horizon; it would take a full metaverse revival on the scale of 2021 to get there.
Why is MANA so far below its all-time high?
MANA hit about $5.85 in November 2021 during the metaverse mania that followed Facebook's rebrand to Meta. When that hype faded and Decentraland's daily user numbers fell, the speculative premium drained away, leaving the token near $0.07 in 2026.
Author



 Risk Disclaimer
The content provided here is for informational purposes only. It is not intended as personal investment advice and does not constitute a solicitation or invitation to engage in any financial transactions, investments, or related activities. Past performance is not a reliable indicator of future results.
The financial products offered by the Company are complex and come with a high risk of losing money rapidly due to leverage. These products may not be suitable for all investors. Before engaging, you should consider whether you understand how these leveraged products work and whether you can afford the high risk of losing your money.
The Company does not accept clients from the Restricted Jurisdictions as indicated in our website/ T&C. Some services or products may not be available in your jurisdiction.
The applicable legal entity and its respective products and services depend on the client’s country of residence and the entity with which the client has established a contractual relationship during registration.