14 min read
 Ethereum Classic (ETC) is the original Ethereum chain, kept running unchanged after most of the community forked away in 2016 to reverse a major hack. It is a proof-of-work smart-contract network whose pitch is immutability and a hard-capped coin supply, mined the same way Bitcoin is. In late August 2026 ETC trades around $7.80, roughly 95% below its May 2021 record near $176 and well down on where it stood a year ago. This page sets out PrimeXBT’s price outlook for ETC through 2030 and out to 2050, the levels traders are defending now, and the events most likely to move the coin. Numbers are given as ranges; where the honest answer is that no one can know, the text says so instead of printing a false-precise figure.
Ethereum Classic outlook at a glance
- 2026 base case: $7.33–$9.17, a grind sideways-to-higher rather than a trend change.
- Main bullish catalyst: a broad crypto risk-on cycle, reinforced by the 2026 “Fifthening” that trims new ETC issuance by a fifth.
- Biggest downside risk: weakening mining economics and a loss of the 50-day average near $6.82, which would mark the recent bounce as a false start.
- Long-term view: a cycle-shaped recovery is the base case, but anything past 2030 is a direction of travel, not a dated price.
Live Ethereum Classic price chart
The chart below tracks ETC/USD in real time; the price levels that matter right now are laid out in the technical section further down.
Trading involves risk.
Ethereum Classic price prediction 2026–2030 (yearly forecast)
The table below is PrimeXBT’s expected range for ETC in each year. Third-party targets sit far apart — some models see ETC halving again, others see it multiplying — so those are kept in the analyst section rather than blended into a single misleading average here.
| Year | Minimum | Average | Maximum |
|---|---|---|---|
| 2026 | $7.33 | $8.18 | $9.17 |
| 2027 | $8.33 | $11.39 | $15.09 |
| 2028 | $12.04 | $14.43 | $16.87 |
| 2029 | $9.97 | $13.04 | $16.01 |
| 2030 | $8.81 | $11.61 | $14.34 |
Ethereum Classic price prediction 2026
PrimeXBT’s 2026 outlook holds ETC in a $7.33–$9.17 band, averaging near $8.20 — a modest lift from its late-August level around $7.80 rather than a breakout. ETC entered the second half of 2026 fresh off a sharp weekly bounce, so the base case is that the coin digests that move instead of extending it in a straight line.
Across the remaining months of 2026, the month-by-month path stays in a narrow band that drifts higher into year-end:
| Month (2026) | Minimum | Average | Maximum |
|---|---|---|---|
| August | $7.33 | $7.80 | $8.27 |
| September | $7.50 | $8.00 | $8.50 |
| October | $7.66 | $8.20 | $8.74 |
| November | $7.80 | $8.38 | $8.95 |
| December | $7.93 | $8.55 | $9.17 |
Ethereum Classic price prediction 2027
2027 is the recovery leg. The path works up from the high single digits toward the low teens, a full-year range of about $8.33–$15.09 averaging near $11.50. The step up rests on a broader market turn rather than anything specific to ETC’s own roadmap, which stays deliberately thin.
| Month (2027) | Minimum | Average | Maximum |
|---|---|---|---|
| January | $8.33 | $9.00 | $9.68 |
| February | $8.72 | $9.46 | $10.20 |
| March | $9.10 | $9.91 | $10.72 |
| April | $9.49 | $10.37 | $11.24 |
| May | $9.87 | $10.82 | $11.77 |
| June | $10.25 | $11.27 | $12.30 |
| July | $10.59 | $11.69 | $12.79 |
| August | $10.90 | $12.07 | $13.24 |
| September | $11.21 | $12.45 | $13.70 |
| October | $11.51 | $12.84 | $14.16 |
| November | $11.82 | $13.22 | $14.62 |
| December | $12.11 | $13.60 | $15.09 |
Ethereum Classic price prediction 2028
2028 carries the cycle high in this outlook. ETC peaks around mid-year before cooling, for a range of roughly $12.04–$16.87 and an average near $14.40. That top sits far below the 2021 record — a reflection of ETC’s structural weakness against newer chains, not a bet that mania returns to the same level.
| Month (2028) | Minimum | Average | Maximum |
|---|---|---|---|
| January | $12.26 | $13.82 | $15.37 |
| February | $12.41 | $14.03 | $15.65 |
| March | $12.56 | $14.25 | $15.93 |
| April | $12.70 | $14.46 | $16.22 |
| May | $12.85 | $14.68 | $16.51 |
| June | $12.99 | $14.89 | $16.79 |
| July | $12.97 | $14.92 | $16.87 |
| August | $12.78 | $14.75 | $16.73 |
| September | $12.59 | $14.59 | $16.59 |
| October | $12.41 | $14.43 | $16.45 |
| November | $12.22 | $14.26 | $16.30 |
| December | $12.04 | $14.10 | $16.16 |
Ethereum Classic price prediction 2029
2029 is the give-back year. After the peak, the path eases lower through the year, ranging about $9.97–$16.01 with an average near $13.00. Post-peak drawdowns have defined every ETC cycle, and the model assumes this one behaves the same way.
| Month (2029) | Minimum | Average | Maximum |
|---|---|---|---|
| January | $11.85 | $13.93 | $16.01 |
| February | $11.67 | $13.76 | $15.86 |
| March | $11.48 | $13.59 | $15.70 |
| April | $11.30 | $13.42 | $15.55 |
| May | $11.11 | $13.25 | $15.39 |
| June | $10.93 | $13.08 | $15.24 |
| July | $10.76 | $12.93 | $15.10 |
| August | $10.60 | $12.78 | $14.96 |
| September | $10.44 | $12.64 | $14.83 |
| October | $10.28 | $12.49 | $14.70 |
| November | $10.12 | $12.35 | $14.57 |
| December | $9.97 | $12.20 | $14.43 |
Ethereum Classic price prediction 2030
The 2030 view spans roughly $8.81–$14.34, averaging near $11.50 — above the 2027 level but below the cycle top, the shape of a market that has settled after a run. Five years out, precision is the wrong thing to expect: read the monthly path below as a trajectory, not a set of appointments the price is obliged to keep.
| Month (2030) | Minimum | Average | Maximum |
|---|---|---|---|
| January | $9.84 | $12.09 | $14.34 |
| February | $9.72 | $11.98 | $14.25 |
| March | $9.59 | $11.88 | $14.16 |
| April | $9.47 | $11.77 | $14.07 |
| May | $9.35 | $11.66 | $13.98 |
| June | $9.23 | $11.55 | $13.88 |
| July | $9.13 | $11.48 | $13.83 |
| August | $9.07 | $11.45 | $13.82 |
| September | $9.00 | $11.41 | $13.81 |
| October | $8.94 | $11.37 | $13.80 |
| November | $8.88 | $11.34 | $13.80 |
| December | $8.81 | $11.30 | $13.79 |
Ethereum Classic long-term price prediction: 2035, 2040–2050
Put a number on ETC in 2050 and you are really guessing at three unknowns at once: whether proof-of-work chains still matter, whether ETC keeps any developer mindshare, and what money itself looks like by then. No model prices that honestly. The figures below are a slow upward drift built on the assumption that ETC survives as a niche, hard-money chain rather than a growth story — treat them as scenario, not forecast, with error bars that widen every year out.
| Year | Minimum | Average | Maximum |
|---|---|---|---|
| 2035 | $12.58 | $17.00 | $21.42 |
| 2040 | $16.32 | $24.00 | $31.68 |
| 2050 | $25.20 | $42.00 | $58.80 |
What analysts and models say (compared)
Few coins split forecasters as cleanly as ETC does. Algorithmic models built on recent price action extrapolate the downtrend and see ETC in the low-to-mid single digits by 2030. Community-leaning models weight the fixed supply and a fresh bull cycle instead, and reach for double or even triple digits. Averaging the two would invent a consensus that does not exist, so they are laid out side by side.
| Source | Method | ETC view |
|---|---|---|
| CoinCodex | Algorithmic | 2026 avg ~$7.93; trends down to ~$3.70 by 2030 |
| Kraken (price-prediction tool) | Linear growth model | ~$7.79 in 2026, ~$9.47 by 2030 at a 5% annual rate |
| Coinpedia | Community / algorithmic | 2026 avg ~$10.18; ~$68 by 2030, with a $100+ bull scenario |
| PrimeXBT | Technical + fundamental + macro | 2026 avg ~$8.20; a 2028 cycle peak near $15, easing to ~$11.50 by 2030 |
The gap is the takeaway. Bearish and bullish models here differ by more than an order of magnitude for 2030, which tells you how little the market agrees on what ETC is for. PrimeXBT’s own path sits between them: a real cyclical recovery, but capped well short of the 2021 high, because ETC has to earn a bull run on borrowed narrative rather than its own.
Track record of this forecast
This is the first published PrimeXBT price forecast for Ethereum Classic. From the next monthly review onward, this section will hold the previous forecast up against ETC’s actual price on the update date, and explain any miss plainly rather than quietly restating the number.
Ethereum Classic technical analysis
At the time of writing, ETC trades near $7.80 — above its 50-day simple moving average around $6.82, which shows the recent bounce has legs, but just under its 200-day average near $7.92, the line that separates a bounce from a trend change. The 14-day RSI reads about 70, at the edge of overbought, and the Fear & Greed Index sits near 73 in “Greed” — a combination that often precedes a pause after a fast run.
The support and resistance that matter now: support at $7.75, then $7.52 and $7.36, with the cycle low near $6.20 below that; resistance at $8.13, then $8.29 and $8.51, with the cycle high around $9.02 capping the range. Reclaiming and holding the 200-day average near $7.92 is the cleanest signal that the trend has turned rather than merely bounced. For readers newer to these tools, PrimeXBT’s guide to crypto technical analysis covers how to read them.
Correlation with other assets
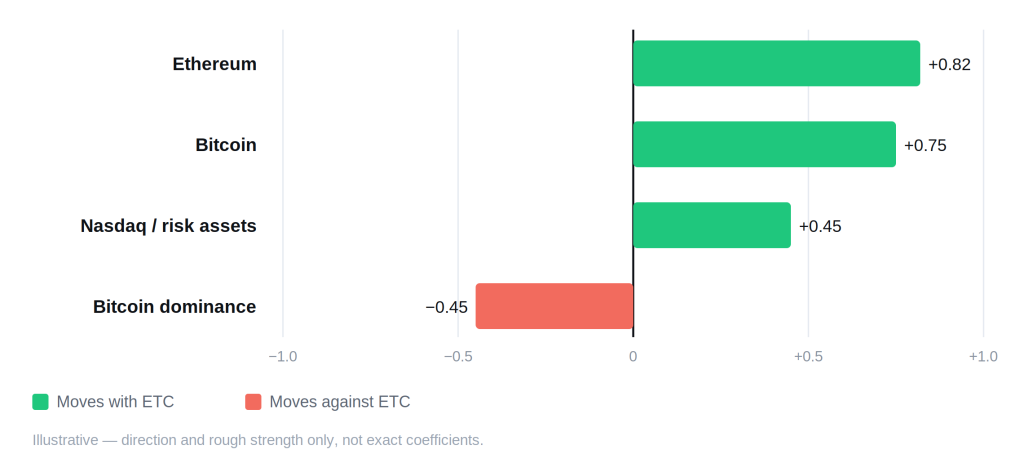
Ethereum Classic carries a heavier tie to Ethereum than most alts carry to any single coin, and for an obvious reason: they share a name, a heritage, and the same EVM lineage, so ETC often catches a bid or a beating simply because ETH moved. Its next-strongest link is to Bitcoin, sharpened by the fact that ETC is proof-of-work — the same mining economics, energy costs, and hashrate dynamics that drive Bitcoin sentiment feed straight into ETC. Since institutions pulled crypto closer to equities, ETC has also drifted with the Nasdaq and broad risk appetite, which is why Federal Reserve policy now shows up in its price. Against Bitcoin dominance the relationship inverts: when money crowds into Bitcoin, thin alts like ETC tend to bleed, and they recover when that dominance rolls over. None of these ties are bolted down — they loosen and tighten with the cycle, and ETC’s small size means a single large flow can override all of them for a while.
Fundamental factors
Ethereum Classic’s identity is a single stubborn principle: “Code is Law.” When the 2016 DAO hack drained investor funds, Ethereum’s majority forked the chain to claw the money back; a minority refused to rewrite the ledger and kept mining the original chain, which became ETC. That choice still defines the coin — immutability over intervention.
After Ethereum’s 2022 Merge moved ETH to proof-of-stake, ETC inherited a role by default: the largest proof-of-work chain that still runs an Ethereum-style virtual machine. Its security therefore rests on mining hashrate rather than staking, and the network has lived through 51% attacks in its past, since hardened with defensive changes. Supply is where ETC leans hardest into the Bitcoin comparison: a fixed cap of about 210.7 million coins under its “5M20” policy, which cuts the block reward by 20% every 5 million blocks — roughly every 2.5 years. Circulating supply sits near 158 million, and the next reduction, the “Fifthening,” is due around block 25,000,001, expected in the second half of 2026. No exact calendar date is fixed because the trigger is a block height, not a day, so it is treated as approximate below rather than as a dated catalyst. If Bitcoin’s halving is the reference point, ETC runs a faster, gentler version of the same disinflation.
The weakness is on the demand side. ETC has drawn little of the smart-contract, DeFi, or developer activity that flows to Ethereum and newer chains, so its market capitalization — around $1.2 billion, ranking outside the top 50 — leans on the store-of-value narrative and on miners more than on usage. Backers such as the Ethereum Classic community and mining groups keep promoting the hard-money case, but ETC competes for attention against dozens of louder Layer 1s, and that scarcity of new demand is the single biggest drag on any long-term forecast.
Upcoming catalysts
Only confirmed, dated events are listed. With ETC now moving alongside risk assets, macro policy is the clearest near-term driver.
| Date | Event | Potential impact |
|---|---|---|
| September 15–16, 2026 | FOMC meeting (with economic projections) | Bull if the Fed signals cuts; bear if it holds rates higher for longer |
| October 27–28, 2026 | FOMC meeting | Rate path sets risk appetite across crypto, ETC included |
| December 8–9, 2026 | FOMC meeting (with economic projections) | Year-end policy signal that frames 2027 positioning |
| 2026 (date not yet confirmed) | ETC “Fifthening” — 5th block-reward reduction, ~block 25,000,001 | Cuts new ETC issuance by 20%; block-height dependent, no calendar date set |
FOMC dates follow the Federal Reserve’s published 2026 schedule. The Fifthening is shown without a date because its trigger is a block height rather than a day — pinning it to a specific date would be a guess dressed as information.
Bull case vs bear case
Bull case:
- A broad crypto up-cycle lifts high-beta alts, and ETC catches the move alongside ETH and Bitcoin.
- The 2026 Fifthening trims new supply just as demand picks up, tightening the float.
- Rate cuts pull capital back toward risk assets, a group ETC now trades with.
- The “digital hard money” narrative pulls fresh mining and holder interest onto the chain.
Bear case:
- Thin smart-contract usage leaves ETC without organic demand when speculation cools.
- Capital rotates into Bitcoin, dominance climbs, and small alts like ETC lag or fall.
- Mining economics deteriorate after the reward cut, pressuring the security budget.
- Higher-for-longer rates keep the whole risk complex on the back foot.
Invalidation levels. The bullish read weakens if ETC loses the 50-day average near $6.82 and closes back under the $7.36 support, which would reframe the recent rally as a failed bounce. The bearish read breaks on a sustained move above the $8.51 resistance and, more convincingly, a weekly close back over the cycle high near $9.02 — the point at which “still bleeding” becomes “new leg up.” Both triggers are the same levels named in the technical section.
Historical performance
Ethereum Classic’s chart is a story of one mania and long stretches of neglect. Born from the 2016 fork, it traded as a low-priced curiosity for years, then exploded in the 2021 bull run to a record near $176 before collapsing more than 95%. It fell again through the following year, down roughly two-thirds over the twelve months into 2026. ETC has never strung together the compounding recoveries that Bitcoin and Ethereum have; its gains have come in violent, short-lived spikes tied to broad market euphoria, not steady adoption. That pattern, more than any single past price, is what the forecast above is built to respect.
Is Ethereum Classic a good investment in 2026?
Ethereum Classic sells one clean idea: a fixed-supply, proof-of-work version of Ethereum that never rewrote its ledger to undo a hack. For a buyer who values that principle and wants exposure to a hard-capped mining coin, the appeal is real and specific. The counter-argument is just as concrete — ETC has thin network usage, a shrinking share of developer attention, and a price that spikes in bull markets then fades for years. PrimeXBT’s outlook sees a cyclical recovery into 2028 followed by a give-back, not a durable re-rating. Whether that profile reads as a cheap cyclical bet or a value trap depends on how much weight a reader puts on the store-of-value story versus real on-chain demand.
How to trade crypto on PrimeXBT
PrimeXBT lets you take a position on major crypto assets in either direction through CFDs, which can be traded long or short without holding the underlying coin — useful when a market can spike and fade as sharply as ETC’s history shows. Leverage amplifies gains and losses alike, so position sizing, a stop-loss, and an awareness of volatility matter on every trade. Trade on your own analysis and risk tolerance, and never risk more than you can afford to lose.
Trading involves risk.
How we build this forecast
This outlook is assembled by PrimeXBT’s analysts, not lifted from a single price screen. The starting point is where ETC actually trades, read against its 50- and 200-day averages and the support and resistance levels traders are defending now. Onto that we layer the fundamentals specific to this coin — a hard-capped, miner-secured supply set against thin smart-contract demand — and the macro backdrop, chiefly US rate policy and overall risk appetite. Near-term ranges lean on the technical read; the longer-dated figures lean on the shape of past cycles, because little else is available that far out.
None of it is a promise. ETC is lightly traded next to the majors, its price can jump on mining news or a single large holder, and one macro shock can outrun any number here. Treat every figure as a considered estimate, not a guarantee — we revisit and update this outlook monthly as the data changes.
Author



 Risk Disclaimer
The content provided here is for informational purposes only. It is not intended as personal investment advice and does not constitute a solicitation or invitation to engage in any financial transactions, investments, or related activities. Past performance is not a reliable indicator of future results.
The financial products offered by the Company are complex and come with a high risk of losing money rapidly due to leverage. These products may not be suitable for all investors. Before engaging, you should consider whether you understand how these leveraged products work and whether you can afford the high risk of losing your money.
The Company does not accept clients from the Restricted Jurisdictions as indicated in our website/ T&C. Some services or products may not be available in your jurisdiction.
The applicable legal entity and its respective products and services depend on the client’s country of residence and the entity with which the client has established a contractual relationship during registration.