
 13 min read
 Fetch.ai (FET) trades near $0.17 in late August 2026, roughly 95% below the $3.47 record it set in March 2024. FET is the token of the Artificial Superintelligence Alliance, the network Fetch.ai formed by merging its token with SingularityNET and Ocean Protocol to build decentralized infrastructure for autonomous AI agents. This page lays out PrimeXBT’s price outlook for FET through 2030 and out to 2050, the levels traders are watching now, and the catalysts that could move it. Figures are given as ranges rather than decimal-point targets, and where the picture is genuinely uncertain the text says so.
Fetch.ai outlook at a glance
- 2026 base case: roughly $0.17–$0.22 into year-end, a stabilization year rather than a fresh bull run.
- Main bullish catalyst: Fed rate cuts reviving risk appetite, renewed demand for the AI-agent narrative, and the ASI:Chain mainnet lifting real network usage.
- Biggest downside risk: the AI-token rotation fades and FET closes below the $0.147 support that lines up with its 50-day average.
- Long-term view: a gradual recovery is the base case, but anything past 2030 reads as a broad scenario, not a target.
Live Fetch.ai price chart
The chart below tracks FET/USD in real time; the levels that matter right now are covered in the technical section further down.
Trading involves risk.
Fetch.ai price prediction 2026–2030 (yearly forecast)
The table sets our expected range for each year. The more bullish multi-year targets floating around the market rest on far heavier adoption assumptions and diverge sharply, so they are kept in the analyst section rather than blended in here.
| Year | Minimum | Average | Maximum |
|---|---|---|---|
| 2026 | $0.1619 | $0.1903 | $0.2239 |
| 2027 | $0.1987 | $0.3081 | $0.4630 |
| 2028 | $0.3704 | $0.4783 | $0.5921 |
| 2029 | $0.3188 | $0.4238 | $0.5307 |
| 2030 | $0.2774 | $0.3805 | $0.4788 |
Fetch.ai price prediction 2026
Our 2026 outlook keeps FET close to its late-August level of about $0.17, in a band of roughly $0.1619–$0.2239 averaging near $0.19 — no return to the 2024 high. The read is a token that has stopped falling but has not yet turned, consolidating above its 50-day average while capped below its 200-day.
For the rest of 2026, our month-by-month view holds FET in a tight, slightly rising band:
| Month (2026) | Minimum | Average | Maximum |
|---|---|---|---|
| August | $0.1619 | $0.1760 | $0.1901 |
| September | $0.1678 | $0.1830 | $0.1982 |
| October | $0.1736 | $0.1900 | $0.2064 |
| November | $0.1799 | $0.1975 | $0.2151 |
| December | $0.1861 | $0.2050 | $0.2239 |
Fetch.ai price prediction 2027
2027 is the recovery year. The path climbs from the low-$0.20s early on toward the high-$0.30s by December, a full-year range of about $0.1987–$0.4630 averaging near $0.30. The step up leans on firmer agent-network usage and a warmer macro backdrop, not a single event.
| Month (2027) | Minimum | Average | Maximum |
|---|---|---|---|
| January | $0.1987 | $0.2196 | $0.2406 |
| February | $0.2112 | $0.2342 | $0.2573 |
| March | $0.2236 | $0.2488 | $0.2741 |
| April | $0.2359 | $0.2635 | $0.2910 |
| May | $0.2481 | $0.2781 | $0.3080 |
| June | $0.2603 | $0.2927 | $0.3251 |
| July | $0.2747 | $0.3100 | $0.3453 |
| August | $0.2914 | $0.3300 | $0.3686 |
| September | $0.3080 | $0.3500 | $0.3920 |
| October | $0.3245 | $0.3700 | $0.4155 |
| November | $0.3408 | $0.3900 | $0.4392 |
| December | $0.3570 | $0.4100 | $0.4630 |
Fetch.ai price prediction 2028
2028 holds the cycle high in our model. The path peaks mid-year near $0.52 before easing, for a range of about $0.3704–$0.5921 and an average near $0.48. If the AI-agent thesis is going to reprice FET this decade, our outlook places that top in this window — and still well short of the 2024 record.
| Month (2028) | Minimum | Average | Maximum |
|---|---|---|---|
| January | $0.3704 | $0.4269 | $0.4834 |
| February | $0.3838 | $0.4438 | $0.5039 |
| March | $0.3970 | $0.4608 | $0.5246 |
| April | $0.4101 | $0.4777 | $0.5453 |
| May | $0.4231 | $0.4946 | $0.5661 |
| June | $0.4360 | $0.5115 | $0.5871 |
| July | $0.4370 | $0.5145 | $0.5921 |
| August | $0.4262 | $0.5036 | $0.5811 |
| September | $0.4154 | $0.4927 | $0.5700 |
| October | $0.4047 | $0.4818 | $0.5589 |
| November | $0.3941 | $0.4709 | $0.5477 |
| December | $0.3836 | $0.4600 | $0.5364 |
Fetch.ai price prediction 2029
2029 is the cool-down after the peak, a gradual drift lower through the year, ranging about $0.3188–$0.5307 with an average near $0.42.
| Month (2029) | Minimum | Average | Maximum |
|---|---|---|---|
| January | $0.3770 | $0.4538 | $0.5307 |
| February | $0.3706 | $0.4477 | $0.5248 |
| March | $0.3641 | $0.4415 | $0.5190 |
| April | $0.3577 | $0.4354 | $0.5131 |
| May | $0.3513 | $0.4292 | $0.5072 |
| June | $0.3450 | $0.4231 | $0.5012 |
| July | $0.3397 | $0.4182 | $0.4967 |
| August | $0.3355 | $0.4145 | $0.4936 |
| September | $0.3313 | $0.4109 | $0.4906 |
| October | $0.3271 | $0.4073 | $0.4875 |
| November | $0.3229 | $0.4036 | $0.4844 |
| December | $0.3188 | $0.4000 | $0.4812 |
Fetch.ai price prediction 2030
Our 2030 view spans roughly $0.2774–$0.4788, averaging near $0.38. Five years out the outlook rests on trajectory more than precision, so read the month-by-month path below as a shape rather than a set of dated targets.
| Month (2030) | Minimum | Average | Maximum |
|---|---|---|---|
| January | $0.3151 | $0.3969 | $0.4788 |
| February | $0.3114 | $0.3938 | $0.4763 |
| March | $0.3078 | $0.3908 | $0.4737 |
| April | $0.3042 | $0.3877 | $0.4712 |
| May | $0.3006 | $0.3846 | $0.4686 |
| June | $0.2970 | $0.3815 | $0.4661 |
| July | $0.2936 | $0.3786 | $0.4637 |
| August | $0.2903 | $0.3759 | $0.4615 |
| September | $0.2871 | $0.3732 | $0.4593 |
| October | $0.2838 | $0.3705 | $0.4571 |
| November | $0.2806 | $0.3677 | $0.4549 |
| December | $0.2774 | $0.3650 | $0.4526 |
Fetch.ai long-term price prediction: 2035, 2040–2050
Numbers this far out are more scenario than forecast. No model can price a decade of AI progress, halving-driven crypto cycles, and macro regimes that do not exist yet, so treat the figures below as a rough trajectory whose error bars widen every year. With that stated plainly, our long-range path trends higher in steady steps rather than a vertical melt-up:
| Year | Minimum | Average | Maximum |
|---|---|---|---|
| 2035 | $0.4320 | $0.6000 | $0.7680 |
| 2040 | $0.6270 | $0.9500 | $1.2730 |
| 2050 | $0.9280 | $1.6000 | $2.2720 |
What analysts and models say (compared)
Few tokens split forecasters as widely as FET. Naive calculator tools project it barely moving, algorithmic aggregators cluster in the tens of cents to low dollars, and scenario models sketch a return to several dollars by 2030. Averaging outputs built on incompatible assumptions would mislead, so they sit side by side.
| Source | Method | Fetch.ai view |
|---|---|---|
| CoinCodex | Algorithmic | 2026 range ~$0.16–$0.82, end-2026 near $0.70; 2030 near $0.54 |
| Changelly | Algorithmic | 2026 avg ~$0.30, 2028 ~$0.66, 2030 ~$1.45, 2040 ~$2.18 |
| Coincub | Scenario model | 2026 base $0.34, 2028 base $1.93, 2030 base $6.78 (bull $12.45) |
| Kraken (ROI tool) | Fixed-rate calculator | ~$0.17 in 2026 to ~$0.21 by 2030 at a 5% default growth input |
| CoinDataFlow | Algorithmic | Bearish, around $0.12 through 2026 |
The spread is the point. The gap between a $0.12 model and a $6.78 one is not a rounding difference — it is a disagreement about whether autonomous AI agents become paying infrastructure or stay a pitch. Our own ranges sit deliberately in the grounded middle, closer to the algorithmic cluster than to the multi-dollar scenarios, because the on-chain demand to justify those higher paths has not shown up yet. Anyone hunting a single consensus number for FET will not find one.
Track record of this forecast
This is the first published PrimeXBT price forecast for Fetch.ai. From the next monthly review onward, this section will set the previous forecast against FET’s actual price on the update date and explain any miss rather than smoothing it over.
Fetch.ai technical analysis
FET sits between its two most-watched moving averages. It trades above the 50-day simple moving average near $0.148, which shows it has rebounded from its summer lows, but below the 200-day average near $0.188, which keeps the longer trend pointed down. The RSI read about 65 in late August — high-neutral rather than overbought — after a rally of roughly 40% over the prior week, and the Fear & Greed Index sat at 73, firmly in “Greed.”
The support and resistance levels that matter now: support at $0.157, then $0.147, with a deeper floor near $0.140; resistance at $0.173, then $0.180 and $0.189. Reclaiming the 200-day line near $0.188 would be the clearest signal that the downtrend has broken. Daily volatility remains high, around 8%, so these levels get tested fast. For a primer on reading them, see PrimeXBT’s guide to crypto technical analysis.
Correlation with other assets
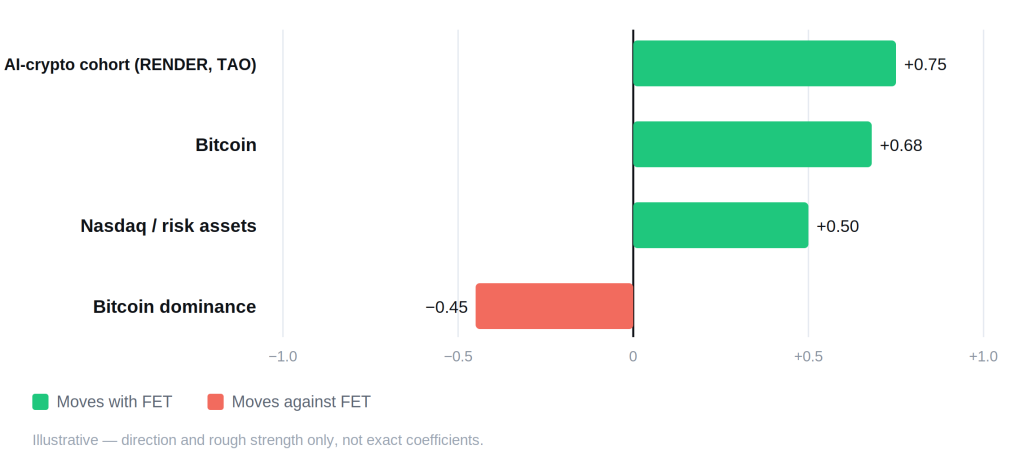
As the largest token in the AI-crypto sector, FET trades with unusually high beta. Its tightest link is to the rest of the agentic-AI cohort — Render (RENDER) and Bittensor (TAO) — which rise and fall together whenever the AI narrative catches or cools. It also tracks Bitcoin closely, since altcoin risk appetite still keys off the majors, and it now moves with the Nasdaq as AI equities and AI tokens increasingly share one story. Against Bitcoin dominance the relationship flips negative: when capital crowds into Bitcoin, thinner AI alts like FET tend to bleed. The wrinkle specific to FET is that a pure-AI catalyst — a model release, an enterprise agent deal — can briefly untether it from Bitcoin in a way payment or base-layer tokens rarely manage. None of these ties are fixed; they drift as the AI trade rotates in and out of favor.
Fundamental factors
FET is no longer just Fetch.ai’s token. On July 1, 2024 it became the unified asset of the Artificial Superintelligence Alliance, absorbing SingularityNET’s AGIX and Ocean Protocol’s OCEAN at fixed conversion rates, with the compute project CUDOS folded in later that year. The merger reset the tokenomics: FET’s maximum supply rose to roughly 2.71 billion, of which about 2.26 billion circulates today. A planned rebrand to an ASI ticker was announced but never finished, so the asset still trades as FET.
The alliance has not held together cleanly. Ocean Protocol withdrew in October 2025, leaving an estimated 270 million OCEAN across some 37,000 wallets unmigrated — a reminder that a token merger is easier to announce than to finish, and a source of latent supply overhang. That wrinkle belongs in any honest read of FET’s market capitalization.
On the product side, Fetch.ai builds autonomous “agents.” Its uAgents framework lets developers deploy software agents that negotiate and transact on their own, and in February 2025 the team shipped ASI-1 Mini, billed as the first Web3-native large language model built for agentic AI. ASI:One, a consumer agent interface, and ASI:Chain, a planned layer-1 targeting mainnet around late 2026, extend the stack. FET is the currency these agents use to pay one another, and holders can stake it to help secure the network — the kind of built-in demand that separates a utility token from a pure speculative asset, if the usage materializes.
Upcoming catalysts
Only confirmed, dated events are listed. Macro policy is the clearest near-term driver, given how closely FET now tracks risk assets.
| Date | Event | Potential impact |
|---|---|---|
| September 15–16, 2026 | FOMC meeting (with economic projections) | Bull if the Fed signals cuts; bear if it holds rates higher for longer |
| October 27–28, 2026 | FOMC meeting | Rate path drives risk appetite across crypto, AI alts most of all |
| December 8–9, 2026 | FOMC meeting (with economic projections) | Year-end policy signal for 2027 positioning |
| Late 2026 / early 2027 (date not yet confirmed) | ASI:Chain mainnet launch | First dedicated layer-1 for the alliance; bullish if it ships, but no firm date announced |
FOMC dates follow the Federal Reserve’s published 2026 schedule. ASI:Chain is listed without a date because none has been confirmed — an estimated launch would be a guess, not information.
Bull case vs bear case
Bull case:
- The Fed pivots to cuts and risk capital rotates back into high-beta AI tokens.
- The agentic-AI narrative reignites, and FET leads its cohort as the sector’s largest name.
- ASI:Chain ships and ASI-1 adoption turns the token into something agents actually spend.
- Staking keeps locking up float, thinning the supply available to sell.
Bear case:
- Rates stay higher for longer and speculative alts stay starved of flows.
- The AI-token trade proves a passing fad and rotates out; FET keeps lagging below its 200-day average.
- Unmigrated OCEAN and scheduled token unlocks add sell pressure.
- Enterprise agent adoption stays a promise rather than revenue.
Invalidation levels. The bull case weakens if FET closes below $0.147, the secondary support that overlaps the 50-day average. The bear case breaks on a sustained move back above the 200-day average near $0.188 — roughly 7% above the late-August price — and, more firmly, a hold above $0.20. The nearer downside trigger, $0.147, sits about 16% below spot.
Historical performance
FET’s chart is one violent cycle, not a steady climb. It traded under a cent in 2020, ran near $0.79 in the 2021 bull market, gave most of it back through 2022, then spiked to $3.47 in March 2024 on the first wave of AI-token mania and the alliance merger. By late August 2026 it changes hands near $0.17, about 95% below that peak and below its own 200-day average. The pattern rewards patience and punishes chasing tops, though no cycle owes the last one a repeat.
Is Fetch.ai a good investment in 2026?
FET is a concentrated bet on one idea: that autonomous AI agents become real infrastructure and that FET is the token they run on. Our outlook sees it grinding sideways-to-higher rather than exploding — a roughly $0.19 average for 2026 — with the cyclical high not arriving until 2028 and still well below the old record. The bullish reading is that FET is the largest pure-play name in a sector with genuine momentum; the bearish one is that AI-token demand is narrative-driven and thin, and the merger the token is built on has already shed a member. A reader who believes agentic AI pays off over years, and can stomach 90%-plus drawdowns along the way, will weigh that against someone trading the next quarter — which is where position sizing matters more than any single forecast.
How to trade Fetch.ai on PrimeXBT
On PrimeXBT you can take a position on Fetch.ai in either direction. CFDs on FET trade long or short, so a view that it falls is as tradable as a view that it climbs — see the primer on short selling for how the downside side works. Leverage cuts both ways, enlarging losses as fast as gains, so position sizing and a stop-loss earn their keep on a token this volatile. Trade on your own analysis and risk tolerance, and never risk more than you can afford to lose.
Trading involves risk.
How we build this forecast
This outlook is assembled by PrimeXBT’s analysts, not pulled from a single price feed. We start with where FET trades today, read it against the 50- and 200-day averages and the nearby support and resistance, weigh the fundamentals — the ASI merger’s tokenomics, agent-network adoption, staking demand — and set the lot against the macro backdrop, above all the path of U.S. interest rates. The yearly ranges blend that technical read with the fundamental and macro picture; the long-range numbers lean on trajectory rather than precision.
None of it is a promise. FET is volatile, the inputs shift, and one AI headline or macro surprise can move it faster than any model expects. Treat every figure here as a considered estimate, not a guarantee — we revisit and update this outlook monthly as the data changes.
How much will Fetch.ai be worth in 2026?
Our outlook centers on roughly $0.17–$0.22 for 2026, averaging near $0.19 — a stabilization year rather than a breakout.
How much will Fetch.ai be worth in 2030?
Our 2030 view runs about $0.30–$0.49, averaging near $0.38. Read a five-year figure as a direction, not a fixed target; the plausible spread is wide.
What will Fetch.ai be worth in five years?
See 2030 above. On that horizon the honest answer is a range, because a single number implies a precision the data cannot support.
Can Fetch.ai reach $1?
Not on our base case this decade — our modeled peak is near $0.58 in mid-2028, and $1 only comes into view in our long-range 2040s scenarios. Getting there sooner would take a stronger AI-token cycle than the current picture shows.
What is the Artificial Superintelligence Alliance, and is FET the same as ASI?
FET is the merged token of the Artificial Superintelligence Alliance, which combined Fetch.ai, SingularityNET and Ocean Protocol in 2024, with CUDOS added later. A planned rebrand to an ASI ticker was never completed, so the asset still trades as FET.
Author



 Risk Disclaimer
The content provided here is for informational purposes only. It is not intended as personal investment advice and does not constitute a solicitation or invitation to engage in any financial transactions, investments, or related activities. Past performance is not a reliable indicator of future results.
The financial products offered by the Company are complex and come with a high risk of losing money rapidly due to leverage. These products may not be suitable for all investors. Before engaging, you should consider whether you understand how these leveraged products work and whether you can afford the high risk of losing your money.
The Company does not accept clients from the Restricted Jurisdictions as indicated in our website/ T&C. Some services or products may not be available in your jurisdiction.
The applicable legal entity and its respective products and services depend on the client’s country of residence and the entity with which the client has established a contractual relationship during registration.








