14 min read
 Gala (GALA) trades near $0.0019 in late August 2026, roughly 99.8% below the record high it set in November 2021. GALA is the utility token of Gala, a Web3 gaming and entertainment ecosystem: it pays for transactions on GalaChain, the project’s own layer-1 network, buys in-game NFT items, and rewards the node operators who run the chain. This page lays out PrimeXBT’s price outlook for GALA through 2030 and out to 2050, the technical levels traders are watching now, and the catalysts that could move it. Figures are given as ranges, not decimal-perfect targets, and where the picture is genuinely speculative — as it is for most small-cap gaming tokens — the text says so plainly.
Gala outlook at a glance
- 2026 base case: $0.0017–$0.0023, a year of consolidation near current levels rather than a breakout.
- Main bullish catalyst: a fresh GameFi narrative cycle plus real user growth across GalaChain games, set against an easing Fed.
- Biggest downside risk: thin gaming-token liquidity and a sustained break below the $0.001700 support, which would open the door to new multi-year lows.
- Long-term view: a slow, uneven recovery is the base case, but every figure beyond 2030 is a direction of travel, not a promise — a token that has fallen this far carries real project risk.
Live Gala price chart
The chart below tracks GALA in real time; the levels that matter right now are set out in the technical section further down. GALA/USD is not currently listed for trading on PrimeXBT.
Trading involves risk.
Gala price prediction 2026–2030 (yearly forecast)
The table gives our expected range for each year. It is built from a single continuous monthly path, so the yearly figures and the month-by-month tables below agree by construction. Third-party algorithmic models — many of which are outright bearish on GALA — are kept separate in the analyst section rather than blended in here.
| Year | Minimum | Average | Maximum |
|---|---|---|---|
| 2026 | $0.00182 | $0.00201 | $0.00222 |
| 2027 | $0.00198 | $0.00242 | $0.00310 |
| 2028 | $0.00269 | $0.00327 | $0.00386 |
| 2029 | $0.00225 | $0.00276 | $0.00337 |
| 2030 | $0.00207 | $0.00250 | $0.00290 |
Gala price prediction 2026
Our 2026 outlook keeps GALA close to its late-August level near $0.0019, in a range of about $0.00182–$0.00222 averaging near $0.0020. That is a holding pattern, not a recovery: the token is stabilising above its 50-day average while the broader trend stays down, and nothing in the current data points to a return to the cent-plus prices of 2021.
For the rest of 2026, the month-by-month path drifts gently higher into year-end without clearing resistance:
| Month (2026) | Minimum | Average | Maximum |
|---|---|---|---|
| August | $0.00182 | $0.00194 | $0.00206 |
| September | $0.00185 | $0.00197 | $0.00209 |
| October | $0.00187 | $0.00200 | $0.00213 |
| November | $0.00191 | $0.00204 | $0.00217 |
| December | $0.00194 | $0.00208 | $0.00222 |
Gala price prediction 2027
2027 is where a modest recovery could begin, with the path working up toward roughly $0.0026 by December for a full-year range of about $0.00198–$0.00310 and an average near $0.0024. The move depends on GameFi regaining attention and on GalaChain games converting players into on-chain activity, not on a single announcement.
| Month (2027) | Minimum | Average | Maximum |
|---|---|---|---|
| January | $0.00198 | $0.00212 | $0.00227 |
| February | $0.00201 | $0.00216 | $0.00232 |
| March | $0.00205 | $0.00220 | $0.00236 |
| April | $0.00208 | $0.00225 | $0.00241 |
| May | $0.00211 | $0.00229 | $0.00246 |
| June | $0.00215 | $0.00233 | $0.00251 |
| July | $0.00221 | $0.00240 | $0.00258 |
| August | $0.00229 | $0.00249 | $0.00269 |
| September | $0.00236 | $0.00258 | $0.00279 |
| October | $0.00244 | $0.00267 | $0.00289 |
| November | $0.00252 | $0.00276 | $0.00300 |
| December | $0.00260 | $0.00285 | $0.00310 |
Gala price prediction 2028
2028 holds the cycle high in our outlook. The path peaks around mid-year before easing back, giving a range of about $0.00269–$0.00386 and an average near $0.0033 — roughly 70% above today, and still a small fraction of a US cent. Placing the top here lines up with the post-halving rhythm that has framed past crypto cycles, but GALA’s own project risks make it a lower-confidence peak than a large-cap would carry.
| Month (2028) | Minimum | Average | Maximum |
|---|---|---|---|
| January | $0.00269 | $0.00296 | $0.00322 |
| February | $0.00279 | $0.00307 | $0.00334 |
| March | $0.00288 | $0.00317 | $0.00347 |
| April | $0.00297 | $0.00328 | $0.00359 |
| May | $0.00306 | $0.00339 | $0.00371 |
| June | $0.00315 | $0.00350 | $0.00384 |
| July | $0.00316 | $0.00351 | $0.00386 |
| August | $0.00308 | $0.00343 | $0.00378 |
| September | $0.00300 | $0.00335 | $0.00369 |
| October | $0.00292 | $0.00326 | $0.00361 |
| November | $0.00284 | $0.00318 | $0.00352 |
| December | $0.00276 | $0.00310 | $0.00344 |
Gala price prediction 2029
2029 is the give-back year after the peak: a gradual slide through the twelve months, ranging about $0.00225–$0.00337 with an average near $0.0027. Post-top cool-downs have historically hit high-beta gaming tokens harder than the market, which is why the band stays wide.
| Month (2029) | Minimum | Average | Maximum |
|---|---|---|---|
| January | $0.00270 | $0.00304 | $0.00337 |
| February | $0.00264 | $0.00298 | $0.00331 |
| March | $0.00258 | $0.00292 | $0.00325 |
| April | $0.00252 | $0.00285 | $0.00318 |
| May | $0.00247 | $0.00279 | $0.00312 |
| June | $0.00241 | $0.00273 | $0.00306 |
| July | $0.00236 | $0.00269 | $0.00301 |
| August | $0.00234 | $0.00267 | $0.00299 |
| September | $0.00232 | $0.00265 | $0.00297 |
| October | $0.00229 | $0.00262 | $0.00295 |
| November | $0.00227 | $0.00260 | $0.00293 |
| December | $0.00225 | $0.00258 | $0.00291 |
Gala price prediction 2030
Our 2030 view spans roughly $0.00207–$0.00290, averaging near $0.0025. Five years out, the outlook is a trajectory rather than a set of dated prices, so read the monthly path below as the shape of a slow recovery, not a schedule.
| Month (2030) | Minimum | Average | Maximum |
|---|---|---|---|
| January | $0.00223 | $0.00257 | $0.00290 |
| February | $0.00222 | $0.00256 | $0.00289 |
| March | $0.00220 | $0.00254 | $0.00288 |
| April | $0.00219 | $0.00253 | $0.00288 |
| May | $0.00217 | $0.00252 | $0.00287 |
| June | $0.00216 | $0.00251 | $0.00286 |
| July | $0.00214 | $0.00249 | $0.00285 |
| August | $0.00213 | $0.00248 | $0.00284 |
| September | $0.00211 | $0.00247 | $0.00283 |
| October | $0.00210 | $0.00246 | $0.00282 |
| November | $0.00209 | $0.00245 | $0.00281 |
| December | $0.00207 | $0.00244 | $0.00281 |
Gala long-term price prediction: 2035, 2040–2050
Anything this far out is a scenario, not a forecast. No model can price a decade of GalaChain adoption, gaming-market shifts, token burns, and macro regimes that have not happened yet, so treat the numbers below as a rough direction with error bars that widen every year. On that basis our long-range path grinds higher slowly, and deliberately avoids the hockey-stick curves some GALA models publish for 2040 and beyond:
| Year | Minimum | Average | Maximum |
|---|---|---|---|
| 2035 | $0.00288 | $0.00360 | $0.00432 |
| 2040 | $0.00385 | $0.00520 | $0.00655 |
| 2050 | $0.00541 | $0.00820 | $0.01099 |
What analysts and models say (compared)
Independent GALA forecasts skew bearish, and they disagree sharply on the back half of the decade. Algorithmic models cluster near current levels for 2026, then split: some project a grind lower into 2028–2030, others a recovery. Averaging incompatible models would flatter the picture, so they are laid out side by side.
| Source | Method | GALA view |
|---|---|---|
| CoinCodex | Algorithmic | 2026 avg ~$0.0017; falling to ~$0.0005 by 2030 (about −73% over the window) |
| Changelly | Algorithmic | 2026 avg ~$0.0019; ~$0.0004 by 2030, recovering toward ~$0.0024 by 2040 |
| CoinGape | Algorithmic | 2026 avg ~$0.0024; dip to ~$0.0006 in 2028, then ~$0.0025 by 2030 and ~$0.015 by 2040 |
| MEXC | Flat-growth model | ~$0.0019 in 2026 rising to ~$0.0023 by 2030 on a default 5% annual rate |
The disagreement is the signal. CoinCodex and Changelly both model GALA drifting lower for years; CoinGape sees a sharp 2028 trough followed by a rebound; MEXC’s number is a mechanical 5% compounding, not a market call. No consensus number exists, which is itself worth knowing before treating any single target as fact.
Track record of this forecast
This is the first published PrimeXBT price forecast for Gala. From the next monthly review onward, this section will set the previous forecast against GALA’s actual price on the update date and account for any miss instead of quietly revising it away.
Gala technical analysis
GALA sits between its two key moving averages. It trades just above its 50-day simple moving average near $0.001894, which shows short-term stabilisation, but well below its 200-day average near $0.002890 — a gap of roughly 50% that marks the longer trend as still down. The RSI reads about 56 on the 14-day, neutral with a slight upward lean, while the broader crypto Fear & Greed Index sits in “Greed” near 73 — a market-wide reading, not a GALA-specific one.
The support and resistance levels in focus now: support at $0.001865, then $0.001779, with a floor near $0.001700; resistance at $0.002029, then $0.002108, with the 200-day average near $0.002890 as the level that would confirm a genuine trend change. Reclaiming that average is the clearest bullish signal available on the chart today. For the method behind reading these signals, see PrimeXBT’s guide to crypto technical analysis.
Correlation with other assets
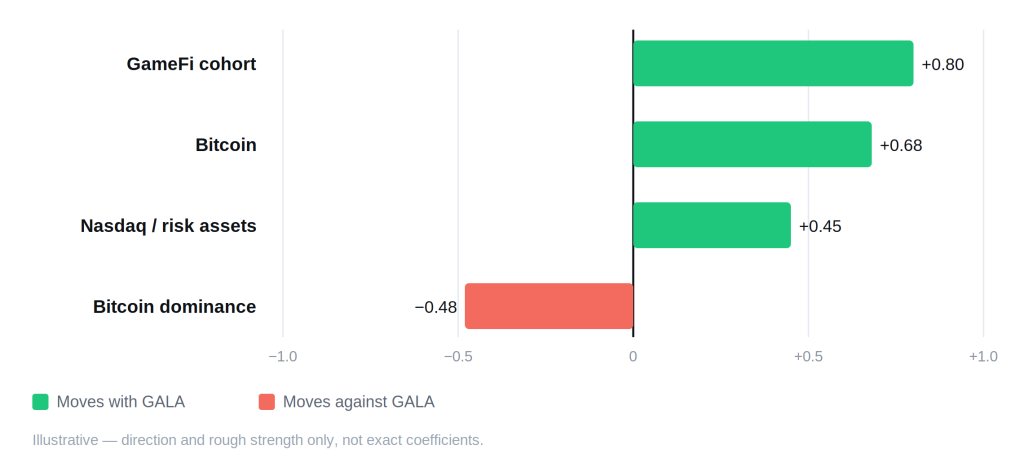
GALA trades first as a GameFi token and only second as a general crypto asset. Its tightest link is to the metaverse and play-to-earn cohort — The Sandbox (SAND) and Decentraland (MANA) alongside Axie Infinity (AXS) — which tend to rally and sell off together whenever the “gaming narrative” rotates in or out of favour. It carries a high beta to Bitcoin: when Bitcoin moves, GALA usually moves further in the same direction. Since institutions entered crypto, it also tracks risk assets like the Nasdaq more closely, which is why Fed policy reaches its price at all. The relationship that hurts most is the inverse one to Bitcoin dominance: when capital crowds into Bitcoin, thin small-cap alts like GALA are usually last to get bid and first to be sold. Read these as behavioural tendencies that ebb and strengthen with the market mood, not as numbers you can set a stop by.
Fundamental factors
Gala runs three arms — Gala Games, Gala Music, and Gala Film — on top of GalaChain, a layer-1 blockchain the project launched in 2024 on Hyperledger Fabric architecture. The network is secured by Founder’s Nodes, capped at 50,000 operators, which are the sole source of new GALA emission and earn daily token rewards for uptime. Flagship titles have included Mirandus, Spider Tanks, and The Walking Dead: Empires, with more games onboarded onto GalaChain over time. The token has genuine utility inside this ecosystem: it pays gas on GalaChain, buys NFT items, and rewards nodes.
Supply is close to its ceiling. GALA’s max supply is 50 billion, and roughly 49.6 billion already circulates, so future inflation is limited — daily emission is set at 0.25% of the shrinking gap between total and max supply, a figure that keeps falling as the two converge. Two burn channels remove tokens: gas spent on GalaChain and GALA used to buy in-ecosystem NFTs. In May 2023 the team migrated to a new contract and burned about 21 billion tokens, worth roughly $660 million at the time, to steady the tokenomics.
The project also carries a track record traders should weigh honestly. In May 2024 an attacker with compromised admin access minted 5 billion new GALA — about $240 million at the time — and sold roughly 600 million (near $29 million) before the rest was frozen; CEO Eric Schiermeyer said the team “messed up” its internal controls and contained the breach within 45 minutes. Separately, in 2023 Gala’s co-founders sued each other, with allegations of a $130 million misappropriation and corporate waste airing in public court filings. Neither episode is priced into a chart, but both belong in any sober read of GALA’s risk.
Upcoming catalysts
Only confirmed, dated events are listed. Because GALA now tracks risk assets, U.S. monetary policy is the clearest near-term driver on the calendar.
| Date | Event | Potential impact |
|---|---|---|
| September 15–16, 2026 | FOMC meeting (with economic projections) | Bull if the Fed signals cuts; bear if it holds rates higher for longer |
| October 27–28, 2026 | FOMC meeting | Rate path steers risk appetite across small-cap crypto |
| December 8–9, 2026 | FOMC meeting (with economic projections) | Year-end policy signal that frames 2027 positioning |
| 2026 (date not confirmed) | Further GalaChain game launches and ecosystem releases | Player growth could lift on-chain GALA demand; no firm mainnet date announced |
FOMC dates follow the Federal Reserve’s published 2026 schedule. Gala’s ecosystem releases are listed without dates because none has been confirmed — an invented launch date would be a guess, not information.
Bull case vs bear case
Bull case:
- A new GameFi cycle pulls speculative capital back into gaming and metaverse tokens, where GALA has high beta.
- GalaChain games convert players into recurring on-chain activity, turning gas and NFT burns into steady demand.
- Near-exhausted emission caps future inflation, so real adoption meets a supply that barely grows.
- An easing Fed lifts risk appetite across small-cap crypto.
Bear case:
- GameFi stays out of favour and GALA keeps bleeding against Bitcoin, stuck below its 200-day average.
- Thin liquidity amplifies drawdowns, and another security or governance shock revives 2023–2024 memories.
- Algorithmic models that project sub-$0.001 prices by 2028–2030 prove right.
- Rates stay higher for longer, keeping speculative alts under pressure.
Invalidation levels. The bull case weakens if GALA loses the $0.001700 floor on a sustained basis, since that would expose fresh multi-year lows. The bear case is invalidated on a clean reclaim of the 200-day average near $0.002890 — about 50% above the late-August price, and the line that would mark the long downtrend as broken. The near resistance at $0.002029 is the first test on the way there.
Historical performance
GALA’s history is one round-trip, not a staircase. It launched in 2020 as a fraction of a cent, ran to about $0.8367 in November 2021 during the play-to-earn mania, then gave almost all of it back — it now trades roughly 99.8% below that peak. The 2023 contract migration, the 2024 exploit, and the founders’ legal fight all landed during the long decline. A token that has round-tripped this hard can still find a second life, but a recovery would have to be earned by adoption, not inherited from the last cycle.
Is Gala a good investment in 2026?
GALA is a speculative bet on Web3 gaming reaching mainstream players, priced accordingly. Our outlook has it roughly flat into year-end, averaging near $0.0020, with any meaningful upside pushed out to a possible 2028 cycle peak that we hold at low confidence. The bull argument rests on real utility inside a live ecosystem and a supply that has almost stopped growing; the bear argument rests on years of price decline, thin liquidity, and a project history that includes an exploit and a founder lawsuit. Position size and time horizon decide whether that trade-off reads as opportunity or as risk — and small-cap gaming tokens can go to zero in a way large-caps rarely do.
How to trade Gala on PrimeXBT
GALA/USD is not currently available to trade on PrimeXBT, so there is no GALA position to open here. On the assets that are listed, you can take a view in either direction: CFDs can be traded long or short, and short selling lets you position for a falling price as well as a rising one. Leverage magnifies gains and losses alike, so a stop-loss and disciplined position sizing matter on any trade. Trade on your own analysis and risk tolerance, and never risk more than you can afford to lose.
Trading involves risk.
How we build this forecast
PrimeXBT’s analysts assemble this outlook rather than lift it from one price feed. We start from where GALA trades today, read it against the 50- and 200-day moving averages and the live support and resistance levels, weigh the fundamentals — GalaChain adoption, node emission, token burns, and the project’s risk history — and set all of it against the macro backdrop, chiefly the path of U.S. interest rates and the appetite for small-cap crypto. The yearly ranges join that technical read to the fundamental and macro picture; the long-range figures lean on trajectory over precision.
None of this is a guarantee. GALA is a thinly traded gaming token, the inputs shift, and one exploit, listing, or narrative swing can move it faster than any model expects. Treat every figure here as a considered estimate, not a promise — we revisit the outlook monthly as the data changes.
Author



 Risk Disclaimer
The content provided here is for informational purposes only. It is not intended as personal investment advice and does not constitute a solicitation or invitation to engage in any financial transactions, investments, or related activities. Past performance is not a reliable indicator of future results.
The financial products offered by the Company are complex and come with a high risk of losing money rapidly due to leverage. These products may not be suitable for all investors. Before engaging, you should consider whether you understand how these leveraged products work and whether you can afford the high risk of losing your money.
The Company does not accept clients from the Restricted Jurisdictions as indicated in our website/ T&C. Some services or products may not be available in your jurisdiction.
The applicable legal entity and its respective products and services depend on the client’s country of residence and the entity with which the client has established a contractual relationship during registration.