
 14 min read
 HBAR is the native token of Hedera, an enterprise-focused public network that settles transactions on a hashgraph rather than a conventional blockchain. The token pays network fees, secures the network through staking, and powers the tokenized-asset and stablecoin activity that Hedera is built for. In late August 2026 HBAR trades near $0.073, still about 87% below the record it set in the 2021 bull market. This page lays out PrimeXBT’s price outlook for HBAR through 2030 and out to 2050, the levels traders are watching now, and the events that could move it. Where the data runs thin, the text says so rather than inventing a number.
HBAR outlook at a glance
- 2026 base case: a recovery-in-progress rather than a breakout, with the year averaging near $0.076.
- Main bullish catalyst: steady inflows into the spot HBAR ETF and fresh enterprise and tokenization deals pulling real usage onto the network.
- Biggest downside risk: a sustained close below the $0.07 support cluster, which would reopen the lows and stall the recovery.
- Long-term view: the path trends higher into a projected 2028 cycle peak, though anything past 2030 is a direction of travel, not a dated target.
Live HBAR price chart
The live chart below tracks HBAR/USD in real time; the support and resistance levels that matter right now are laid out in the technical section further down.
Trading involves risk.
HBAR price prediction 2026–2030 (yearly forecast)
The table below sets our expected range for HBAR each year from 2026 to 2030. Longer-horizon targets from third-party models, which rest on very different assumptions, are kept in the analyst-comparison section rather than blended into our own numbers.
| Year | Minimum | Average | Maximum |
|---|---|---|---|
| 2026 | $0.069 | $0.076 | $0.086 |
| 2027 | $0.078 | $0.111 | $0.152 |
| 2028 | $0.127 | $0.158 | $0.186 |
| 2029 | $0.127 | $0.155 | $0.181 |
| 2030 | $0.118 | $0.150 | $0.178 |
HBAR price prediction 2026
Our 2026 outlook holds HBAR close to its late-August level near $0.073, giving a forward-looking range of $0.069–$0.086 and an average near $0.076. That reads as a base being rebuilt after a long drawdown, not the start of a new leg up — the token is repairing structure around $0.07 rather than trending.
For the remaining months of 2026, our month-by-month view keeps HBAR in a narrow, slightly rising band as the spot-ETF bid absorbs supply and sentiment leans mildly greedy:
| Month (2026) | Minimum | Average | Maximum |
|---|---|---|---|
| August | $0.069 | $0.073 | $0.077 |
| September | $0.070 | $0.074 | $0.079 |
| October | $0.071 | $0.076 | $0.081 |
| November | $0.073 | $0.078 | $0.083 |
| December | $0.074 | $0.080 | $0.086 |
HBAR price prediction 2027
2027 is where the recovery gains traction: our range runs to $0.078–$0.152 with an average near $0.11, a climb that leans on wider tokenization usage and a friendlier macro backdrop rather than one headline. The step up is gradual, month over month, not a vertical move.
| Month (2027) | Minimum | Average | Maximum |
|---|---|---|---|
| January | $0.078 | $0.085 | $0.091 |
| February | $0.082 | $0.089 | $0.096 |
| March | $0.086 | $0.094 | $0.101 |
| April | $0.090 | $0.098 | $0.106 |
| May | $0.094 | $0.103 | $0.112 |
| June | $0.098 | $0.108 | $0.117 |
| July | $0.102 | $0.113 | $0.123 |
| August | $0.107 | $0.118 | $0.128 |
| September | $0.111 | $0.123 | $0.134 |
| October | $0.115 | $0.128 | $0.140 |
| November | $0.120 | $0.133 | $0.146 |
| December | $0.124 | $0.138 | $0.152 |
HBAR price prediction 2028
2028 carries the cycle high in our model. The range spans $0.127–$0.186 with an average near $0.158, and the path peaks around the middle of the year before easing into December. If HBAR is going to test its old highs this decade, our outlook places the best odds in this window.
| Month (2028) | Minimum | Average | Maximum |
|---|---|---|---|
| January | $0.127 | $0.142 | $0.157 |
| February | $0.131 | $0.147 | $0.163 |
| March | $0.134 | $0.151 | $0.168 |
| April | $0.138 | $0.155 | $0.173 |
| May | $0.141 | $0.160 | $0.178 |
| June | $0.144 | $0.164 | $0.183 |
| July | $0.145 | $0.165 | $0.186 |
| August | $0.144 | $0.164 | $0.185 |
| September | $0.142 | $0.163 | $0.184 |
| October | $0.141 | $0.162 | $0.183 |
| November | $0.140 | $0.161 | $0.182 |
| December | $0.138 | $0.160 | $0.182 |
HBAR price prediction 2029
2029 is the give-back year after the peak — a measured drift lower rather than a crash. Our range covers $0.127–$0.181 with an average near $0.154, the kind of cooling that tends to follow a cyclical top once early buyers take profit.
| Month (2029) | Minimum | Average | Maximum |
|---|---|---|---|
| January | $0.137 | $0.159 | $0.181 |
| February | $0.136 | $0.158 | $0.180 |
| March | $0.135 | $0.157 | $0.180 |
| April | $0.133 | $0.156 | $0.179 |
| May | $0.132 | $0.155 | $0.179 |
| June | $0.131 | $0.154 | $0.178 |
| July | $0.130 | $0.154 | $0.178 |
| August | $0.129 | $0.153 | $0.178 |
| September | $0.129 | $0.153 | $0.178 |
| October | $0.128 | $0.153 | $0.178 |
| November | $0.127 | $0.152 | $0.178 |
| December | $0.127 | $0.152 | $0.177 |
HBAR price prediction 2030
Our 2030 view flattens out, spanning $0.118–$0.178 with an average near $0.15 as the market finds a new equilibrium. Read the month-by-month path below as a trajectory: by this point the error bars are wide enough that the shape of the curve says more than any single cell.
| Month (2030) | Minimum | Average | Maximum |
|---|---|---|---|
| January | $0.126 | $0.152 | $0.178 |
| February | $0.125 | $0.151 | $0.178 |
| March | $0.125 | $0.151 | $0.178 |
| April | $0.124 | $0.151 | $0.178 |
| May | $0.123 | $0.150 | $0.178 |
| June | $0.123 | $0.150 | $0.178 |
| July | $0.122 | $0.150 | $0.178 |
| August | $0.121 | $0.149 | $0.178 |
| September | $0.120 | $0.149 | $0.178 |
| October | $0.120 | $0.149 | $0.178 |
| November | $0.119 | $0.148 | $0.178 |
| December | $0.118 | $0.148 | $0.178 |
HBAR long-term price prediction: 2035, 2040–2050
Put a decade between now and the forecast and precision quietly disappears. No model can price the enterprise-adoption curve, the regulatory rulebook, and the macro cycles that will actually decide where HBAR sits in 2040, so treat the figures below as a slow upward drift rather than milestones with dates attached. On that basis our long-range path averages near $0.18 in 2035, near $0.24 in 2040, and near $0.36 in 2050 — a steady grind, never a hockey stick:
| Year | Minimum | Average | Maximum |
|---|---|---|---|
| 2035 | $0.137 | $0.180 | $0.223 |
| 2040 | $0.168 | $0.240 | $0.312 |
| 2050 | $0.216 | $0.360 | $0.504 |
What analysts and models say (compared)
HBAR forecasts sit far apart, and the gap itself is the useful information. Algorithmic aggregators cluster their 2026 averages between roughly $0.07 and $0.12, while more bullish models stretch toward $0.18; longer-dated 2030 figures range from about $0.15 to $0.23. Averaging numbers built on incompatible methods would flatter the picture, so they are laid out side by side instead.
| Source | Method | HBAR view |
|---|---|---|
| CoinCodex | Algorithmic | 2026 avg ~$0.12 (range ~$0.072–$0.173); 2030 avg ~$0.15 |
| Changelly | Algorithmic | 2026 avg ~$0.085 (range ~$0.060–$0.110); 2030 avg ~$0.157 |
| CoinDataFlow | Algorithmic | 2026 near ~$0.067 (bearish extrapolation of the current trend) |
| Binance research page | Algorithmic | 2026 ~$0.177; 2030 ~$0.226 |
| Cryptonews compilation | Editorial roundup | 2026 avg ~$0.076; 2030 avg ~$0.15 |
Unlike Bitcoin or Ethereum, HBAR has no roster of bank price targets to quote — the named institutional conviction here is a product, not a forecast. In October 2025 Canary Capital launched a spot HBAR ETF (Nasdaq: HBR), the first US exchange-traded fund giving regulated exposure to the token. Its steady absorption of circulating supply is the closest thing HBAR has to an institutional vote, and it is a flow to watch rather than a price call.
Track record of this forecast
This is the first published PrimeXBT price forecast for HBAR. From the next monthly review onward, this section will set the previous forecast against HBAR’s actual price on the update date and explain any miss plainly instead of quietly moving the goalposts.
HBAR technical analysis
HBAR sits between its two most-watched moving averages at the time of writing. It trades below the 200-day simple moving average near $0.085 — the longer trend has not yet turned up — but holds above the 50-day average near $0.069, which shows the token has recovered off its local lows. The RSI reads around 60, neutral-to-firm, with no overbought or oversold extreme, and the crypto Fear & Greed Index has drifted into “Greed” in the low 60s.
The support and resistance levels that matter now: a dense support cluster around $0.07, with a deeper demand zone toward $0.06; resistance stacked at $0.08, then $0.09. Price has been building a double bottom on the $0.07 floor, and a clean break above $0.08 on real volume would open the measured target near $0.09 — which is also where the 200-day average waits. Reclaiming that line would be the clearest sign the longer downtrend has broken. For a primer on reading these signals, see PrimeXBT’s guide to crypto technical analysis.
Correlation with other assets
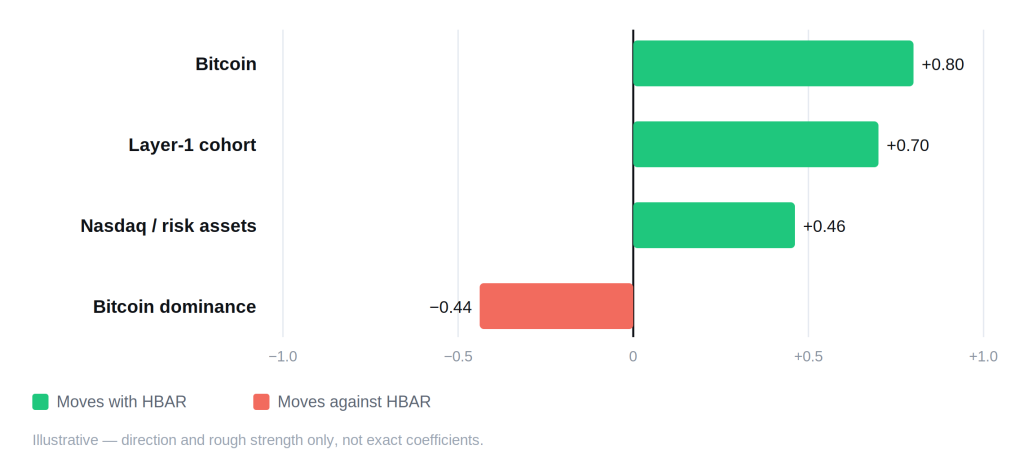
HBAR trades as a high-beta member of the layer-1 pack. When Bitcoin turns, HBAR tends to turn harder in the same direction, and it rises and falls with the wider alt cohort rather than on its own schedule. Its weak spot is Bitcoin dominance: when capital crowds back into Bitcoin, HBAR is among the first names to bleed, and it only outperforms once money rotates down the risk curve into alts. Where HBAR breaks from the herd is on its own storylines — new Governing Council members, real-world-asset and tokenization deals, and anything touching the spot ETF can move it independently of the broader tape. Since the market institutionalized, HBAR has also tracked risk assets like the Nasdaq more closely, so US rate decisions land on it quickly. There is no meaningful gold or dollar-index story to speak of. None of these links is fixed; they tighten and loosen as the market’s mood changes.
Fundamental factors
Hedera is not a blockchain. It runs on hashgraph, a directed-acyclic-graph consensus that reaches asynchronous Byzantine fault tolerance — the strongest security class in distributed systems — while settling thousands of transactions a second with fast finality and low, predictable fees. That engineering profile is the pitch to enterprises that need throughput and cost certainty, not just decentralization for its own sake.
Governance is Hedera’s real signature. The network is run by the Hedera Governing Council, a body designed to hold up to 39 large organizations, with roughly 31 seats filled by names such as Google, IBM, Boeing, LG Electronics, Deutsche Telekom, Dell, Standard Bank, Chainlink Labs and Ubisoft. Members serve fixed, term-limited seats, which is meant to stop any single company entrenching control. No other major layer-1 has quite this composition of blue-chip operators running its nodes.
On top of that base sit the pieces that drive demand: the Hedera Token Service for issuing tokens and stablecoins cheaply, EVM-compatible smart contracts that let Ethereum developers deploy with little friction, and a growing tilt toward tokenizing real-world assets. In 2024 Hedera contributed its core network code to Hiero, an open-source project under the Linux Foundation’s Decentralized Trust, moving development into neutral, community-governed hands. HBAR holders can also stake to help secure the network and earn rewards, which locks up float.
Supply is the counterweight. HBAR has a fixed maximum of 50 billion tokens, with roughly 43.8 billion circulating; the rest sits in a treasury held by Hedera and released on a schedule. That overhang is a genuine dilution factor — new supply reaches the market on a timetable, not on demand — and it is one reason HBAR has to grow real usage faster than the emission just to hold its price. The spot HBAR ETF cuts the other way, pulling tokens off the market and into a regulated wrapper.
Upcoming catalysts
Only confirmed, dated events are listed. With HBAR now tracking risk assets, US monetary policy is the clearest near-term driver on the calendar.
| Date | Event | Potential impact |
|---|---|---|
| September 15–16, 2026 | FOMC meeting | Bull if the Fed signals cuts; bear if it holds rates higher for longer |
| October 27–28, 2026 | FOMC meeting | Rate path steers risk appetite across the alt cohort |
| December 8–9, 2026 | FOMC meeting | Year-end policy signal that sets the tone for 2027 positioning |
The FOMC dates follow the Federal Reserve’s published 2026 schedule. No Hedera-specific network event — a protocol upgrade, a token unlock, or a new Council seat — has a confirmed public date at the time of writing, so none is listed; an estimated date would be a guess, not information.
Bull case vs bear case
Bull case:
- Spot HBAR ETF inflows keep absorbing supply, tightening the float available to sell.
- Enterprise and tokenization deals convert Hedera’s Governing Council relationships into on-chain volume that the fee model captures.
- The Fed pivots to cuts, and capital rotates back down the risk curve into layer-1 alts like HBAR.
- Price reclaims the 200-day average near $0.09 and turns the long downtrend.
Bear case:
- Bitcoin dominance climbs and the alt cohort bleeds, with HBAR leading the way down.
- Scheduled treasury releases add supply faster than adoption soaks it up.
- Enterprise pilots stay pilots and never scale into fee-generating usage.
- Buyers fail to defend $0.07 and the price slides back toward the $0.06 demand zone.
Invalidation levels. The bull case loses its footing if HBAR closes convincingly below the $0.07 support cluster, roughly 4% under spot, with the deeper $0.06 zone the next line of defense. The bear case is invalidated on a sustained break above $0.08 and, more decisively, a reclaim of the 200-day average near $0.09 — around 23% above the late-August price and the level that would mark the multi-year downtrend as broken. Both triggers come straight from the technical read above.
Historical performance
HBAR’s chart is a story of one big cycle and a long convalescence. After Hedera’s 2019 mainnet launch the token drifted, then ran to a record near $0.5701 in September 2021 before the broad crypto bear market erased most of it — a drawdown of roughly 87% from that peak to where it trades today. The rallies since have been sharp but partial, none reclaiming the old high. A network can rebuild its price the way it rebuilds usage: slowly, and only if the demand is real. Past cycles set the range of what is possible, not what is promised.
Is HBAR a good investment in 2026?
Whether HBAR fits a portfolio comes down to what an investor is buying and for how long. Our numbers see it roughly rebuilding rather than breaking out this year — an average near $0.076 for 2026 — with the real upside case resting on enterprise adoption and ETF flows playing out over years, not weeks. The bull argument is the blue-chip Governing Council and a working tokenization stack; the bear argument is a scheduled supply overhang and a price still pinned below its long-term average. Sentiment currently leans greedy, which cuts both ways. The reader has to weigh a slow, adoption-led thesis against real dilution and decide which they believe.
How to trade HBAR on PrimeXBT
On PrimeXBT you can take a position on HBAR in either direction. CFDs on HBAR can be traded long or short, so a view that the price falls is as tradable as a view that it rises — see the guide to short selling for how that works. Leverage magnifies gains and losses alike, so position sizing and a stop-loss matter on every trade. Trade on your own analysis and risk tolerance, and never risk more than you can afford to lose.
Trading involves risk.
How we build this forecast
This outlook is assembled by PrimeXBT’s analysts, not copied from a single price feed. We start from where HBAR trades today, read its position against the 50- and 200-day moving averages and the support and resistance levels that traders are acting on, weigh the fundamentals — hashgraph throughput, the Governing Council, tokenization demand, the spot-ETF bid, and the treasury supply schedule — and set all of it against the macro backdrop, chiefly the path of US interest rates. The yearly ranges combine that technical read with the fundamental and macro picture; the long-range figures lean on trajectory rather than precision.
None of this is a guarantee. Crypto is volatile, the inputs move, and a single macro or regulatory surprise can push HBAR faster than any model expects. Treat every figure here as a considered estimate rather than a promise, and note that we revisit and update this outlook monthly as the data changes.
How much will HBAR be worth in 2026?
Our outlook averages near $0.076 for 2026, with the year spread across a modest recovery band rather than a breakout.
How much will HBAR be worth in 2030?
Our long-range view centers near $0.15 for 2030. A forecast five years out carries a lot of uncertainty, so treat that as a midpoint, not a promise.
See 2030 above. On this horizon the honest answer is a direction rather than a figure — the plausible range is wide, and enterprise
What will HBAR be worth in five years? adoption and supply releases will decide where inside it HBAR lands.
Will HBAR reach $1?
Not on our numbers. The top of our modeled path this decade sits well under $0.25, and $1 would need a demand cycle far stronger than anything the current picture supports — roughly a 14-fold move from today's price.
Is HBAR a good investment in 2026?
Mixed. The pull is a blue-chip Governing Council, a live spot ETF, and a real tokenization use case; the drag is a scheduled supply overhang and a price still below its long-term average. The case genuinely runs both ways.
Author



 Risk Disclaimer
The content provided here is for informational purposes only. It is not intended as personal investment advice and does not constitute a solicitation or invitation to engage in any financial transactions, investments, or related activities. Past performance is not a reliable indicator of future results.
The financial products offered by the Company are complex and come with a high risk of losing money rapidly due to leverage. These products may not be suitable for all investors. Before engaging, you should consider whether you understand how these leveraged products work and whether you can afford the high risk of losing your money.
The Company does not accept clients from the Restricted Jurisdictions as indicated in our website/ T&C. Some services or products may not be available in your jurisdiction.
The applicable legal entity and its respective products and services depend on the client’s country of residence and the entity with which the client has established a contractual relationship during registration.








