
 13 min read
 Kaspa (KAS) trades around $0.03 in late August 2026, roughly 85% below the record high it set two summers earlier. KAS is the native coin of Kaspa, a proof-of-work Layer-1 that replaces the single blockchain with a BlockDAG — a structure that lets blocks arrive many times a second instead of once every few minutes. This page lays out PrimeXBT’s price outlook for KAS through 2030 and out to 2050, the levels traders are tracking right now, and the catalysts with the clearest claim on the price. Figures appear as ranges, not decimal-point certainties, and where the read is genuinely thin, the text says as much.
Kaspa outlook at a glance
- 2026 base case: $0.0287–$0.0385, a year of basing near current levels rather than a fresh trend.
- Main bullish catalyst: the Kasplex zkEVM Layer-2 turning Kaspa into a smart-contract chain, paired with Fed rate cuts feeding risk appetite across proof-of-work names.
- Biggest downside risk: a higher-for-longer rate path and a sustained loss of the $0.0282 support, which would reopen the lows.
- Long-term view: the modeled path drifts higher into a late-decade cycle, but anything past 2030 is a direction of travel, not a dated target.
Live Kaspa price chart
The chart below tracks KAS/USD in real time; the levels that matter for the current setup are covered in the technical section further down.
Trading involves risk.
Kaspa price prediction 2026–2030 (yearly forecast)
The table below sets our expected band for each year, built from a single continuous monthly path. Longer-horizon targets from third-party models, which rest on very different assumptions and spread wide, are held back for the analyst section rather than folded in here.
| Year | Minimum | Average | Maximum |
|---|---|---|---|
| 2026 | $0.0287 | $0.0331 | $0.0385 |
| 2027 | $0.0357 | $0.0546 | $0.0820 |
| 2028 | $0.0720 | $0.0945 | $0.1151 |
| 2029 | $0.0667 | $0.0832 | $0.1014 |
| 2030 | $0.0598 | $0.0749 | $0.0889 |
Kaspa price prediction 2026
Our 2026 view keeps KAS anchored close to its late-August level near $0.03, averaging around $0.033 across the year, with no run back toward the 2024 peak. The range is $0.0287–$0.0385 — narrow by crypto standards, and the fingerprint of a coin building a base rather than trending.
For the remaining months of 2026, the month-by-month path holds KAS in a shallow, slightly rising band:
| Month (2026) | Minimum | Average | Maximum |
|---|---|---|---|
| August | $0.0287 | $0.0305 | $0.0323 |
| September | $0.0298 | $0.0318 | $0.0337 |
| October | $0.0309 | $0.0330 | $0.0351 |
| November | $0.0322 | $0.0345 | $0.0368 |
| December | $0.0335 | $0.0360 | $0.0385 |
Kaspa price prediction 2027
2027 is where the recovery gets going: the path lifts off the 2026 base toward the mid-$0.05s, a full-year range of $0.0357–$0.0820 averaging near $0.055. The step up leans on a broader ecosystem forming around Kaspa’s new smart-contract layer, not on one headline.
| Month (2027) | Minimum | Average | Maximum |
|---|---|---|---|
| January | $0.0357 | $0.0385 | $0.0412 |
| February | $0.0379 | $0.0409 | $0.0439 |
| March | $0.0401 | $0.0434 | $0.0466 |
| April | $0.0423 | $0.0458 | $0.0494 |
| May | $0.0445 | $0.0483 | $0.0521 |
| June | $0.0466 | $0.0508 | $0.0549 |
| July | $0.0496 | $0.0541 | $0.0586 |
| August | $0.0533 | $0.0583 | $0.0632 |
| September | $0.0570 | $0.0625 | $0.0679 |
| October | $0.0607 | $0.0666 | $0.0726 |
| November | $0.0643 | $0.0708 | $0.0773 |
| December | $0.0680 | $0.0750 | $0.0820 |
Kaspa price prediction 2028
2028 carries the cycle high in our model: the path crests past $0.10 before easing back, for a range of $0.0720–$0.1151 and an average near $0.094. The outlook places Kaspa’s next cyclical top in this window, in step with the post-halving rhythm that has governed proof-of-work markets.
| Month (2028) | Minimum | Average | Maximum |
|---|---|---|---|
| January | $0.0720 | $0.0796 | $0.0873 |
| February | $0.0760 | $0.0842 | $0.0925 |
| March | $0.0799 | $0.0888 | $0.0977 |
| April | $0.0839 | $0.0935 | $0.1030 |
| May | $0.0878 | $0.0981 | $0.1083 |
| June | $0.0918 | $0.1027 | $0.1136 |
| July | $0.0925 | $0.1038 | $0.1151 |
| August | $0.0902 | $0.1015 | $0.1127 |
| September | $0.0879 | $0.0991 | $0.1103 |
| October | $0.0856 | $0.0967 | $0.1079 |
| November | $0.0833 | $0.0944 | $0.1054 |
| December | $0.0810 | $0.0920 | $0.1030 |
Kaspa price prediction 2029
2029 is the give-back year after the top — a measured slide rather than a collapse, ranging $0.0667–$0.1014 with an average near $0.082.
| Month (2029) | Minimum | Average | Maximum |
|---|---|---|---|
| January | $0.0795 | $0.0905 | $0.1014 |
| February | $0.0779 | $0.0889 | $0.0999 |
| March | $0.0764 | $0.0874 | $0.0984 |
| April | $0.0749 | $0.0858 | $0.0968 |
| May | $0.0734 | $0.0843 | $0.0953 |
| June | $0.0719 | $0.0828 | $0.0937 |
| July | $0.0707 | $0.0816 | $0.0926 |
| August | $0.0699 | $0.0809 | $0.0919 |
| September | $0.0691 | $0.0802 | $0.0913 |
| October | $0.0683 | $0.0795 | $0.0906 |
| November | $0.0675 | $0.0787 | $0.0899 |
| December | $0.0667 | $0.0780 | $0.0893 |
Kaspa price prediction 2030
Our 2030 view spans $0.0598–$0.0889, averaging near $0.075. Half a decade out, the model tracks a trajectory instead of pinning a number, so treat the monthly path below as the shape of a cycle settling, not a set of appointments on a calendar.
| Month (2030) | Minimum | Average | Maximum |
|---|---|---|---|
| January | $0.0662 | $0.0775 | $0.0889 |
| February | $0.0656 | $0.0771 | $0.0885 |
| March | $0.0650 | $0.0766 | $0.0882 |
| April | $0.0645 | $0.0762 | $0.0878 |
| May | $0.0639 | $0.0757 | $0.0874 |
| June | $0.0634 | $0.0752 | $0.0871 |
| July | $0.0628 | $0.0747 | $0.0866 |
| August | $0.0622 | $0.0742 | $0.0862 |
| September | $0.0616 | $0.0736 | $0.0857 |
| October | $0.0610 | $0.0731 | $0.0852 |
| November | $0.0604 | $0.0725 | $0.0847 |
| December | $0.0598 | $0.0720 | $0.0842 |
Kaspa long-term price prediction: 2035, 2040–2050
Push a forecast a decade forward and precision quietly leaves the room. No model prices in the halvings, protocol rewrites, and rate regimes that haven’t happened yet, so the figures below are a rough arc, not marks to hit — and the uncertainty compounds with every year added. Read that way, our long-range path grinds higher without ever pretending to a moonshot:
| Year | Minimum | Average | Maximum |
|---|---|---|---|
| 2035 | $0.0858 | $0.1100 | $0.1342 |
| 2040 | $0.1224 | $0.1700 | $0.2176 |
| 2050 | $0.1386 | $0.2100 | $0.2814 |
What analysts and models say (compared)
Kaspa forecasts split hard once you look past the current year. Algorithmic models cluster near $0.033–$0.038 for 2026, but their 2028–2030 paths fan out from roughly $0.05 to well past $0.20, depending on whether the model expects a real cycle peak or a flat grind. Blending numbers built on incompatible assumptions would only blur the picture, so they sit side by side instead.
| Source | Method | Kaspa view |
|---|---|---|
| Changelly | Algorithmic | 2026 avg ~$0.033; 2028 avg ~$0.178 (range ~$0.10–$0.24); 2030 avg ~$0.10 |
| CoinCodex | Algorithmic | End-2026 ~$0.038; end-2030 ~$0.10; 2040 ~$0.23 |
| BeInCrypto (aggregate model) | Algorithmic | 2026 avg ~$0.038 (range ~$0.025–$0.065); 2029 avg ~$0.051 |
| DigitalCoinPrice / Coingabbar | Algorithmic / editorial | Near-term targets in the $0.10–$0.13 area on a strong move |
The disagreement is the signal. Changelly pencils in a full cyclical surge that carries KAS back toward its old high by 2028, while BeInCrypto’s aggregate keeps the coin grinding sideways in the low single cents for years. Both read the same tokenomics and the same chart; they simply bet differently on whether a new demand story lands. Anyone hunting a single Kaspa number will not find consensus here, and pretending otherwise would be the dishonest move.
Track record of this forecast
This is the first Kaspa forecast PrimeXBT has published. Starting with the next monthly review, this section will hold the prior forecast against KAS’s actual price on the update date and account for any gap plainly, rather than quietly re-baselining.
Kaspa technical analysis
KAS sits wedged between the two moving averages traders watch most. It trades above its 50-day simple moving average near $0.0308, which shows it has clawed back from the local lows, but below the 200-day average near $0.0340 — evidence the longer trend still points down. The RSI has hovered around 60 in late August, neutral-to-firm with no overbought stretch, while the broader market Fear & Greed Index reads in “Greed” territory.
The support and resistance that frame the setup: support at $0.0302, then $0.0290, with a deeper floor at $0.0282; resistance at $0.0323, then $0.0331, with the 200-day average near $0.0340 capping the range. Reclaiming that 200-day line would be the cleanest tell that the downtrend has finally rolled over. For readers new to these tools, PrimeXBT’s guide to crypto technical analysis walks through how the levels are drawn.
Correlation with other assets
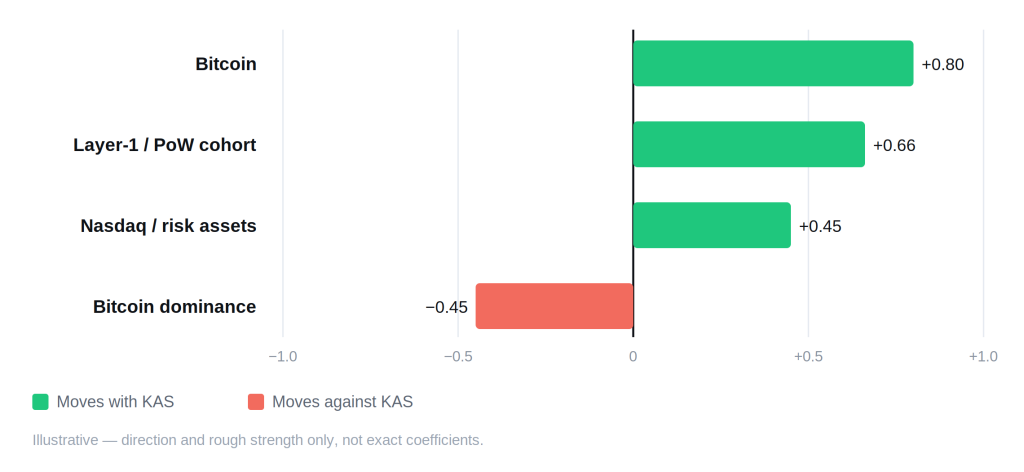
Kaspa moves first and foremost with Bitcoin, and the tie runs deeper than sentiment: both are proof-of-work coins, so the same mining economics, hash-price swings, and energy costs push on them at once. Within crypto, KAS trades as part of the Layer-1 and proof-of-work cohort, rising and falling with peers that share its narrative. It also tracks risk assets like the Nasdaq more closely than it did in its early retail-only days, which is why rate expectations now register in the price within hours. The one relationship that runs the other way is Bitcoin dominance: when money crowds into Bitcoin and dominance climbs, smaller Layer-1s like Kaspa tend to bleed. None of these ties are bolted down — they loosen and tighten with the cycle, and a single macro shock can rewire them overnight.
Fundamental factors
Kaspa is a proof-of-work Layer-1 built on GHOSTDAG, a protocol that lets the network confirm many blocks per second by ordering a directed acyclic graph of blocks instead of forcing them into a single chain. The practical effect is Bitcoin’s security model at a speed retail users can feel. The Crescendo hard fork, live on mainnet since May 5, 2025, lifted the block rate to 10 blocks per second, a tenfold jump that turned Kaspa’s throughput from a promise into a shipped feature.
The supply story is unusually clean. Kaspa launched in November 2021 with no premine, no ICO, and no insider allocation — every coin has been mined in the open. Emission follows a “chromatic” schedule that trims the block reward every month by a fixed factor, the smooth monthly equivalent of an annual halving. That design front-loaded issuance: with a maximum supply near 28.7 billion KAS, roughly 27.7 billion — about 96% — is already circulating, so the inflation still to come is small and shrinking. Little fresh supply means price leans harder on demand than on dilution.
Demand is where the newest chapter opens. Kaspa spent its first years as a pure payments-and-settlement coin with no smart contracts; that changed when the Kasplex zkEVM Layer-2 mainnet went live on August 31, 2025, bringing Ethereum-compatible contracts to the network for the first time and opening the door to on-chain finance. Whether developers actually build there is the open question underneath every bullish 2027–2028 forecast.
Upcoming catalysts
Only confirmed, dated events make the list. With Kaspa now tracking risk appetite, U.S. monetary policy is the clearest near-term lever.
| Date | Event | Potential impact |
|---|---|---|
| September 15–16, 2026 | FOMC meeting | Bull if the Fed signals cuts; bear if it holds rates higher for longer |
| October 27–28, 2026 | FOMC meeting | Rate path steers risk appetite across the Layer-1 cohort |
| December 8–9, 2026 | FOMC meeting | Year-end policy signal that frames 2027 positioning |
FOMC dates follow the Federal Reserve’s published 2026 schedule. Kaspa’s own roadmap items — further Kasplex ecosystem releases and protocol work — are not listed here because none carry a confirmed mainnet date, and a guessed date would be fiction, not a catalyst.
Bull case vs bear case
Bull case:
- Kasplex draws real developers, and a DeFi ecosystem gives KAS demand beyond payments.
- The Fed eases, and capital rotates back toward proof-of-work Layer-1s.
- Near-complete emission leaves almost no new supply to absorb fresh buying.
- The 10-block-per-second throughput wins Kaspa a niche in fast, low-fee settlement.
Bear case:
- Smart-contract activity stays thin, and the L2 narrative fizzles before it compounds.
- Rates stay high, keeping speculative Layer-1s starved of flows.
- KAS keeps lagging Bitcoin while dominance grinds higher.
- Momentum fades and the low-$0.03 support shelf cracks.
Invalidation levels. The bull case loses its footing if KAS closes under $0.0282, the deeper support and the floor of the current base. The bear case breaks on a sustained reclaim of the 200-day average near $0.0340 — around 10% above the late-August price, and the line that would flip the longer trend. The nearer downside trigger, $0.0282, sits a few percent below spot.
Historical performance
Kaspa’s short life has been a single boom-and-bust arc, not a staircase. Fair-launched in late 2021, KAS climbed for nearly three years to a record near $0.207 by mid-2024, then surrendered roughly 85% of that into late 2026. The coin has never traded through a full multi-year cycle, which is exactly why its next one carries more forecasting risk than a Bitcoin or an Ethereum — there is less history to lean on and more story left to write.
Is Kaspa a good investment in 2026?
Kaspa is a bet on one specific thing: that a fast, fairly-launched proof-of-work chain can graduate into a smart-contract platform before the market loses patience. The near-term math is sober — our outlook keeps KAS averaging around $0.033 for 2026, basing rather than breaking out. The facts underneath are mixed: emission is nearly done so supply pressure is light, the technology shipped its speed upgrade and its L2, yet on-chain adoption is still unproven and the price sits about 85% below its high. Whether that reads as a discount or a warning depends on how much credit a reader gives the roadmap. PrimeXBT’s primer on the types of cryptocurrencies helps place where a coin like Kaspa fits.
How to trade crypto on PrimeXBT
PrimeXBT lets you take a position on major cryptocurrencies in either direction. CFDs can be traded long or short, so a view can be expressed whether you expect a coin to rise or fall — see the guide to short selling for how the downside side works. Leverage cuts both ways, magnifying losses just as fast as gains, so a stop-loss and sensible position size do real work on any trade. Trade on your own analysis and risk tolerance, and never risk more than you can afford to lose.
Trading involves risk.
How we build this forecast
PrimeXBT’s analysts assemble this outlook rather than copy it from one price feed. The starting point is where KAS trades today, read against its 50- and 200-day moving averages and the support and resistance shelves that box in the current range. On top of that sits the fundamental picture — near-complete emission, the Crescendo speed upgrade, the Kasplex smart-contract layer and whether it draws builders — and the macro backdrop, chiefly the path of U.S. interest rates that now moves proof-of-work coins in near lockstep with other risk assets. The yearly bands blend that technical read with the fundamental and macro view; the long-range figures lean on trajectory over precision.
None of it is a guarantee. Kaspa is young, volatile, and thinly seasoned, and one adoption surprise or macro shock can move it faster than any model expects. Treat every figure here as a considered estimate, not a promise — the outlook is revisited and updated monthly as the data shifts.
How much will Kaspa be worth in 2026?
Our outlook averages around $0.033 for 2026, with the year basing near current levels rather than trending.
How much will Kaspa be worth in 2030?
Our long-range view centers near $0.075 for 2030, after a modeled cycle peak in 2028. That far out the plausible band is wide and a single cycle can reshape it, so weight the number lightly.
What will Kaspa be worth in five years?
See 2030 above. On this horizon, read any single figure as a direction rather than a target — the honest range spans several cents in either direction.
Can Kaspa reach $1?
Not on our numbers. The top of our modeled range peaks near $0.12 around 2028, so $1 would require a demand cycle far larger than anything the current data supports — roughly a thirty-fold move from today.
When did Kaspa get smart contracts?
The Kasplex zkEVM Layer-2 mainnet went live on August 31, 2025, bringing Ethereum-compatible smart contracts to Kaspa for the first time. Kaspa's base layer remains a proof-of-work BlockDAG focused on fast settlement.
Author



 Risk Disclaimer
The content provided here is for informational purposes only. It is not intended as personal investment advice and does not constitute a solicitation or invitation to engage in any financial transactions, investments, or related activities. Past performance is not a reliable indicator of future results.
The financial products offered by the Company are complex and come with a high risk of losing money rapidly due to leverage. These products may not be suitable for all investors. Before engaging, you should consider whether you understand how these leveraged products work and whether you can afford the high risk of losing your money.
The Company does not accept clients from the Restricted Jurisdictions as indicated in our website/ T&C. Some services or products may not be available in your jurisdiction.
The applicable legal entity and its respective products and services depend on the client’s country of residence and the entity with which the client has established a contractual relationship during registration.








